- There are 30 Global Systemically Important Banks (G-SIBs) in 2019.
- A bank must hold at least an extra 1% in Tier One capital as a result of qualifying as a G-SIB.
- We look at the calculations necessary to work out a bank’s G-SIB score and calculate the exact values for 2019.
- We estimate that HSBC saved 0.5% in Tier One capital by compressing €4.3Trn in derivatives notional.
This week I received the below from the Financial Stability Board:

I wasn’t familiar with Gobal Systemically Important Banks and what makes a G-SIB a G-SIB.
Of course, my first port of call was the Clarus blog to see what we had written previously about it.
I was astounded to find that we’ve never covered this topic. How is that possible? Massive negative marks for us for slacking off. Tut tut.
I’ll try to put that right over the next ~800 words.
Global Systemically Important Banks
The G-SIBs regime I find somewhat peculiar:
- Banks are assessed on 12 indicators as to how systemic and how global they are.
- Banks are then ranked and given an overall score across these 12 indicators.
- As a bank, your ultimate score is not only reliant on your own activity – it is also subject to what your peers are doing.
- For example, if you end up NOT compressing derivatives notional and all of your peers are compressing like mad, then you will carry a higher score on the Derivatives Notional indicator.
Depending on a bank’s score at the end of this quantitative assessment, an additional amount of Tier One capital (CET1, Common Equity Tier 1) must be held by the bank. The exact amount ranges from an additional 3.5% to zero (see table below).

In 2019, 30 banks qualified for the Bucket 1 designation or higher. They were therefore required to hold at least an additional 1% of Tier One Capital as a result of being classified as a G-SIB.
Tier One capital is expensive. It is typically estimated to carry a cost of around 10-15% per year. This is the expected average Return on Equity that the banking industry operates under.
The 12 Indicators of G-SIB
The 12 indicators over which banks are assessed are as follows:
- Total Exposures – 20% weighting
- Intra-financial system assets – 6.7% weighting
- Intra-financial system liabilities – 6.7% weighting
- Securities Outstanding – 6.7% weighting
- Total Payments – 6.7% weighting
- Assets Under Custody – 6.7% weighting
- Underwriting Activity – 6.7% weighting
- Notional amount of OTC Derivatives – 6.7% weighting
- Trading and AFS Securities – 6.7% weighting
- Level 3 Assets – 6.7% weighting
- Cross-Jurisdictional Claims – 10% weighting
- Cross-Jurisdictional Liabilities – 10% weighting
It is notable therefore how crude some of these measures are. For example, from a derivatives perspective:
- The Total Exposures indicator includes Potential Future Exposures from OTC Derivatives, that I believe are calculated using the CEM methodology.
- Even more crude, banks must report the notional amount of OTC Derivatives. Yup, that is a notional-based, not a risk-based measure.
Therefore, whilst gross notional may no longer be a driver of Leverage Ratio under the SA-CCR regime, it will continue to be vital for the purposes of calculating G-SIB scores. And when up to 3.5% of Tier One capital is at stake, that means getting rid of gross notional will continue to be a core strategic goal for derivatives markets.
Overall Score
The indicators above are classified into 5 groups. The overall score for a bank is the simple average of those five groups.
The indicator within each group is calculated as:
\( \tag {1} Indicator_{i,b} = \dfrac{Exposure_ {i,b}}{ \sum\limits_{b=1}^n Exposure_{i,b}}\)This is then multiplied by the weighting detailed in the list above to give an overall score per bank. Note that there are certain subtleties, such as rounding to the nearest whole basis point and capping the Substitutability indicators at 5%.
Crucially, the indicators are measured relative to all banks within a sample defined by the Basel Committee and National supervisors. It currently stands at 76 banks, nominally based on the largest Basel III leverage ratio exposures.
The 2019 G-SIBs
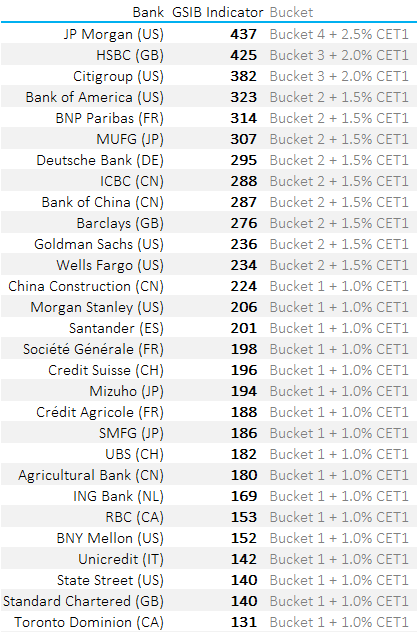
The Financial Stability Board published this list of 2019 G-SIBs last week. I found it a bit underwhelming as it didn’t include the actual scores of each bank. Given that the buckets are digital and cliff-edge in nature, I really wanted to know where each bank was in the scale.
Remember that the precise scales that apply are:
Therefore I calculated the exact scores per bank:
Some notes;
- Don’t take these scores as gospel. I’ve cross-checked the output versus the bands and it is accurate apart from BPCE which misses out by 1 point. I’m putting that down to rounding.
- I sanity-checked versus previous years at the OFR website here. The American bank values all look pretty similar to previous years.
- US banks use a “Method 2” scoring system under the final implementation, which results in higher capital.
The more incredible things I find are:
- HSBC were very close to the 430 barrier and an additional 0.5% of capital. According to our calculations, thanks to compressing €4.3Trn of Derivatives Notional, they have saved 0.5% Tier One capital!
- Equally, JP Morgan are very close to being under the 430 barrier (about €6.6Trn of compression away). It will be interesting to see where they are under the US scoring system (see below).
- TD are the new entrant and only just qualified – by 1 point. That is an expensive point (+1.0% in capital!).
- Both Standard Chartered, State Street and Unicredit could drop out of Bucket 1 with some work. But they will need to outpace their peers to do so.
Please note that we don’t know how much Derivatives notional any particular bank actually compresses. But it seems a fair estimate for HSBC that during the year they will have compressed at least €4.3trn. Recall that LCH SwapClear is compressing over $2Trn every single day!
G-SIBs in the US
Finally, I believe that the Federal Reserve “gold-plated” the G-SIB methodology from the BIS when they implemented it in July 2015. As well as calculating the above scores, there is another very similar “Method 2” calculation performed for US banks, including a measure of the firm’s reliance on short-term wholesale funding.
We’ll take a look at that in a future blog, but that is why you will see different numbers reported for US banks, such as in this Reuters article today.
Therefore, whilst our estimate for JP Morgan compression activity stands, we note that under “Method 2” the results could be different.
In Summary
- The G-SIB classification is a core component of bank regulatory capital.
- It is crucial for banks to know and monitor their own G-SIB scores, because classification is performed relative to peer banking groups.
- We detail the calculations and show indicative values for 2019.
- We find that the G-SIB scores are sensitive to gross notional of derivatives contracts.
- For example, HSBC saved 0.5% in Tier One capital thanks to €4.3Trn of derivatives compression.