
- 4.7% of derivatives risk was transacted versus an RFR in June 2020.
- June 2020 was a record month for the proportion of risk transacted versus SOFR in USD markets.
- €STR is at the beginning of adoption following the CCP discounting switch last week.
- JPY TONA sees a significant proportion of risk transacted in longer maturities.
Last week saw the first publication of the ISDA-Clarus RFR Adoption Indicator. To help introduce the indicator we take an in-depth look at the data below.
What Is It?
The ISDA-Clarus RFR Adoption Indicator (and the five sub-indicators) monitor how much derivatives trading activity is being conducted in risk-free rates (RFRs). It covers six currencies (USD, EUR, JPY, GBP, AUD and CHF).
It does this by calculating the risk-weighted amount of activity (DV01) across all interest rate derivatives, and then calculates the percentage of activity that was in RFRs.
In June 2020, the ISDA-Clarus RFR Adoption Indicator was at 4.7%:

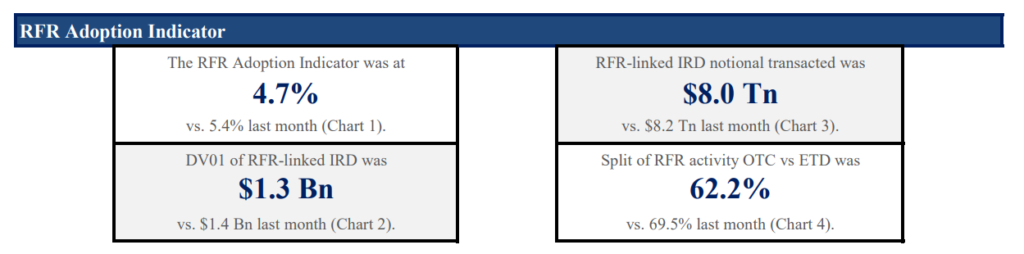
What this means is:
- 4.7% of the risk traded across all interest rate derivatives products (swaps and futures) was against an RFR index during June 2020.
- The total DV01 of all of those RFR derivatives transactions added up to $1.3bn.
- The total size of the IRD market (across both OTC/swaps and ETD/futures) was $27.9bn DV01.
We also include a measure of the total notional traded versus RFR indices in the six currencies that we monitor, as well as a DV01-weighted split by product:
- $8Trn of RFR-linked notional traded during June 2020.
- 62.2% of RFR-linked DV01 was traded in OTC markets, with the remainder in ETD markets.
SOFR
Moving away from the headline 4.7% overall indicator, we felt it important to provide context to this number by providing currency-, product- and maturity-specific breakdowns.
Nowhere is this more important than in the USD markets and SOFR.
Our data calculates RFR adoption from a DV01 perspective. This maturity-agnostic measure of activity gives a true reflection of the amount of risk being traded against any given index. In the case of SOFR, we see the following history since 2018:

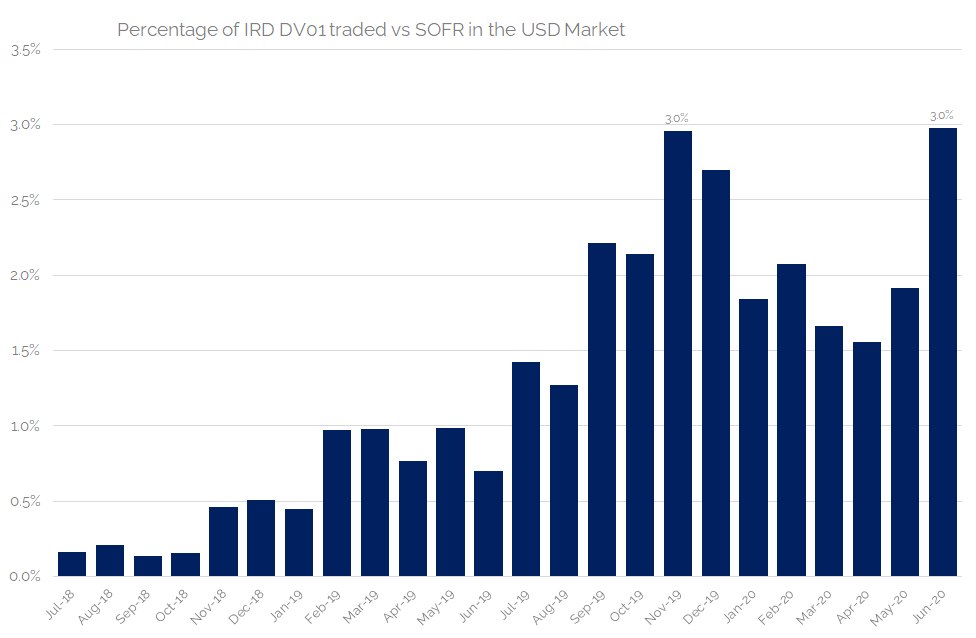
Showing;
- In June 2020, 3% of the overall USD IRD market was traded versus SOFR.
- This was a new all-time high for SOFR activity, as measured by share of DV01.
- June 2020 saw considerably more activity than any other month this year.
- At 3.0%, it is almost identical to the previous high, set in November 2019 (June was higher on the second decimal point).
- This time-series is available every month on charts 5a and 5b of the monthly ISDA-Clarus RFR Adoption Indicator report.
This measure of SOFR adoption will be particularly crucial as we head toward the anticipated discounting switch at the CCPs in October.
Talking of which….
€STR
The timing for the first publication couldn’t have been better as we monitor the uptake of €STR trading following the discounting switch at CCPs last week.
There was almost no €STR activity in May and June, as shown on Chart 5b of the monthly report:

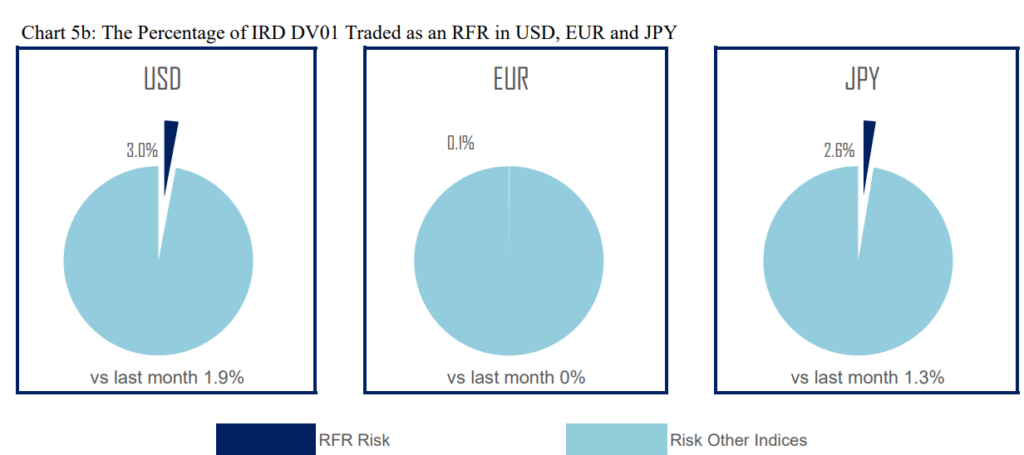
Monitoring the uptake of €STR is an important goal of the indicators, particularly as EONIA was one of the most successful OIS indices in terms of activity beyond two year tenors.
We already know that July promises to be a record month for €STR activity (judging by SDR activity). And more tellingly, Markit have released some data that shows €STR activity doubled after the discounting switch.

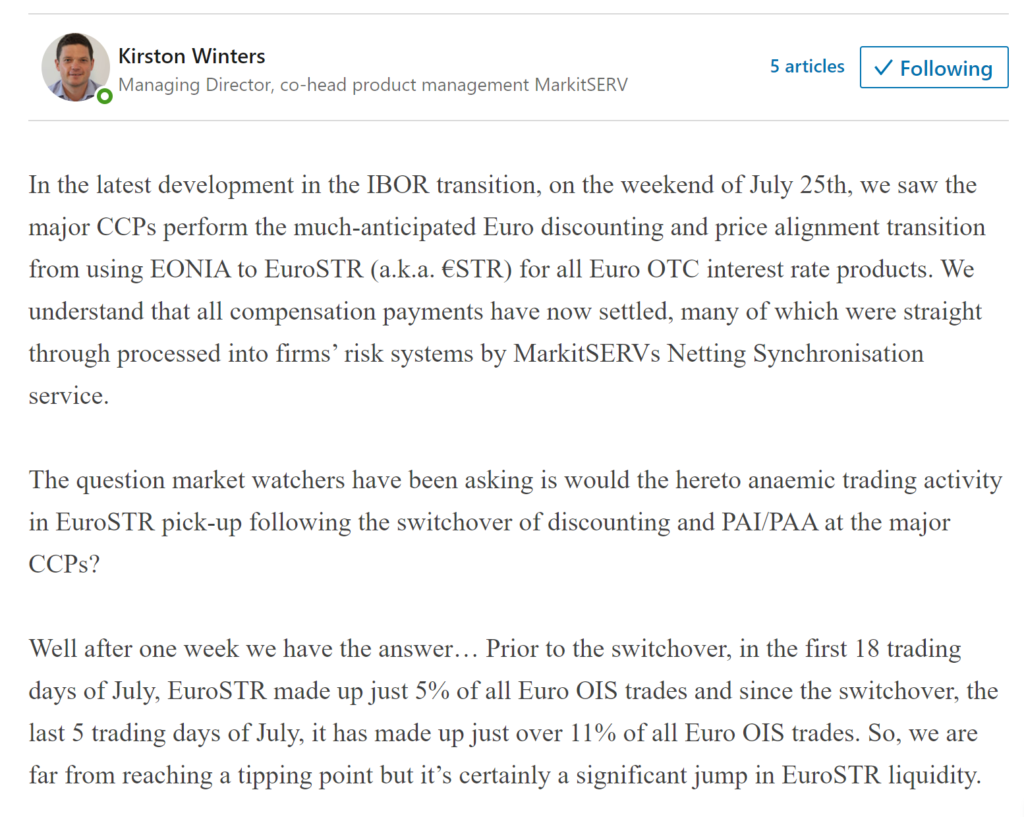
The MarkitSERV data above is based on the entire global market (cleared and uncleared). We believe that close to 100% of €STR activity is cleared, therefore this increase in activity should also be apparent in next month’s ISDA-Clarus RFR Adoption Indicator. Stay tuned.
TONA
Finally, I wanted to talk briefly about the JPY market. We haven’t covered this much on this blog, so here are some background details:
- The RFR in JPY is TONA. This is the existing index that is already used on JPY OIS trades. TONA therefore has more parallels with GBP SONIA rather than USD SOFR.
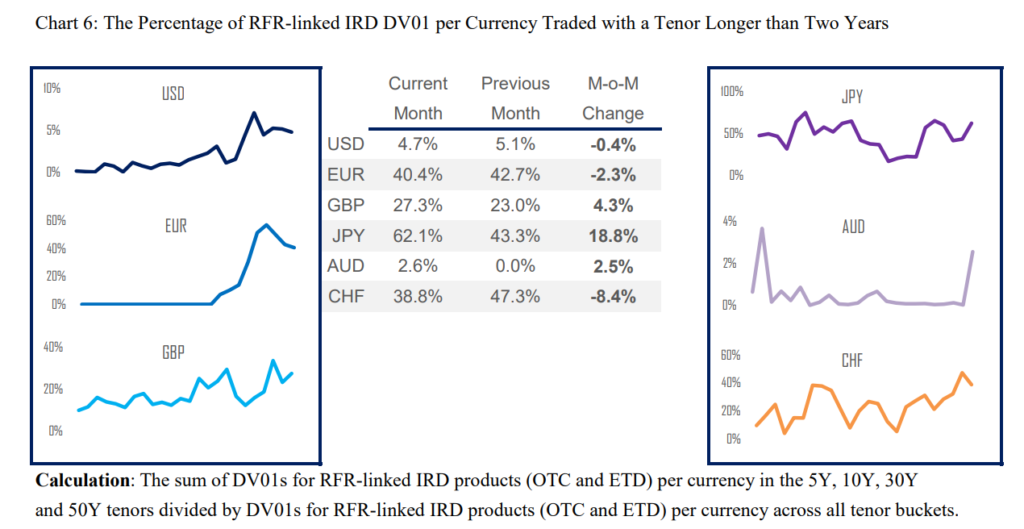
- JPY TONA has an active market beyond two year maturities. For example, GBP SONIA saw 27.3% of activity in tenors longer than two years last month. TONA saw 62.1% of activity >2Y (see JPY chart below).

- Points (1) and (2) above suggest that the TONA market is already a mature, well-developed market.
- However, the RFR Adoption Indicator for TONA was at 2.6% in June 2020, and has not been above 4.2% in our history. This is far below e.g. GBP SONIA which has seen levels as high as 41% (January 2020).
OIS products may see more levels of activity when central banks are changing rates (which is unlikely in the case of the BoJ), but the fact that TONA has an active long-dated market is very positive for LIBOR transition. It suggests that market participants are ready for TONA to step into the shoes of LIBOR already. It will be intriguing to see how quickly this can happen.
In Summary
- The ISDA-Clarus RFR Adoption Indicator was at 4.7% in June 2020.
- This is a DV01-weighted measure of the amount of risk transacted versus an RFR across OTC and exchange traded derivatives markets.
- The indicator covers six currencies.
- In USD markets, June 2020 was a record month for the proportion of risk transacted versus SOFR (at 3.0% of the total).
- Developments in €STR will be closely watched over the coming months after the discounting switch at the CCPs.
- JPY TONA already sees significant long-dated activity.