

- SIMM for Excel performs ISDA SIMM™ Initial Margin calculations from Excel.
- Free 14-day trials are available for all financial firms.
- Reconcile ISDA SIMM calculations.
- Perform pre-trade analysis of your bilateral trades quickly, simply, reliably.
- The functions calculate Initial Margin across a whole portfolio.
- Users can also create CRIF sensitivities from trade-level details.
Functions That Won’t Kill Excel
Our analytics should be available to as many people as possible. Afterall, it’s pretty pointless building software if no one uses it. This means making analytics that are intuitive and easy-to-use, but also being able to offer high performance without putting demands on users to “install” standalone programmes.
A typical Excel Add-In is great, but I know from experience that they can constrain the performance of either a single Excel session or at worst the whole PC.
We therefore asked ourselves if we could perform all of the calculations remotely, and just send users the results into Excel? Step forward, SIMM for Excel.
Our development has been driven by the popularity of our ISDA SIMM in Excel blogs. Writing those blogs informed our solution because;
- The standard equations can be implemented in Excel, but they are daunting.
- A single asset class is fairly workable in Excel using native functionality.
- Working with multiple asset classes is much more difficult.
- Working across multiple counterparties results in a huge Excel spreadsheet.
- Debugging such a spreadsheet is an operational risk.
And yet, people were clearly interested in an Excel solution. What to do?
Our solution is simple. Cloud-hosted analytics are made available to users via a data connection in Excel. Send us the function name and parameters and we do the rest remotely. Then we send the results back to your Excel spreadsheet.
CLARUS Functions
Access to the Clarus functions via our 14 -day free trial gives you two different functionalities – Margin calculations and CRIF file generation. We provide an example workbook of how these functions work, and I walk through the files below.
We’ve put the functionality into an example workbook that includes macros. We also expect our users to take this much further than these simple examples, therefore an Excel Add-In is also available.
Do you have a CRIF file?
First things first – do you have a CRIF file or do you need to generate one? The “Common Risk Interchange Format” (CRIF) is the ISDA SIMM standard format for risk sensitivities, and hence standardises the inputs to margin calculations.
Yes – I have a CRIF file 🙂
Great. This means that you can proceed directly to margin calculations in Excel. Our example worksheet is called “WhatIf CRIF”. You should simply copy/paste your own CRIF data into the spreadsheet:
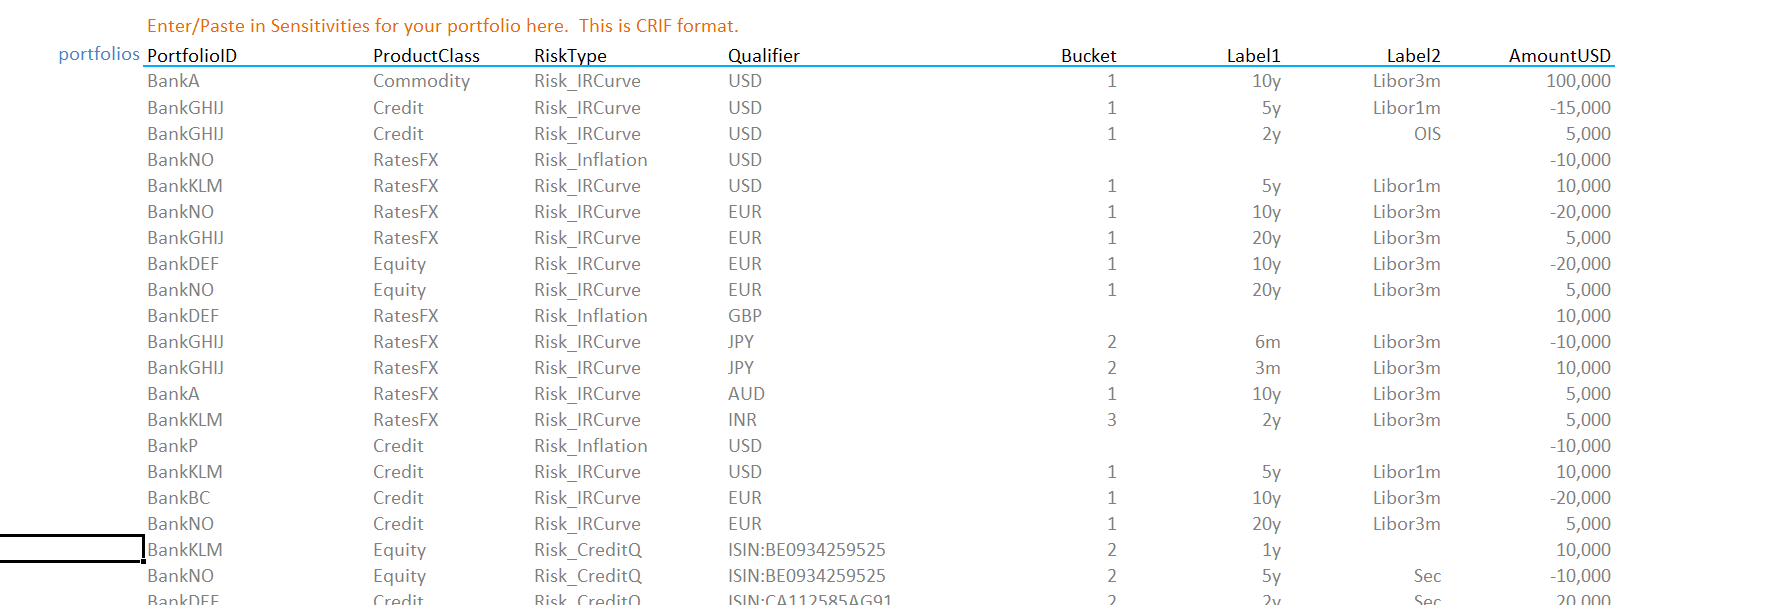
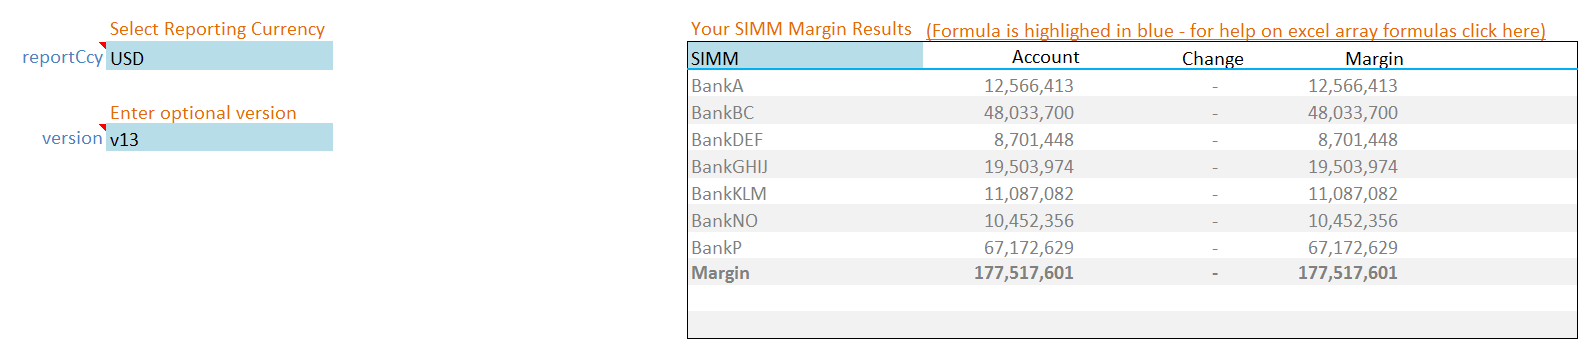
You can choose your reporting currency (typically USD) and your version number of ISDA SIMM (v1.3 is current…we support them all. Try doing that natively in Excel!).
In Excel, just type:
=SIMM_MARGIN(<Range of data>)
The output is shown below:
No – I don’t have a CRIF file 🙁
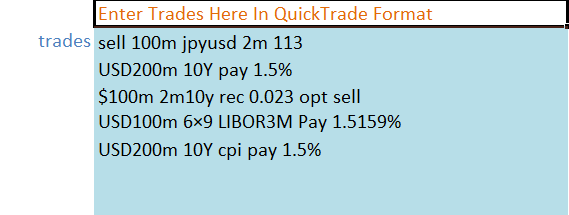
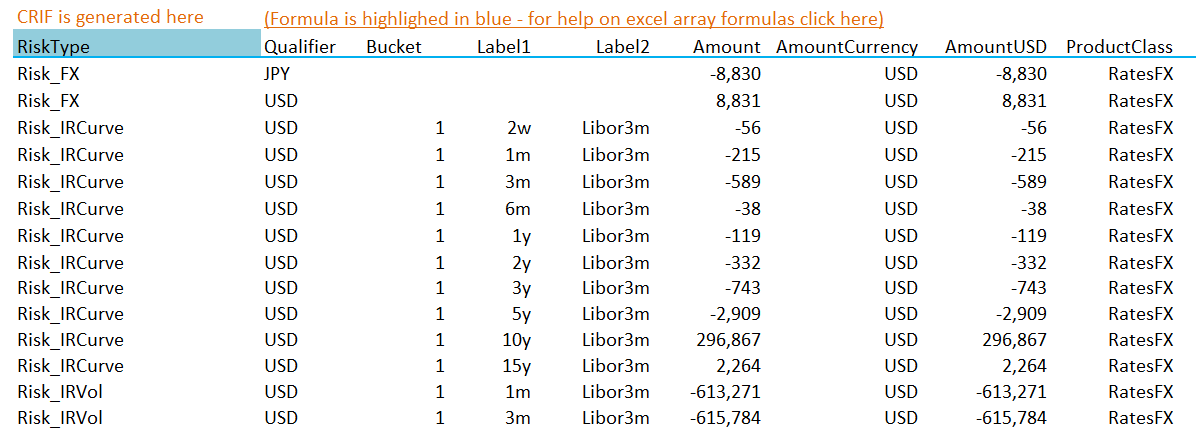
Next, we call the Sensitivity generator via the formula:
=SIMM_SENSITIVITY(<Range of data>)
This example is from our worksheet “Generate CRIF” in our example Workbook. The output is shown below:
A Productivity Toolkit
We provide an example workbook when you start your free 14 day trial of SIMM for Excel. This includes the examples above.
For more advanced users, we can also supply an Excel Add-In. This includes a single CLARUS function that can be used to perform multiple different calculations, for example:
=CLARUS("SIMM","Margin",<Range of data>)
=CLARUS("SIMM","Sensitivity",<Range of data>)
We also provide an example workbook with the add-in to get you started.
Speed and Simplicity
A key goal of ours is to provide a high performance solution. If you are familiar with SIMM, the challenge in Excel is efficiently implementing the following formula;
\( \tag {1} K = \sqrt{\sum\limits_{i,k}{WS_{k,i}^2+{\sum\limits_{i,k}}{\sum\limits_{(j,l)≠(i,k)}{φ_{i,j}{ρ_{k,l}}{WS_{k,i}}{WS_{l,j}}}}}}\)It is relatively straight-forward for a single risk-factor, although the formula looks something like this:
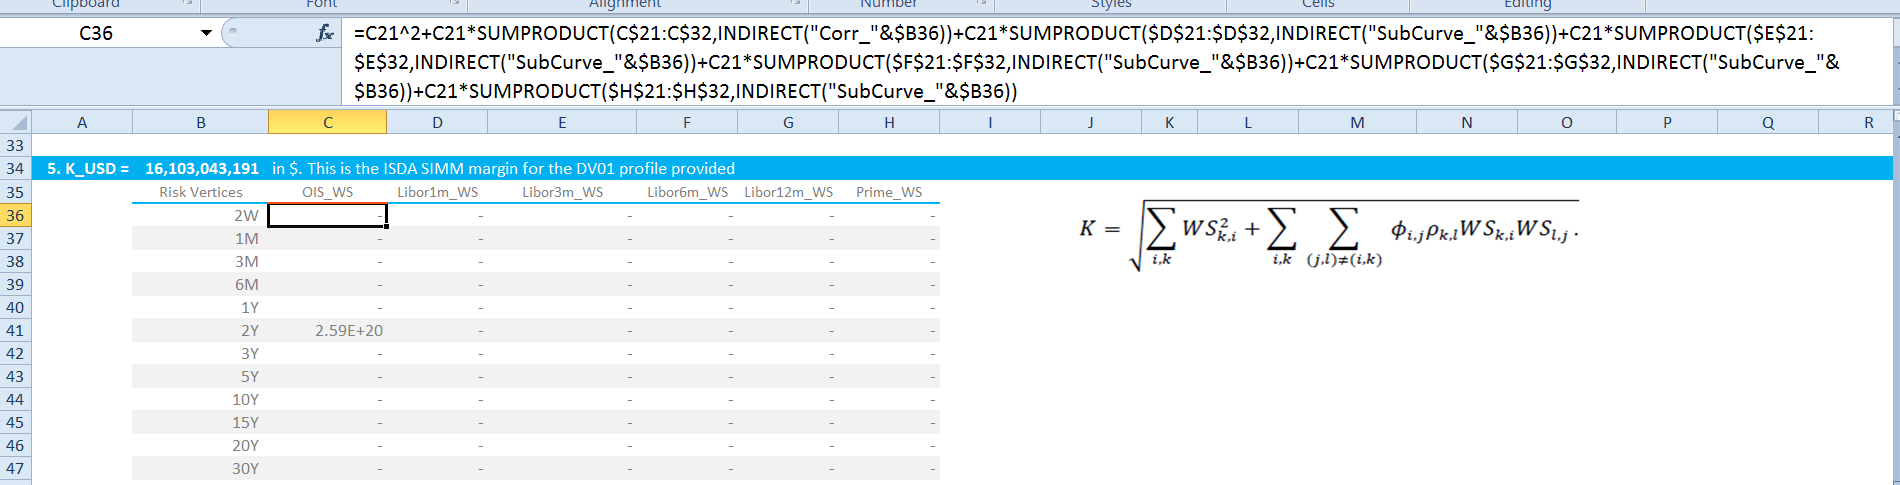
Showing;
- Three lines of Excel formula for each risk vertex (i.e. for every maturity bucket on each index in USD Rates alone).
- This formula is repeated 72 times!
- And that is for a single counterparty and only for USD Rates!
- This excludes Inflation, and takes no account of new indices introduced by ISDA SIMM (new RFRs for example, or muni swaps).
As we have described, our Excel solution is very simple. Our Excel spreadsheet for multiple counterparties, across all asset classes, across all currencies reduces to:
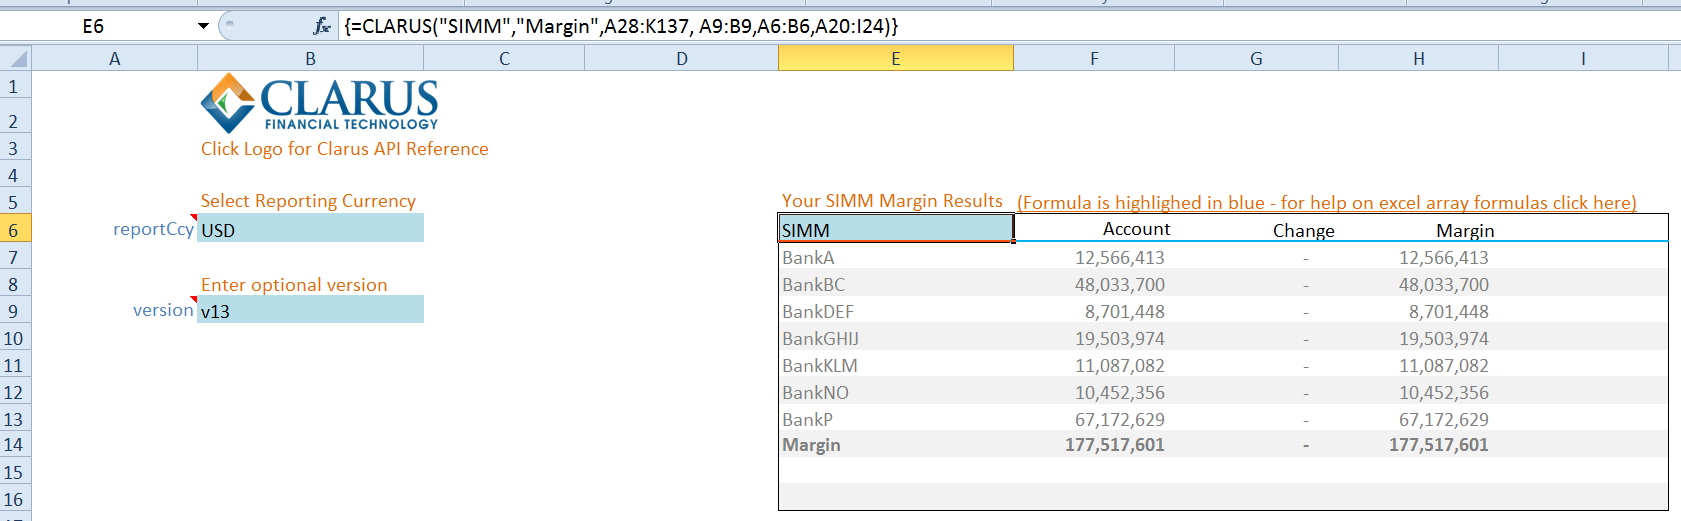
- This is very liberating from an Excel perspective.
- This spreadsheet covers 7 counterparties across all Asset Classes. There are over 100 risk factors.
- There are exposures to linear products in IRS, Inflation, Credit, FX, Equities and Commodities. Plus non-linear exposures to all of those asset classes.
- We calculate Delta IM, Vega IM and Curvature IM.
- To do this calculation in Excel, a conservative estimate would entail 60,000 calculations (100+ risk factors across 7 counterparties covering Delta, Vega and Curvature).
- We reduce that to a single CLARUS function!
We believe that this architecture liberates our users to concentrate on the important aspects of the business. It enables the analysis to be user-directed (like our data products), not constrained by a GUI or pre-ordained queries.
SIMM for Excel allows users to concentrate on the business – reducing margin, optimising exposures across counterparties and efficiently managing risk – rather than maintaining cumbersome spreadsheets.
Are There Any Gotchas?
You need to work with “array” formulas in Excel. These formulas must be entered using the “Three Finger Salute” (CTRL+SHIFT+ENTER). We cover the basics in our Get Started guide, and there are many additional resources out there.
In Summary
- Calculating ISDA SIMM in Excel quickly runs into 10’s of thousands of calculations.
- Maintaining the spreadsheets and keeping up to date with changes in the SIMM model is an onerous business challenge.
- CLARUS have therefore launched SIMM for Excel.
- Our Excel functions calculate SIMM margin via our cloud hosted analytics.
- It provides high performance, scalable and reliable calculations for a post-UMR world, all from your own spreadsheets.
Sign up now for your free 14-day trial of SIMM for Excel.
We look forward to seeing what our users get up to with this new toolkit!