Continuing with our monthly Swaps review series, let’s look at volumes in January 2017.
Summary:
- USD IRS price-forming volume > $2.3 trillion gross notional
- 21% higher than a year earlier
- On SEF vs Off SEF at 62% to 38% is lower than average; 65% to 35%
- SEF Compression activity in USD IRS was > $220 billion
- USD OIS volume at > $1.5 trillion, 12% higher than a year earlier
- On SEF EUR, GBP, JPY IRS volumes at > $250 billion are up 64% from a year earlier
- SEF Compression in EUR, GBP, JPY was also strong at > $56 billion
- Volume for USD, EUR, GBP, IRS, OIS, Basis Swaps was $1.5 billion DV01
- Bloomberg re-gaining its lead from Tradeweb
- ICAP, Tullet, Tradition each up from prior months
- As were BGC and DW
- CME–LCH Switch volume was a record $116 billion gross notional
- Driven by Tullet with $38b in 2Y
- An unusually large volume in 2Y, where the basis is only 0.1bps
- Global Cleared Volumes are up at $19.4 trillion
- LCH SwapClear up 9%
- In Asia volumes are similar to the prior month
- In LatAm volumes are up with CME gains
- Inflation Swaps at LCH SwapClear just above their Nov high
- NDFs steady at LCH ForexClear and close to recent highs
Onto the charts, data and details.
USD IRS ON/OFF SEF
Using SDRView the gross-notional volume (in $billions) of On and Off SEF USD IRS Fixed vs Float price forming trades (Outrights, SpreadOvers, Curve/Flys).
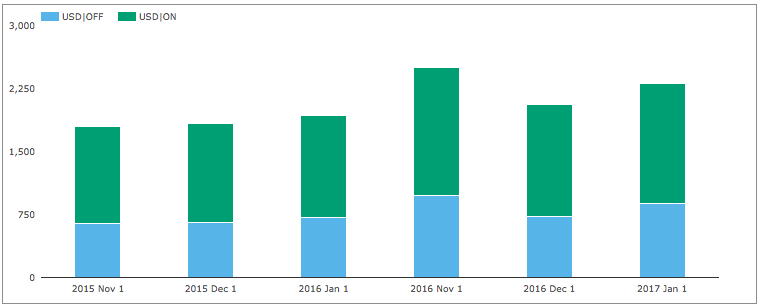
Showing:
- January 2017 On SEF gross notional is > $1,430 billion ($1.43 trillion)
- (recall capped trade rules mean this is understated as the full size of block trades is not disclosed)
- This is 19% higher than January 2016
- January 2017 Off SEF gross notional is > $880 billion
- 23% higher than January 2016
- And On SEF vs Off SEF is 62% to 38%
- Lower than the 65% to 35% average
Next splitting by package type and showing On SEF DV01 (adjusted for curves and flys).
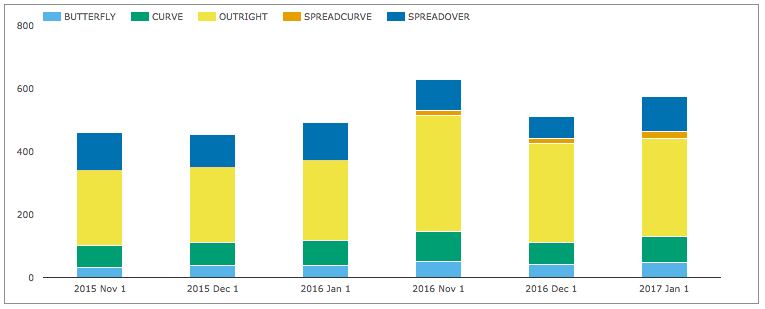
Showing:
- In DV01 terms January 2017 was 17% higher than January 2016
- Overall >$570 million of DV01 was traded in the month
- (recall capped trade rules mean this is understated)
And gross notional of On SEF non-price forming trades; SEF Compression and Rolls.
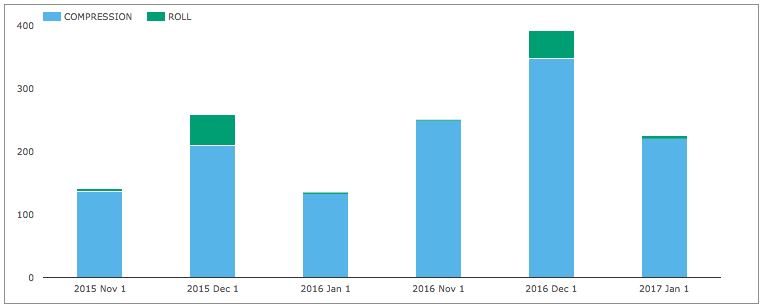
Showing:
- SEF Compression in January 2017 was > $220 billion
- 66% higher than January 2016
- 37% lower than December 2016
USD OIS Swaps
Next USD OIS Swaps volumes.
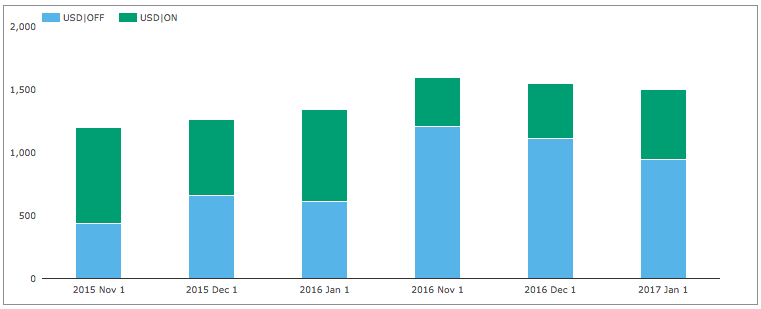
Showing:
- January 2017 volumes similar to the prior month
- 12% higher than January 2016
- Off SEF gross notional is 54% higher than Jan 2016 and On SEF 24% lower
- The increase in Off SEF and decrease in On SEF is noteworthy
- Not something we have observed for any other product
- The combined UDS OIS total in January 2017 is > $1.5 trillion
- Lower than the > $2.31 trillion of USD IRS in the month
- (recall capped trade rules mean these are understated as the full size of block trades is not disclosed)
USD IRS Prices
Lets now take a look at what happened to USD Swap rates in the month.
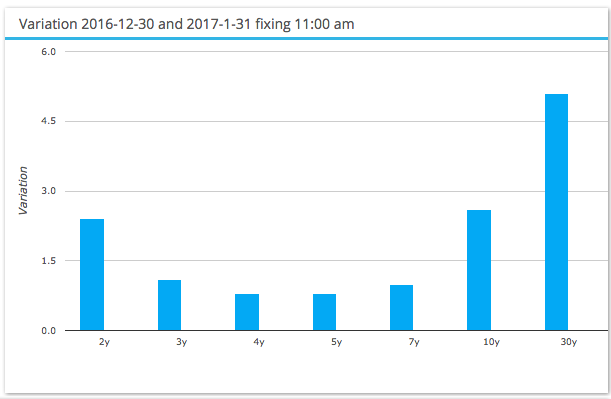
Showing that 30Y Swap rates were up 5bps in the month, 10Y +2.5bps and 2Y also +2.5bps, a relatively quiet month with rates continuing the upward trend since early November 2016.
EUR, GBP, JPY Swaps
Next On SEF volumes of IRS in the other three major currencies.
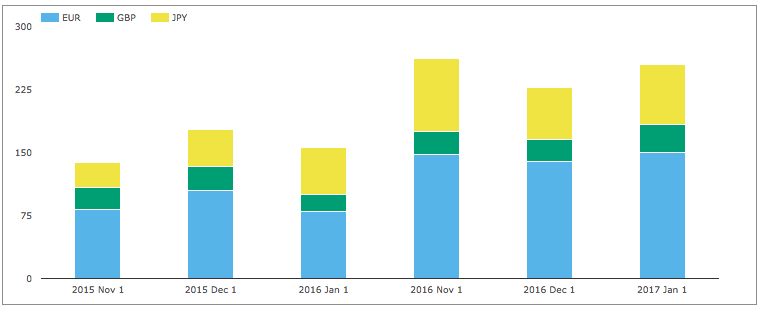
Showing:
- Volumes in January 2017 are up 64% from January 2016
- EUR up 87%, JPY up 29% and GBP up 68%
The overall gross notional in these currencies of >$255 billion is 18% of the USD IRS ON SEF volume.
Next SEF Compression activity.
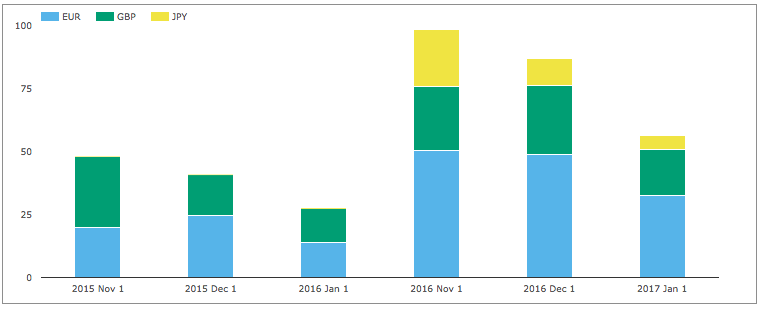
Showing that January 2017 volume was > $56 billion, down from prior months, but 100% higher than Jan 2016 and equivalent to 26% of the USD IRS Compression figure of >$220 billion.
EONIA and SONIA
Next lets check how volumes in EONIA & SONIA have performed.
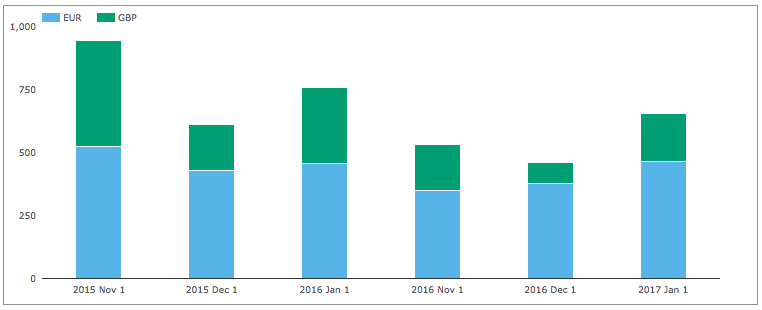
Showing overall volumes in January 2017 at >$656 billion are 13% lower than Jan 2016, but much higher than the $184 billion of EUR and GBP IRS volumes.
Compared to the $1.5 trillion of USD OIS, EONIA and SONIA volume is 44%.
SEF Market Share
Lets now turn to SEFView and SEF Market Share in IRS including Vanilla, Basis and OIS Swaps.
DV01 (in USD millions) by month for USD, EUR, GBP and by each SEF, including SEF Compression trades for the prior three months.
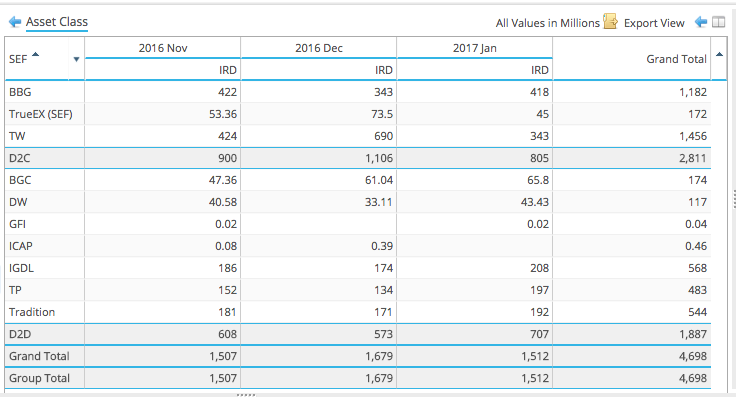
Showing that:
- January volume at $1.5 billion DV01 is lower than the $1.68 billion in Dec but similar to Nov
- Bloomberg is significantly up at $418 million DV01 to re-capture the lead
- Tradeweb is significantly down, due to lower compression volumes from the record high in Dec
- TrueEx volumes down from Dec and similar to Nov
- All the D2D SEFs are up from both Nov and Dec
- ICAP in the lead with $208 million DV01
- Closely followed by Tullet and Tradition
- Next BGC and Dealerweb
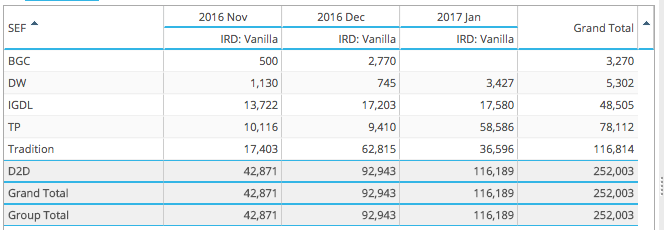
In gross notional terms $2.2 trillion of USD IRS traded On SEF in January 2017.
From SDRView data above, we know that $1.43 trillion of price forming capped gross notional and $220 billion of capped compression and roll volumes was reported for On SEF, a total of $1.65 trillion. This is $550 billion less than the $2.2 trillion reported for USD IRS by SEFs.
Put another way the SDR total figure of $1.65 trillion for USD IRS On SEF should be increased by 33% to be equivalent to the actual notional of $2.2 trillion reported by SEFs.
CCP Basis Spreads and Volumes
In SEFView we can isolate CME Cleared Swap volume at the major D2D SEFs (on the assumption that this is all CME–LCH Switch trade activity). Lets look at this for the past 3 months.
Showing:
- Overall volume in January was $116 billion, higher than the $93 billion in December
- Driven by a massive increase at Tullet from $9 billion to $59 billion!
- Tullet volume is driven by the 2Y tenor, with 3 business days > $10 billion
- Interesting to see such large volume in 2Y when the Basis for 2Y is around 0.1 bps
- Tradition down from $63billion to $37 billion
- ICAP similar to prior month at $17 billion
- Dealerweb up to $3.5 billion
A table of January volumes by SEF and Tenor is interesting.
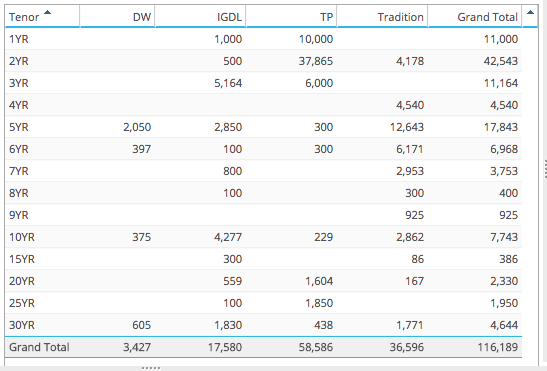
Showing:
- The tenors that traded, from 1Y to 30Y
- Tullet with $38b at 2Y by far the largest notional
- Tradition with $12.6b at 5Y the next largest
- Volume below 3Y is unusually larger than normal
- Some of the above volume will have traded as switches e.g. 5Y vs 10Y
- (but we are not able to identify that from the figures)
Converting this notional volume to a DV01 basis, we get Tradition $22m, Tullet $18m, ICAP $14m and DW 3m.
CME-LCH Basis Spreads ended the month at 3.30 bps for 10Y and 5 bps for 30Y, close to their highs.
Global Cleared Volumes
Now CCPView Global Cleared Swap Volumes of EUR, GBP, JPY & USD Swaps (IRS, OIS, Basis, ZC, VNS types).
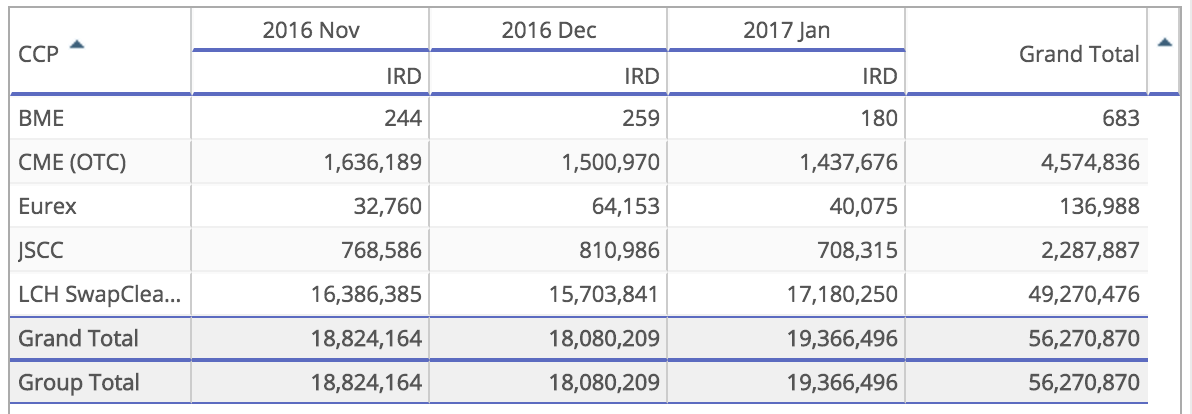
Showing:
- Overall Global Cleared Volumes in January 2017 of $19.4 trillion
- LCH SwapClear volume at $17.2 trillion, is up 9%
- CME volume at $1.4 trillion, is down 4%
- JSCC volume at $700 billion, is down 13%
- Eurex with $40 billion, down from $64 billion
- BME with $180m
Asia and LatAm
Next the volume of AUD, HKD, SGD Swaps (including Vanilla, OIS, Basis, Zero Coupon).

Showing:
- LCH SwapClear at $820 billion, similar to the prior month
- ASX at $133 billion, also similar to the prior month
- CME at $5 billion, down from $15 billion
- SGX at $7 billion, down from $6 billion
Next the volume of MXN and BRL Swaps.
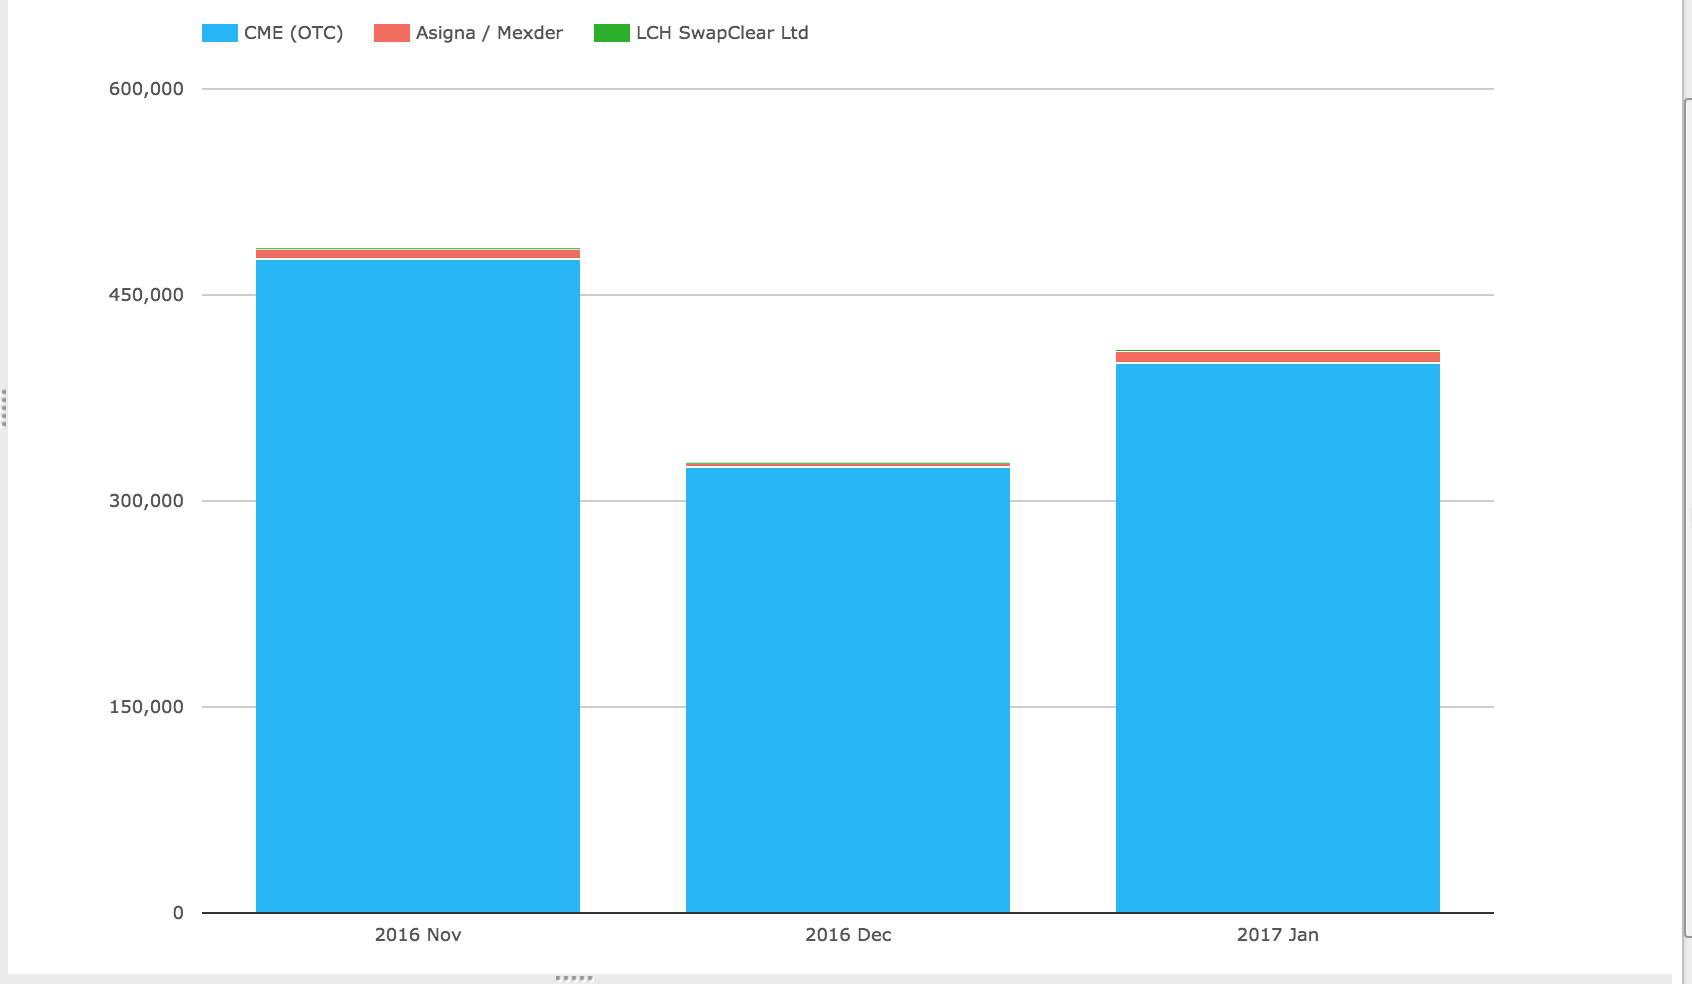
Showing:
- CME at $400 billion, up from $324 billion in the prior month
- Asigna/Mexder with $9.3 billion, up from $3.5 billion (all MXN)
- LCH SwapClear showing $124 million (all MXN)
Inflation Swaps
Finally lets look at the two products that have gained the most cleared volume from the Uncleared Margin Rules (UMR), starting with Inflation Swaps.
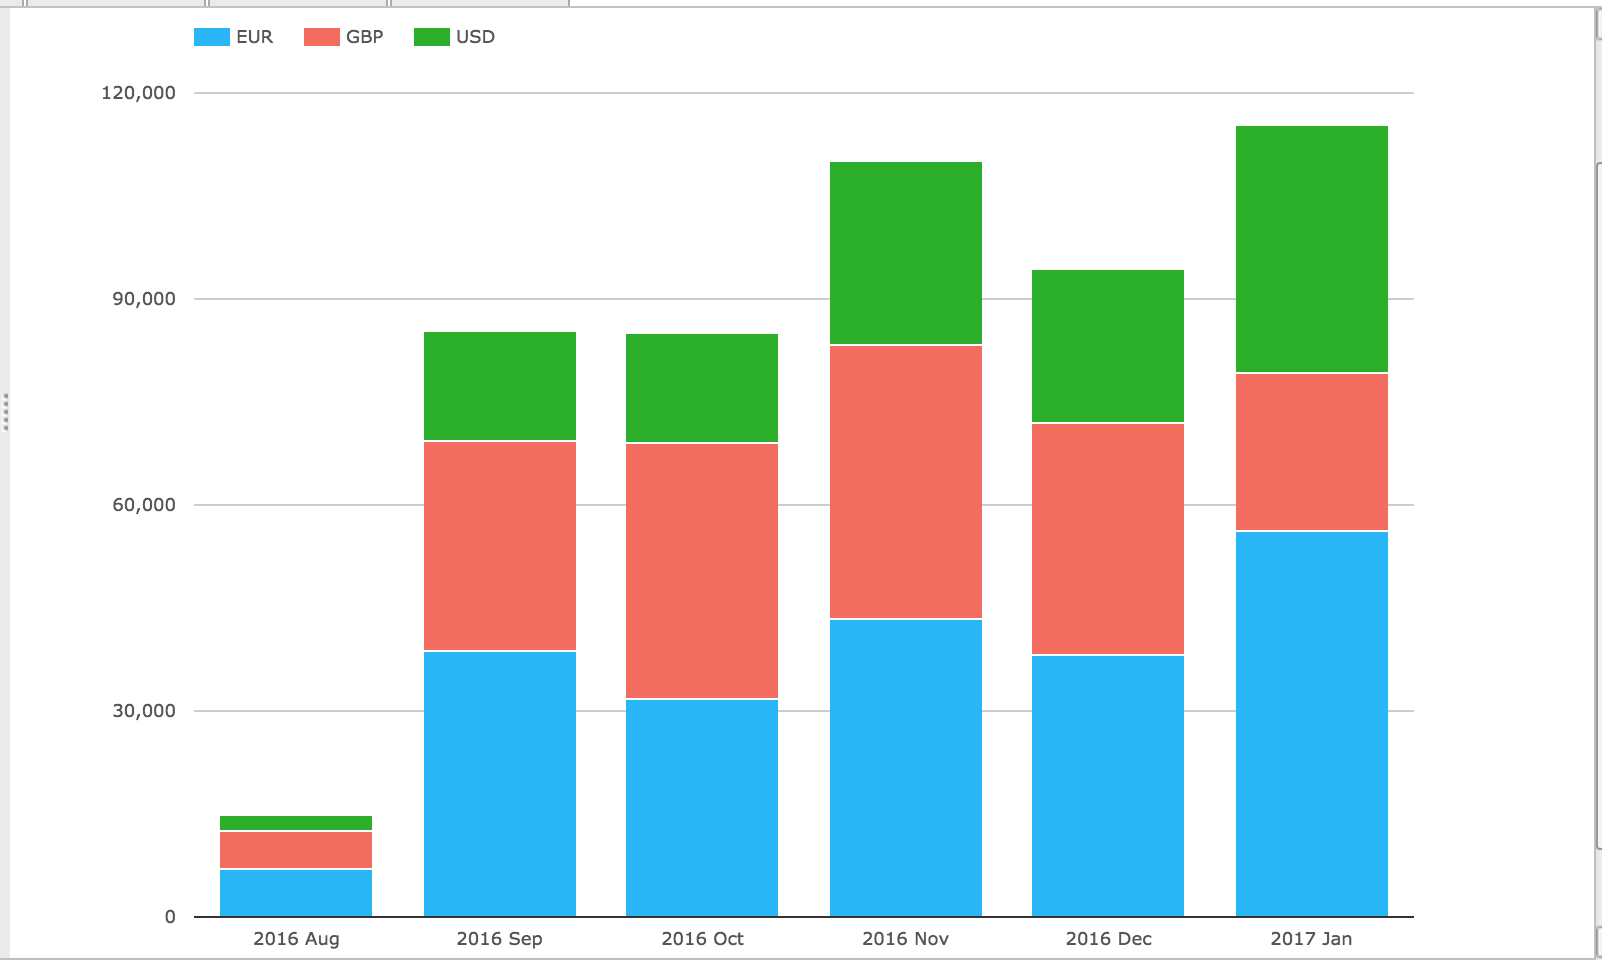
Showing:
- All the volume is at LCH SwapClear
- Total in January is $115 billion, up 22% from the prior month
- Higher than the previous record high of $110 billion in November
- And massively up from the $15 billion in August 2016 (before UMR)
- EUR is the largest currency in January at $56 billion
- USD next with $36 billion and GBP $23 billion
Non-Deliverable Forwards
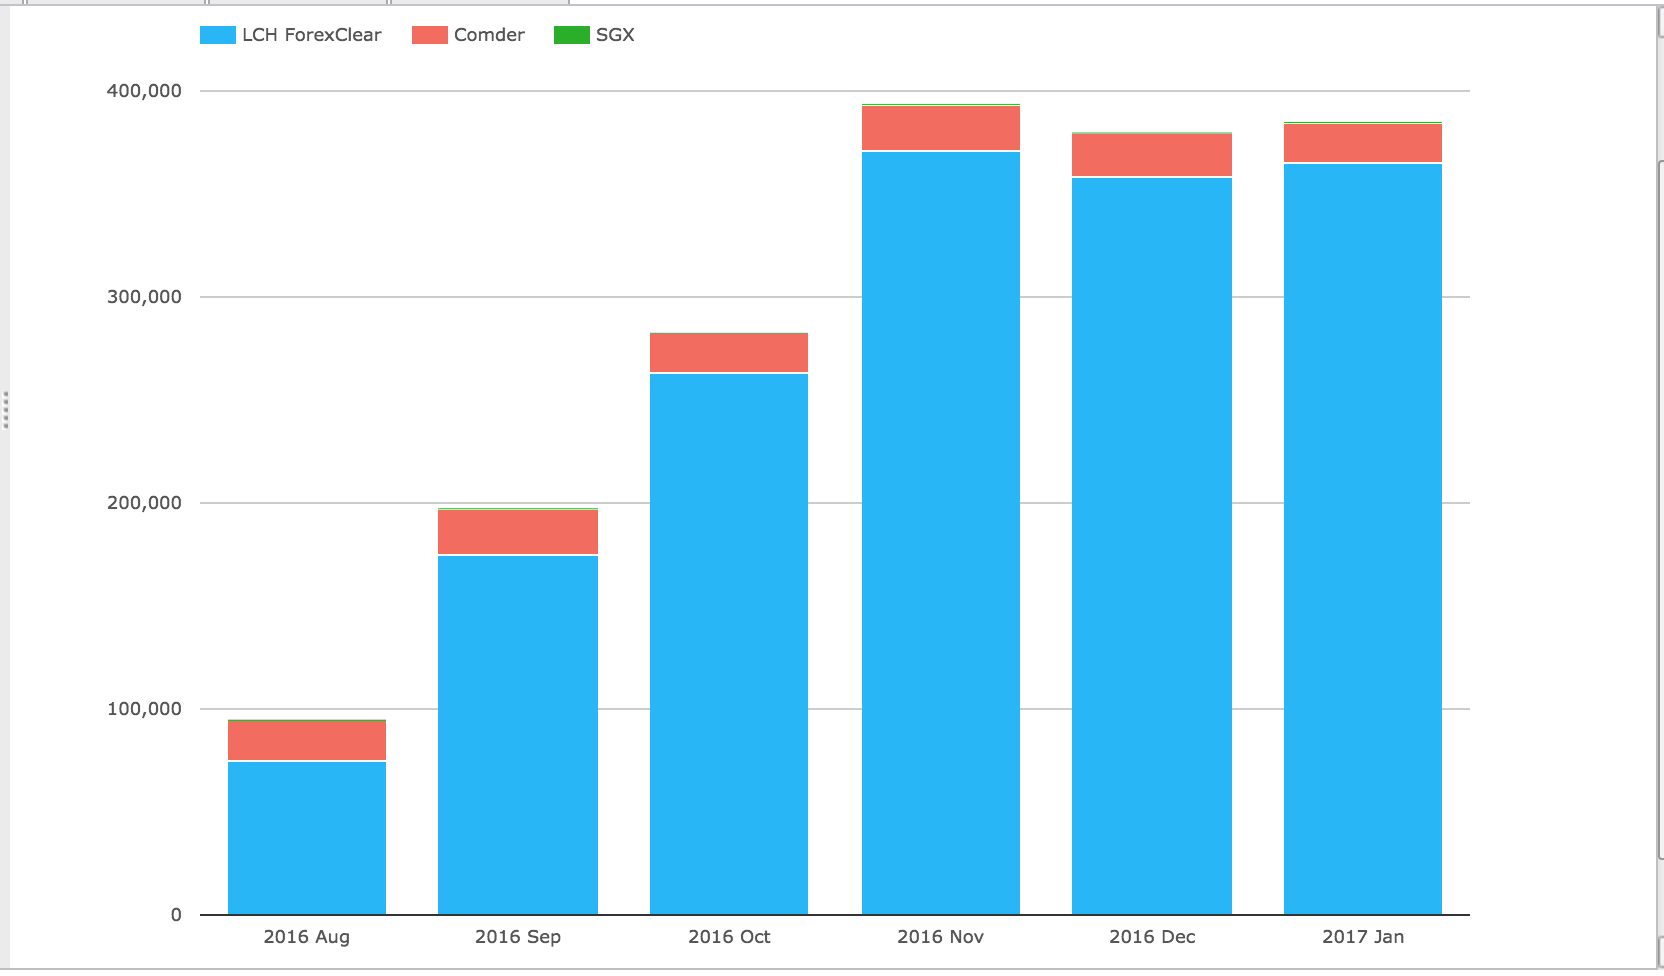
Showing:
- LCH ForexClear with the vast majority of the volume
- Growing from $75 billion in August to $370 billion in November
- Steady at this level for the most recent three months
- Comder averaging $20 billion a month
- SGX just showing (< $50 million)
That’s it for today.
Thanks for staying to the end.
Our Swaps review series is published monthly.