Continuing with our monthly review series, let’s take a look at Interest Rate Swap volumes in June 2016.
First the highlights:
- On SEF USD IRS in June 2016 volume was 34% higher than May
- USD OIS volume has increased month on month
- USD Swap Curve dropped 30 to 35 bps across the term structure
- EUR & GBP volumes were higher
- EONIA & SONIA had a big month, up 30% from June 2015
- SEF Volumes in USD, EUR, GBP are up 57% in DV01 terms
- With $2 trillion gross notional of USD IRS traded
- SEF Market Share has Tradeweb retaining the lead it gained in May
- MXN IRS shows strong growth On SEF with $130 billion
- CME–LCH Switch volumes at $45b are similar to prior month
- Global Cleared Volumes grew strongly with major ccys up
- LCH SwapClear up 50% to $22 trillion in USD, EUR, GBP, JPY Swaps
- LCH growth was driven mostly by OIS Volumes in USD, EUR, GBP up by $ 5 trillion from May
- In Asia, LCH SwapClear down from May, but above other months this year
- In LatAm, CME showing growth in MXN and its new BRL ccy
Onto the charts, data and details.
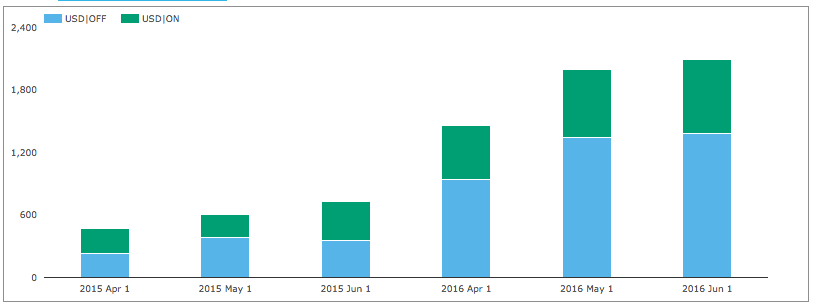
USD IRS ON/OFF SEF
Using SDRView the gross-notional volume of On and Off SEF USD IRS Fixed vs Float price forming trades (Outrights, SpreadOvers, Curve/Flys).
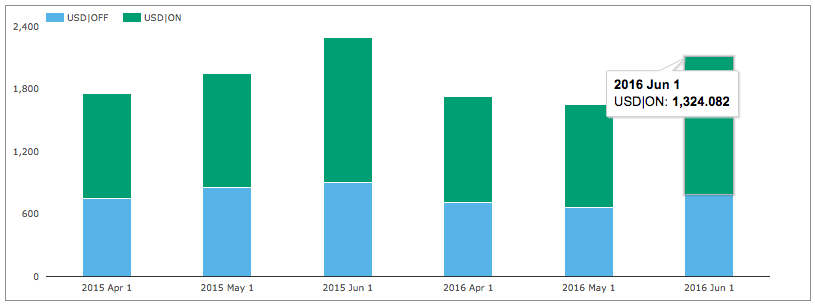
Showing:
- June 2016 On SEF gross notional is > $1,324 billion
- (recall capped trade rules mean this is understated as the full size of block trades is not disclosed)
- 34% higher than May 2016 and 5% lower than June 2015
- June 2016 Off SEF gross notional is > $785 billion
- 18% higher than May 2016 and 13% lower than June 2015
- So volumes are back up from the lows of April and May
- And On SEF vs Off SEF is 63% to 37% (one of the highest monthly ratios)
And splitting by package type and showing DV01 (adjusted for curves and flys).
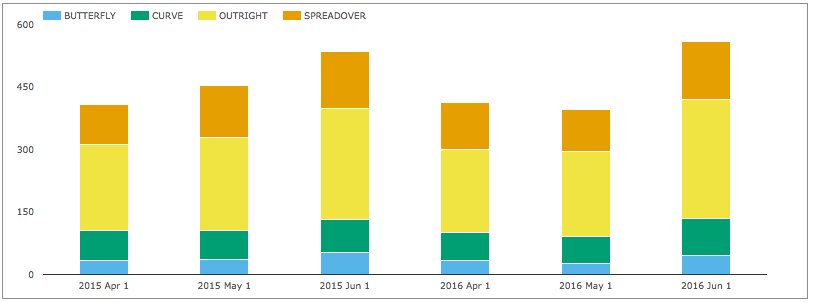
Showing:
- In DV01 terms June 2016 was 45% higher than May 2016
- Overall >$560 million of DV01 was traded in the month
- (recall capped trade rules mean this is understated)
- Compared to May 2015, DV01 is 4% higher
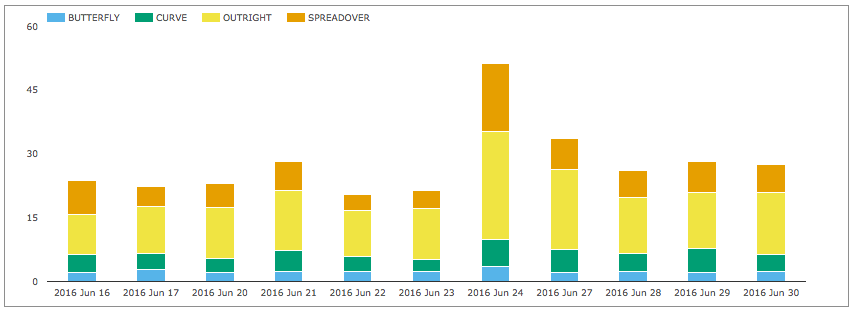
Daily volumes for the last two weeks in June show much higher volumes on June 24 (Brexit), with Spreadover volume over three times the average.
And gross notional of non-price forming trades; Compression and Rolls.
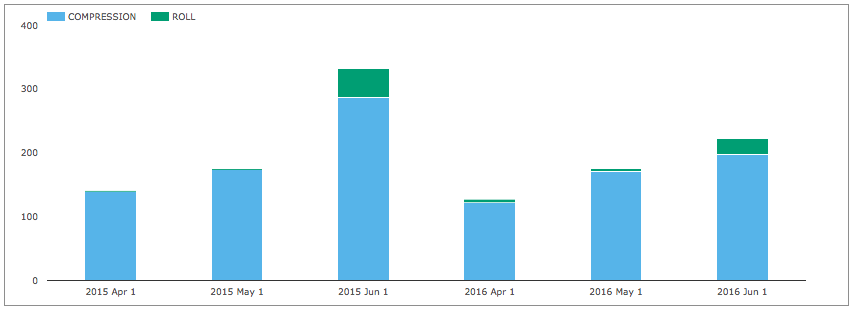
Showing:
- Higher Compression in the month with >$200 billion
- Compared to >$170 in May and >$120 in April
- But well down from June 2015
- Roll activity at >$25 billion is down from the >$45 billion in June 2015
USD OIS Swaps
The real volume story though has been in USD OIS Swaps.
Showing:
- Volumes up month on month
- Far higher than comparable months in 2015
- June 2016 Off SEF gross notional is > $1,379 billion
- June 2016 On SEF gross notional is > $ 715 billion
- (recall capped trade rules mean this is understated as the full size of block trades is not disclosed)
- The combined total at > $2 trillion is very similar to that of USD IRS
- Granted OIS Swaps are shorter maturity, so far lower in DV01 terms than IRS
USD IRS Prices
Lets now take a look at what happened to USD Swap rates in the month.
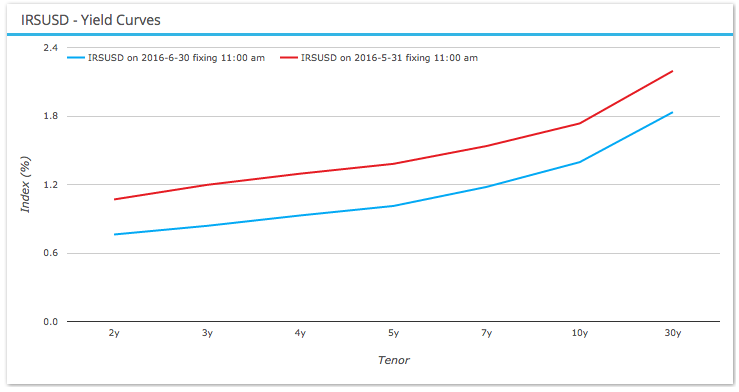
Showing:
- Red line as the Swap Curve on 31 May
- Blue line as the Swap Curve on 30 June
- Rates down 30 to 35 bps for all tenors
- With 20 bps of this coming on 24 June
- 5Y is now below 1%
- So much for Fed Rate tightening; that has been kicked into touch for now
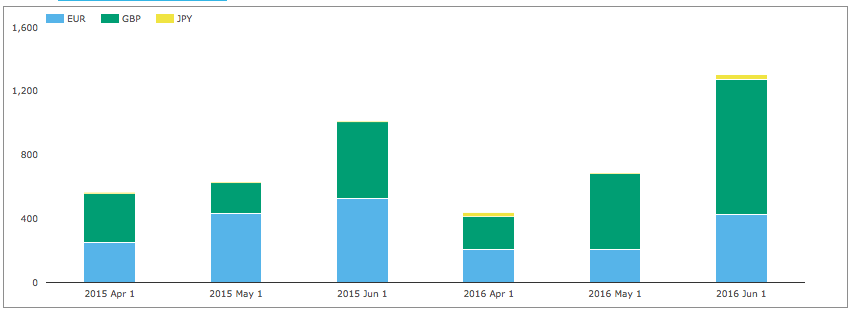
EUR, GBP, JPY Swaps
Next On SEF volumes of IRS in the other three major currencies.
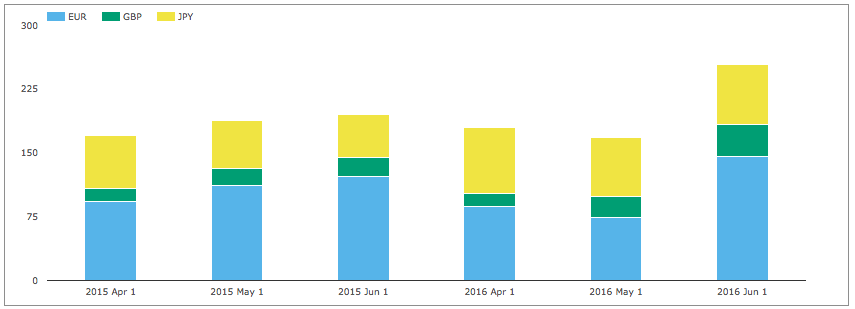
Showing:
- Higher volume compared to any month in our sample
- With EUR and GBP both significantly higher
- Volumes 50% higher compared to May 2016
The overall gross notional in these currencies of >$250 billion is 19% of the USD volume in June 2016.
And then SEF Compression activity.
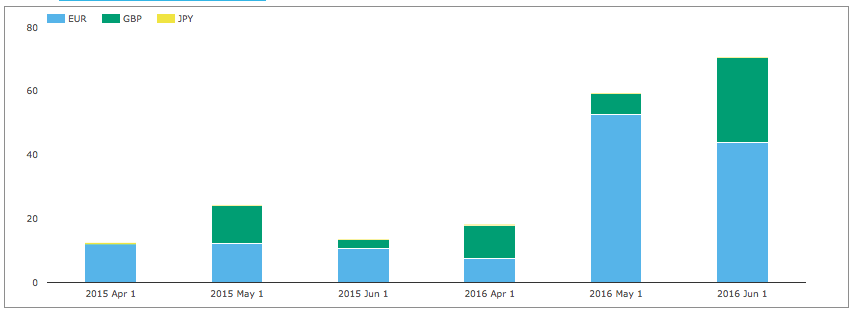
Showing record SEF compression in GBP at > $37 billion, significantly higher than an average month and EUR at > $44 billion down from May but still much higher than in the past.
EONIA and SONIA
However similar to USD, the real volume story has been in OIS, so EONIA & SONIA.
Showing:
- Volume of GBP SONIA at > $850b, up from > $480b in the prior month
- Volume of EUR EONIA at > $420b, up from > $205b in the prior month
- Compared to June 2015, volume is up 30%
SEF Market Share
Lets now turn to SEFView and SEF Market Share in IRS including Vanilla, Basis and OIS Swaps.
DV01 (in USD millions) by month for USD, EUR, GBP and by each SEF, including SEF Compression trades and use a chart to compare the relative share in June 2016 with the prior three months.
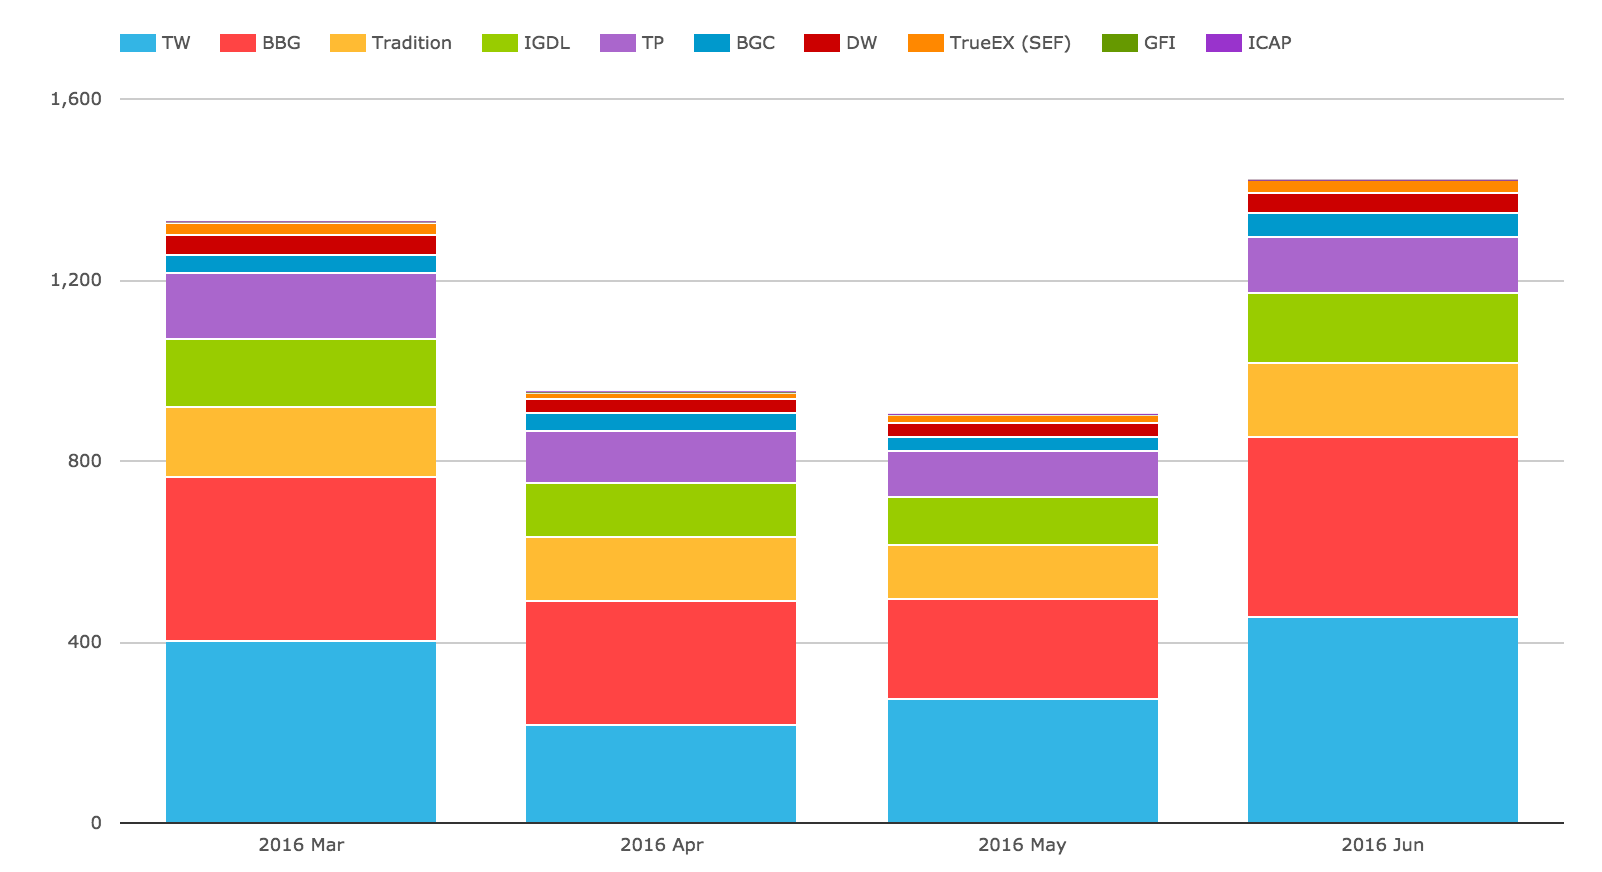
Showing that:
- June volume is much higher then prior months with $1.4m of DV01
- Up 57% from May volume
- Tradeweb retains its top spot (gained in May) with 32%
- Bloomberg is next highest with 28%
- Tradition 12%, ICAP 11%, Tullet 9% are each similar to the prior month
- BGC 3.5%, Dealerweb 3.2%, TrueEx 2% are also as in the prior month
In gross notional terms nearly $2 trillion of USD IRS traded On SEF in June.
From SDRView data above, we know that $1.3 trillion of capped gross notional was reported, making the understatement $700 billion and meaning that there were a lot of trades above block or cap size in the month.
Lets now take a look at MXN IRS volumes.

Showing:
- Strong growth in May and June with $130 billion each month
- So 6.5% of the USD IRS gross notional
- ICAP and BGC dominate with 30% and 25% in June
- Latam SEF makes a strong showing with 7% over the 4 months
CCP Basis Spreads and Volumes
In SEFView we can isolate CME Cleared Swap volume at the major D2D SEFs (on the assumption that this is all CME-LCH Switch trade activity). Lets look at this for the past 4 months.
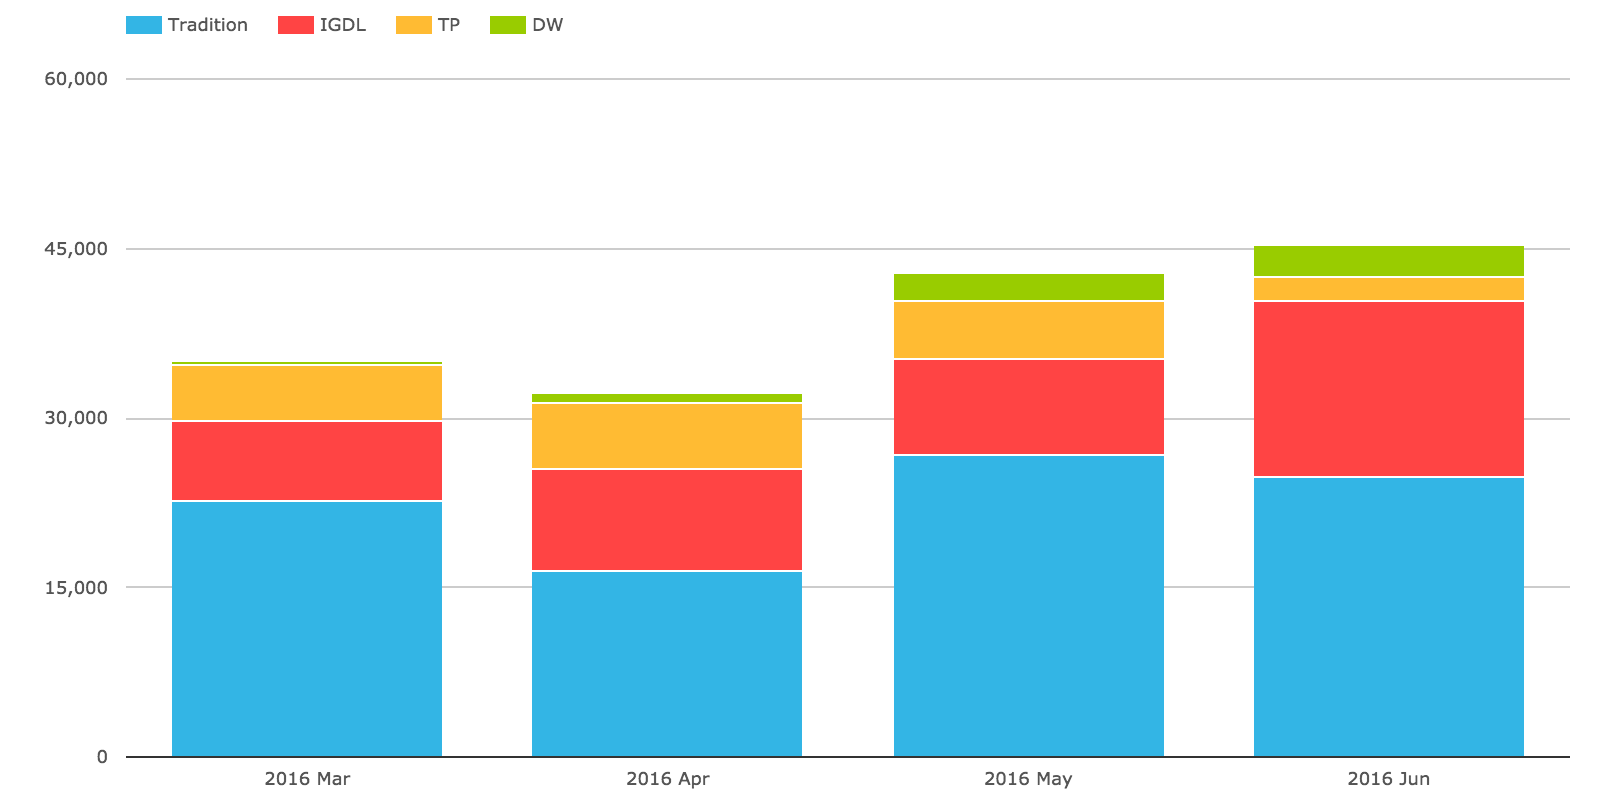
Showing:
- Overall volume in June was $45 billion gross notional
- Similar to May and up from March and April
- Tradition has the largest share in the month with 55%
- ICAP is next with 34%
- Dealerweb with 6% and Tullet 5%
CME-LCH Basis Spreads remained at similar levels with 10Y at 2.35 bps and 30Y at 3.25 bps.
Global Cleared Volumes
Now onto CCPView to look at Global Cleared Swap Volumes for EUR, GBP, JPY & USD Swaps.
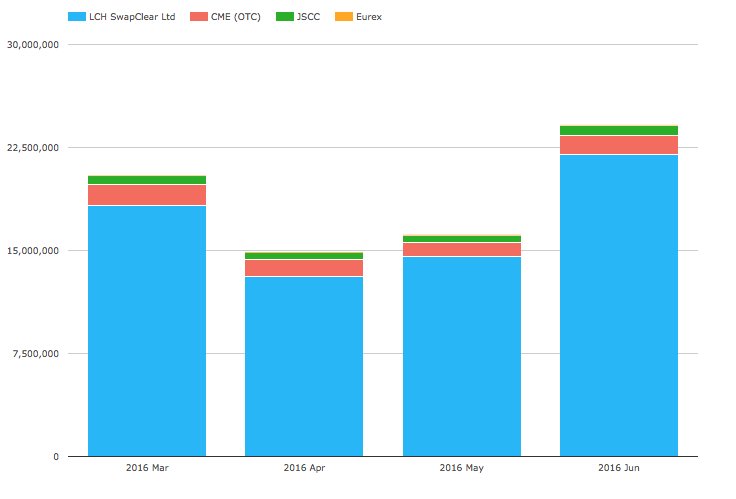
Showing:
- Overall Global Cleared Volumes at much higher levels
- (Just as we have seen in US SDR and US SEF data)
- LCH SwapClear volume at $22 trillion up from $14.5 trillion in May
- And higher than its March high of $18 trillion
- Which at 91% share is it’s highest in this period
- CME at $1.3 trillion, is up from its May $1.05 trillion
- JSCC at $758 billion, is up from its May $500 billion
- Eurex with $50 billion is down from its May $70 billion
Lets look in more detail at the LCH SwapClear growth.
First by each of our four major currencies.
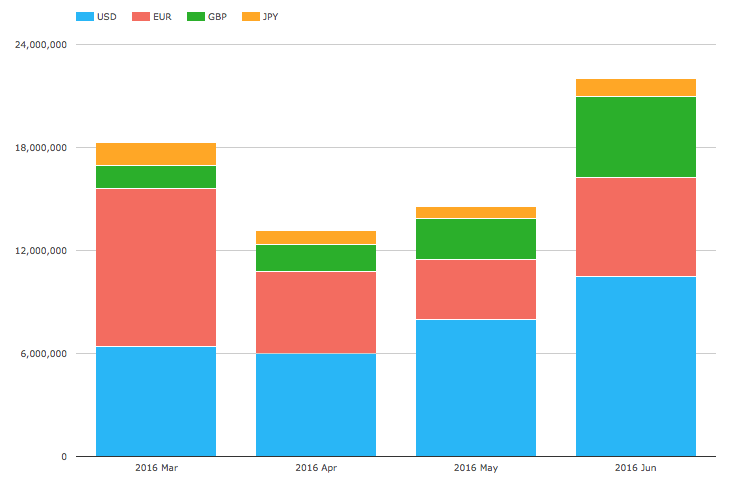
Showing:
- Large increases in USD, EUR and GBP in June
- GBP volume of $4.7 trillion, much higher than the $2.4 trillion in May
- EUR volume of $5.7 trillion, higher than the $3.5 trillion in May, but lower than March
- USD volume of $10.5 trillion, much higher than the $8 trillion in May
- JPY volume of $1 trillion, also higher than the $660 billion in May
Meaning that $7.5 trillion increase from May is split by GBP:EUR:USD:JPY as 2.3 : 2.2 : 2.5 : 0.4, so evenly over the first three currencies in our list.
And next LCH SwapClear growth by product type.

Showing:
- Large increases in OIS and IRS
- OIS volume of $13 trillion, much higher than the $8 trillion in May
- And the highest on record
- IRS volume of $8.2 trillion, higher than the $6 trillion in May
- And higher than the Feb high of $7.8 trillion
Meaning that $7.5 trillion increase from May is explained primarily by OIS volumes increasing (in each of USD, EUR, GBP) and secondly by IRS volumes in the ratio 5 to 2.2.
Asia and LatAm
Before we end lets look at some charts for Asian and LatAm currencies.
First the volume of AUD, HKD, SGD Swaps (including Vanilla, OIS, Basis, Zero Coupon).
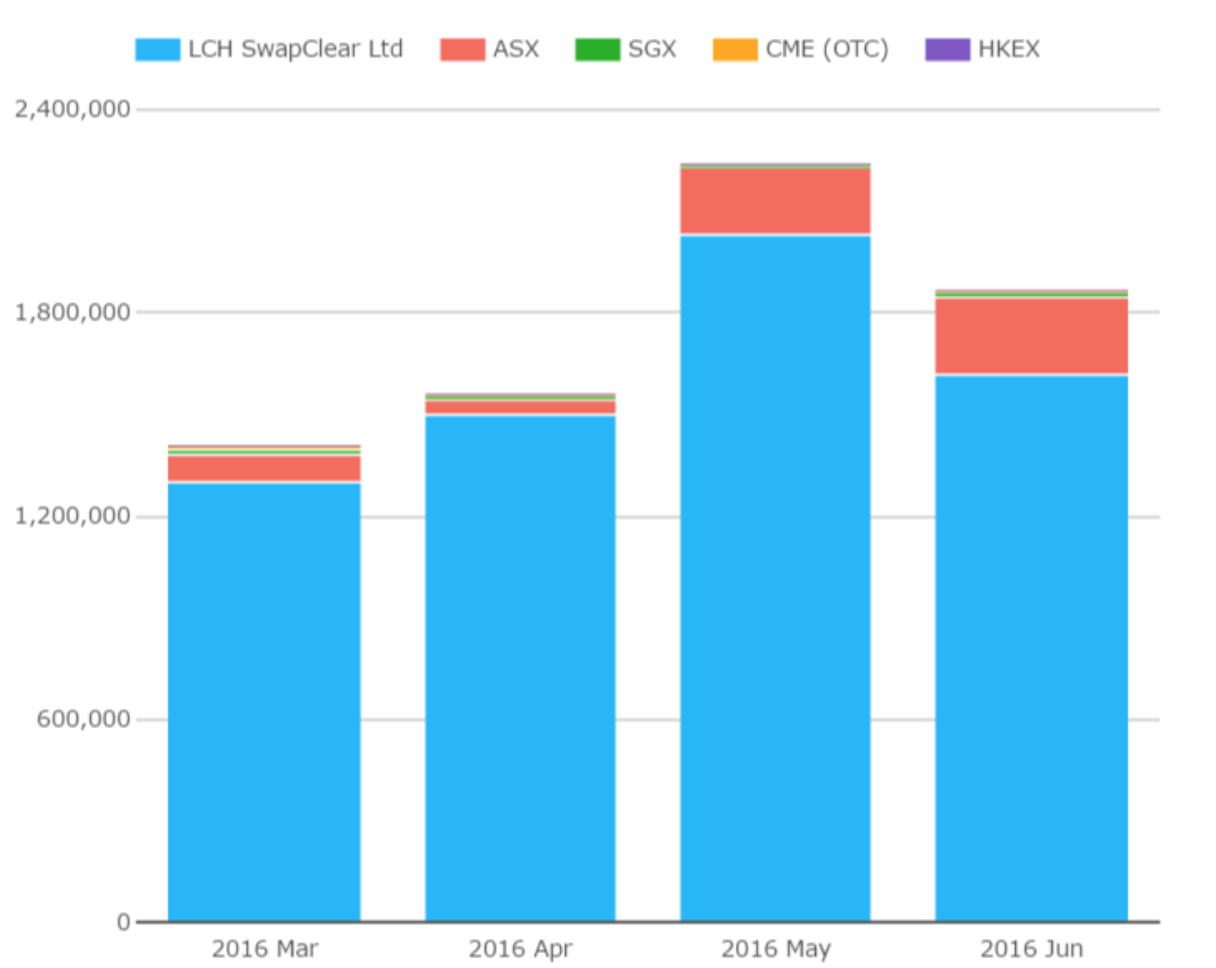
Showing:
- LCH SwapClear down to $1.6 trillion from the high of $2 trillion in May
- ASX at $234 billion, up from $195 billion in May
- SGX at $11 billion is up from $7 billion in May
- CME at $8 billion is up from $5 billion in May
Second the volume of MXN and BRL Swaps.
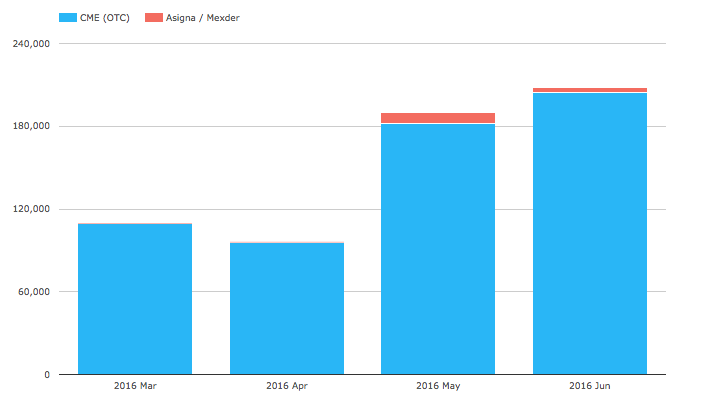
Showing:
- CME with $200 billion in June, up from May $180b and Apr $100b
- CME $200 billion in June is MXN $168b and BRL $36b
- June being the first month that CME launched BRL clearing
- Asigna / Mexder also showing in May and June with $8.5b and $3.5b respectively
That’s it for today.
Thanks for staying to the end.
Our Swaps review series is published monthly.