- Libor-OIS spreads have collapsed since we last wrote about them in March.
- 1 year Libor-OIS spreads in USD have retreated to under 30 basis points.
- Notional traded has continued to be higher than in 2017.
- Cross currency basis has also moved tighter.
- We also take a quick look at OIS future volumes.
Libor OIS
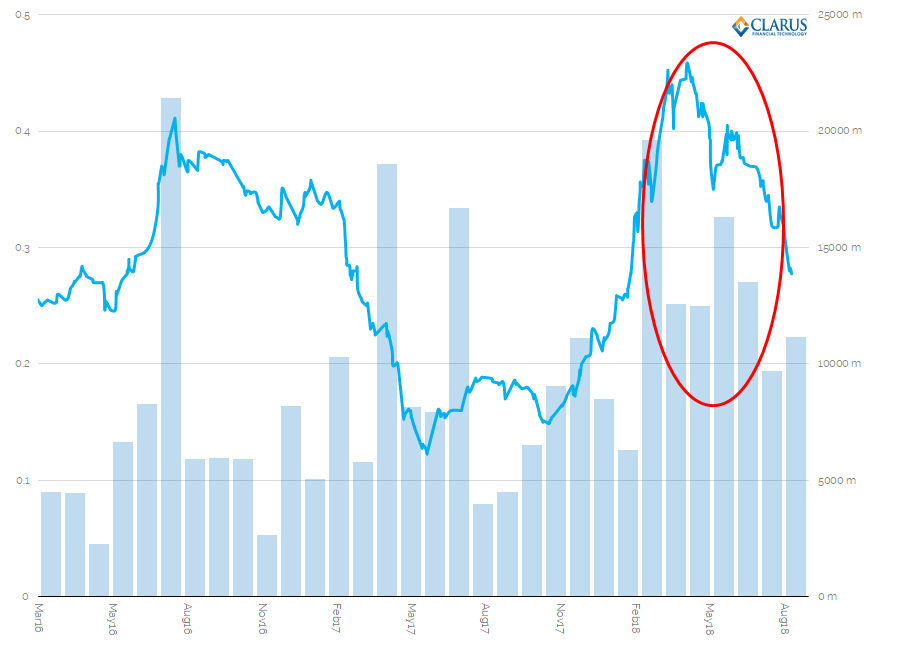
Our Libor-OIS blogs this year have been very popular. Therefore, let’s check what the USD 1 year Libor-OIS spread has done since our last update in March 2018:
In March 2018, we wrote;
Smaller volumes transacted at a recent “top” may suggest that the move wider has now been exhausted.
- I wrote that statement a little bit early. At the time, the spread had contracted to nearly 40bp, but had been volatile in a 40-43 basis point range.
- The spread went on to trade at nearly 46 basis points (very briefly and in low volumes). This marked the high.
- However, since then, the spread has really collapsed, back to the levels from the beginning of February 2018.
- It last traded at 27.75bp, which is 6 basis points lower than where we started the month of August. The pace of tightening is almost matching the pace of the “blow-out” we saw in January and February!
- Volumes were large again in May 2018, and have certainly been running at levels higher than 2017 all year.
Overall, I think it’s fair to say that looking at the volume data has helped to track and make sense of the price trends this year. It served as a leading indicator to the peak.
Cross Currency Basis
And what about those Cross Currency basis spreads? Have they been moving in tandem with their Libor-OIS brethren? As we wrote last time….not really:
Showing;
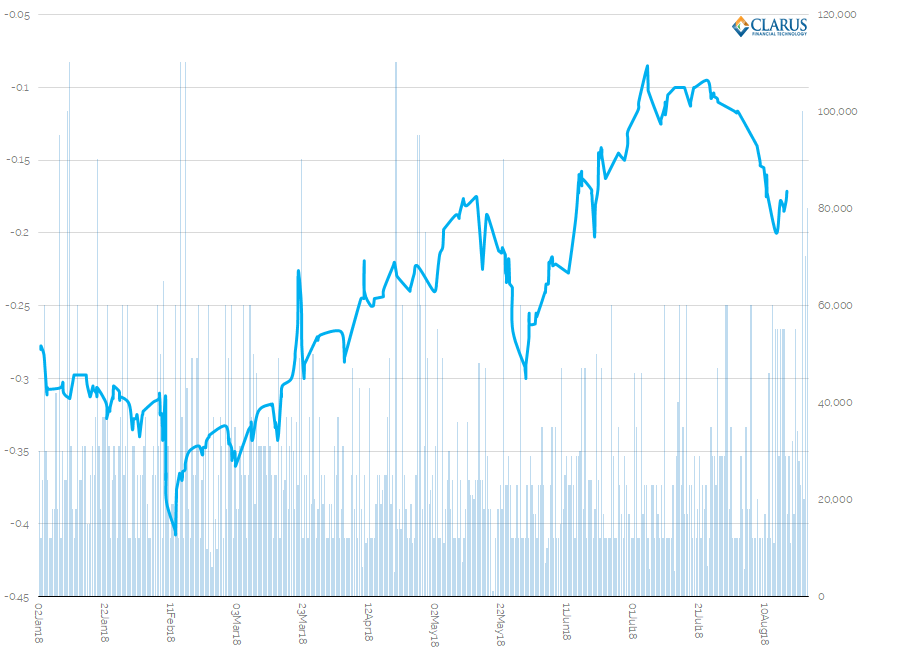
- 1 year EUR-USD cross currency basis during 2018 – both volumes (bars) and price (line).
- The spread moved higher (i.e. tighter) until July, and looked to be headed towards positive territory.
- However, despite a tightening in USD Libor-OIS (which would normally help EURUSD xccy basis move higher, towards zero) it has since retreated.
- The one year spread reached a high of -8.5 basis points on 5th July this year.
- It has since retreated to -20 basis points, and last traded around -17.
- Volumes have generally been muted in July and August for the one year spread (around $1m DV01 per month trading). June, however, saw the largest volumes since February, with $1.8m DV01 reported to US SDRs.
- It will be interesting to see in September, when the issuance window re-opens, whether the march back towards positive levels can re-start.
OIS Futures
Finally, it is worth noting that we are looking at two products that may well be over the hill in the above analysis. Specifically;
- The one year Libor-OIS spread is looking at a swap versus Fed Funds. As we know, SOFR swaps are now trading, therefore SOFR may replace Fed Funds as the index of choice for these basis swaps.
- The one year cross currency basis spread is USD Libor vs EUR Euribor. It is possible that neither of these indices will exist after 2021!
Let’s take this opportunity to look at how OIS Futures markets are progressing. Recall that;
- CME have recently launched SOFR futures. Total trading has surpassed 150,000 contracts since launch. Open Interest peaked at 23,000 contracts in July.
- CurveGlobal have offered 3 month SONIA futures since April this year. Total trading has surpassed 190,000 contracts since launch.
- ICE have just entered (or re-entered?) the fray via a new 3 month SONIA future, launched in June 2018. This adds to their existing one month SONIA contract. According to this press release, the launch has gone well.
First for SOFR futures. How does Open Interest compare to Eurodollars and Fed Funds?

Showing;
- Open Interest, in USD notional equivalent, of Eurodollars (blue, vs Libor), Fed Funds (red) and SOFR (green) since the June IMM roll.
- Eurodollars continue to be the largest futures contract in Rates space, although Fed Funds do give it a run for its’ money. Just bear in mind that most Fed Funds contracts are only 1 month in maturity, so this is a bit of a skewed chart.
- Importantly, we can see that the sliver of green “SOFR” Open Interest has clearly grown. Keep an eye on this blog for more updates on SOFR.
In GBP futures, we can see that SONIA linked contracts now account for 2.5% of Open Interest vs Short Sterling. Impressive stuff!
We’ll look at this in more detail in a future blog as we continue to watch the race for SONIA volumes unfold between CurveGlobal and ICE. The contracts are of different sizes, so there are many metrics to study. We’ll just note that CurveGlobal offer a 3 month contract, with a 4:1 share vs ICE, whilst ICE have also highlighted in their press release their volumes since launch.
Both exchanges have seen a substantial increase in Open Interest in the past six weeks, so we’ll be monitoring this trend closely.
UPDATE: Hold on, now CME are also launching SONIA futures! Look out for a blog on the different contract offerings soon.
In Summary
- Libor-OIS spreads have now tightened, although traded volumes continue to be higher than last year.
- Cross Currency basis has also moved tighter.
- With a backdrop of good volumes in OTC derivatives, it should be a good time to launch futures contracts in OIS.
- We see both SOFR and SONIA contracts gaining traction in futures markets.