- Libor-OIS spreads have recently started to retreat from the wides hit in the middle of March.
- 1 year Libor-OIS spreads in USD reached as high as 45.25 basis points.
- They have since traded as low as 40.25bp.
- Notional volumes across all indices in March hit all time highs, 3 times the levels seen in 2017.
- However, the amount of risk being traded has reduced by 25% since February.
Updated LIBOR OIS Spreads
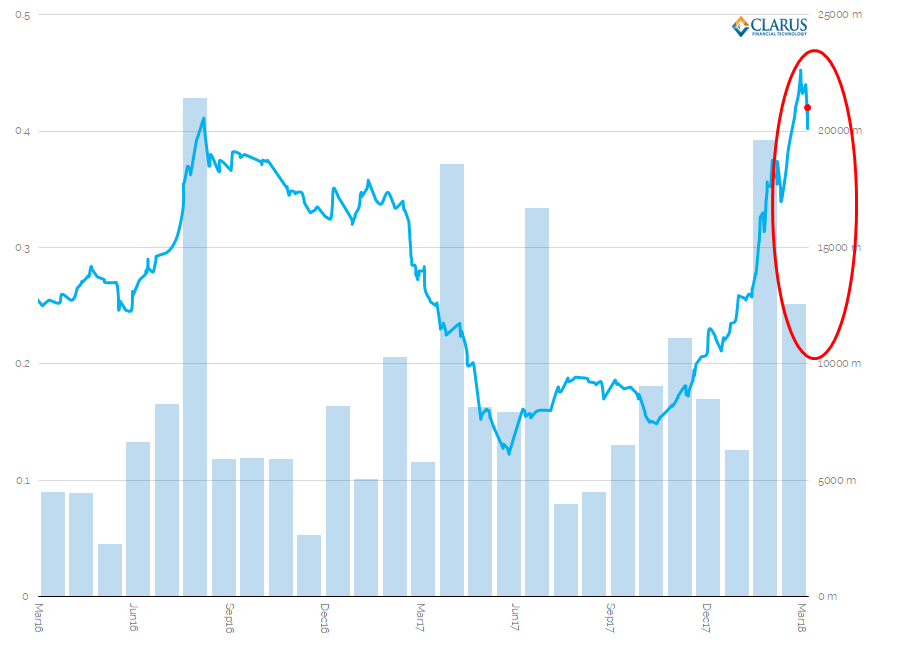
Our previous blog on Libor-OIS was very popular. Therefore, let’s check out what the USD 1 year Libor-OIS spread did during March 2018:
Showing that;
- Last month, we traded above the previous 2016 peak in 1 year Libor-OIS spreads. Recall that in 2016 we had worries about money market fund reform causing the “blow-out”.
- The 1 year Libor-OIS spread (Bloomberg ticker USBG1) traded at a high of 45.25 basis points (according to SDR transaction data) on 21st March.
- Incidentally, that was the day after our blog was published. Let’s put that down to coincidence rather than “if taxi drivers are talking about it, it must be the top” counter-signal!
- Since then, the spread has been volatile, trading in a 40-43 basis point range into the end of the month.
- But look at the volumes in March….they were 35% lower than February. However, other USD LIBOR basis saw a lot of trading (see below).
- Okay, volumes were still double what we saw in January 2018 (when the widening was already happening), but still substantially below previous high volume periods.
- Overall, for the 1 year spread, these smaller volumes transacted at a recent “top” may suggest that the move wider has now been exhausted.
In light of which, we’ll make sure to update in April to keep an eye on volumes.
Other Currencies
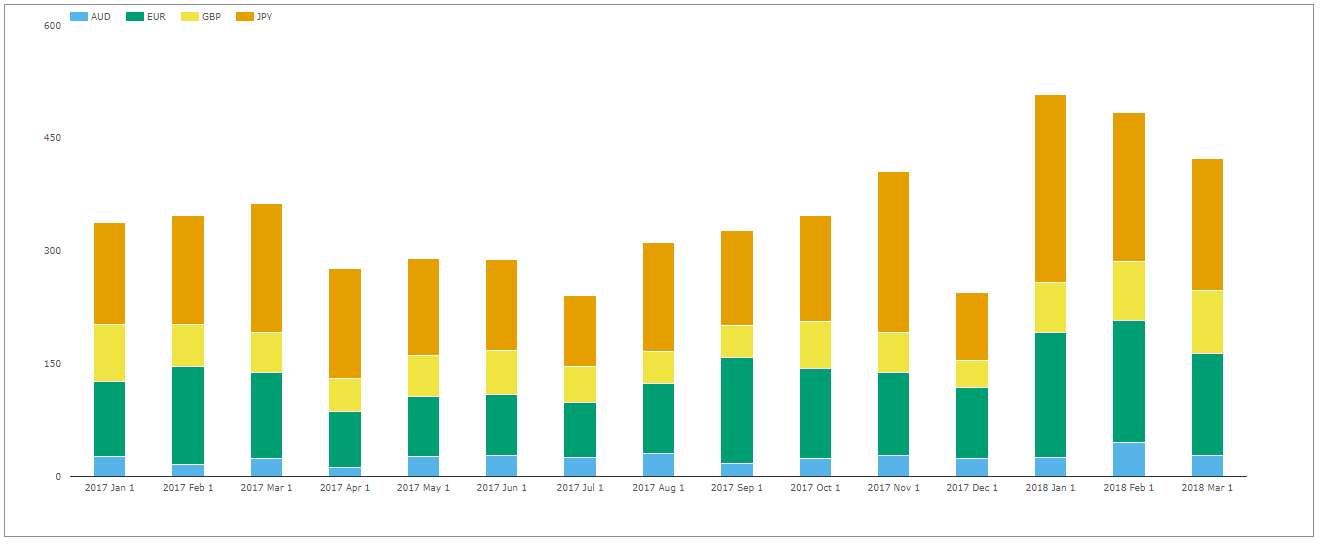
Our data doesn’t just cover USD volumes. But take a look at the difference in volumes reported to SDRs in USD basis swaps, when compared to the other major currencies:

Showing;
- Notional volumes are over 3 times higher than last year and are at all time highs.
- Over 95% of basis volumes in any given month can be down to USD-denominated trading.
- The increase in volumes is due to USD trading.
- This is down to two factors – one is a reporting bias from the trading counterparties captured in SDR data (i.e. US persons). The second is that the USD basis market is not just limited to Libor-OIS, but covers 3s1s (1m Libor vs 3m Libor) and other indices such as Muni’s. These all trade as a single swap for USD markets, where-as in Europe it can still be possible to trade e.g. 3s6s (3m Euribor vs 6m Euribor) as two outright swaps. Which isn’t great from a leverage ratio perspective, but does still happen…
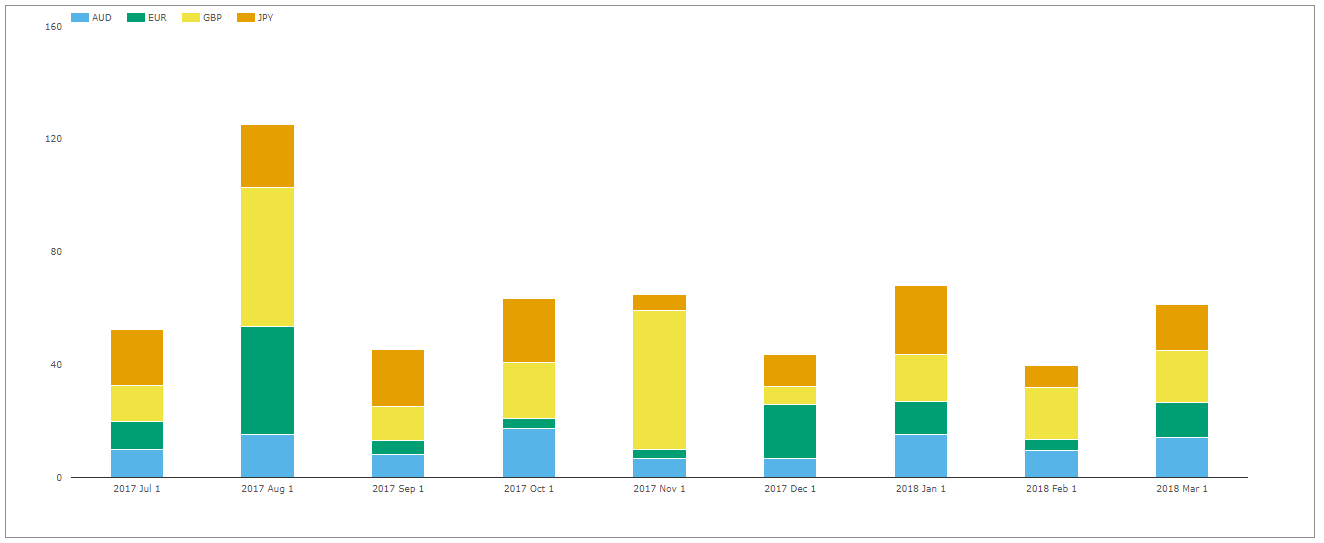
If we therefore take USD out of the above chart, we see the following:
Showing;
- We are not seeing any spikes in basis trading volumes outside of USD.
What about Cross Currency basis?
Showing;
- Volumes have been huge this year – as we reported in “All time record volumes in Cross Currency Swaps“.
- I’ll update that old blog in due course – but last time, it looked to be driven by short-end volumes.
- These short-end volumes could well have seen a spike due to Libor-OIS related spreads. We will look into it in more detail next week.
The Whole Curve
Given the evidence so far suggests that this is overwhelmingly a USD story, let’s expand our analysis to look at the whole USD Libor-OIS curve.
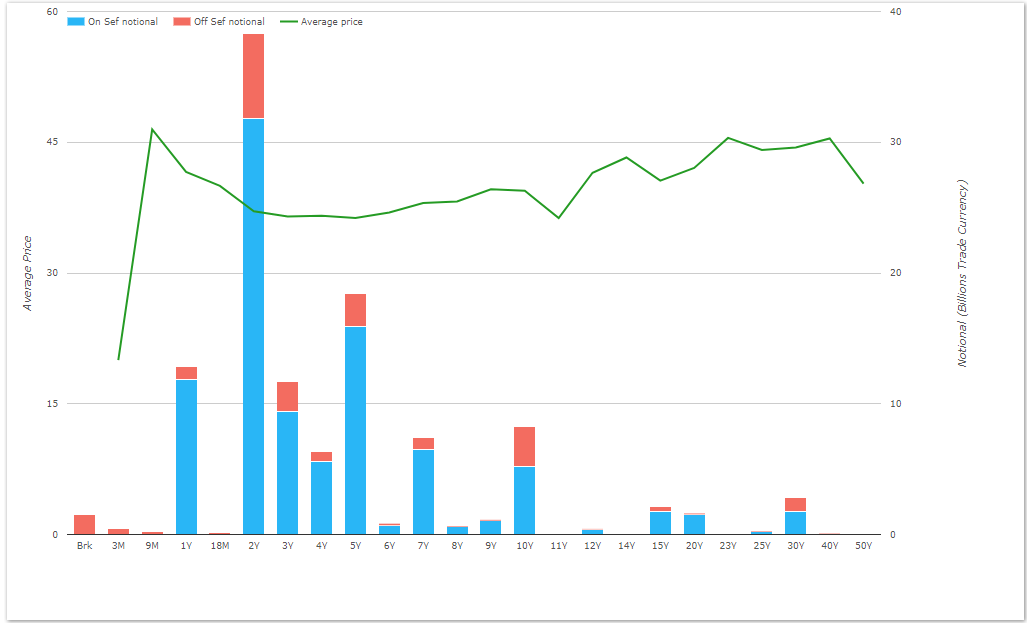
SDRView Pro gives a great overview of Basis trading in a single chart:
Showing;
- All spot-starting USD basis vs OIS reported to US SDRs for the past month.
- We can see that 2 years has been a hugely popular tenor to trade. 5 year volumes equally impressive (remember these are notionals).
- The price line gives us some idea of the term structure of the basis curve. Much is driven by the “front-roll” (the first three-month period).
Given there is so much trading outside of the 1 year, I also wanted to show a chart that encapsulates activity across the whole curve. I therefore used our microservices to calculate the DV01 of all Libor-OIS basis trades transacted since 2016:
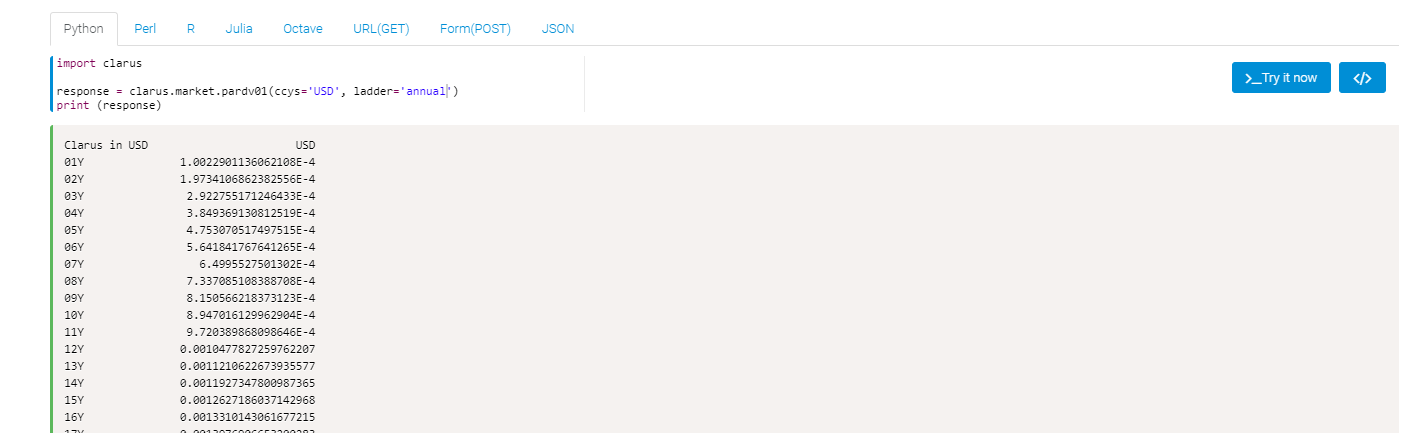 Using this simple lookup table, allows me to calculate the average basis transacted across the curve each day. This gives us some idea if basis is widening across the whole curve (subject to similar tenors trading each day of course).
The daily activity is shown below:
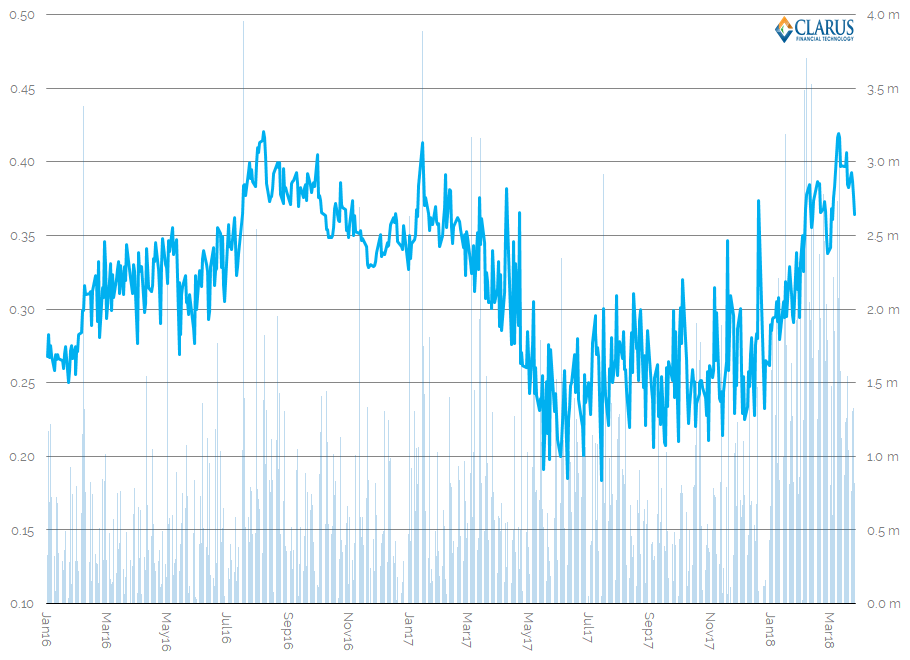
Showing;
- I calculate the DV01 of each trade, multiply this by the price of the basis, and calculate the volume weighted average “basis price” each day to create the price series.
- We also show the daily volume of basis traded in a “USBG” Bloomberg ticker – i.e. spot starting Libor-OIS basis swaps.
- The peaks in the volume weighted basis are uncanny – topping out at the same levels in 2016, 2017 and now 2018.
- However, daily volumes have clearly been higher in this latest run up. Maybe because the move higher has been going on for so much longer?
A Final Volume Chart
So far, we’ve looked at notional volumes for 1 year, overall notional volumes (which reached a record in March 2018, driven by USD) and looked at overall DV01 volumes on a daily basis.
Finally – here are the total monthly DV01 volumes for spot-starting USD Libor-OIS basis traded in the past two years:
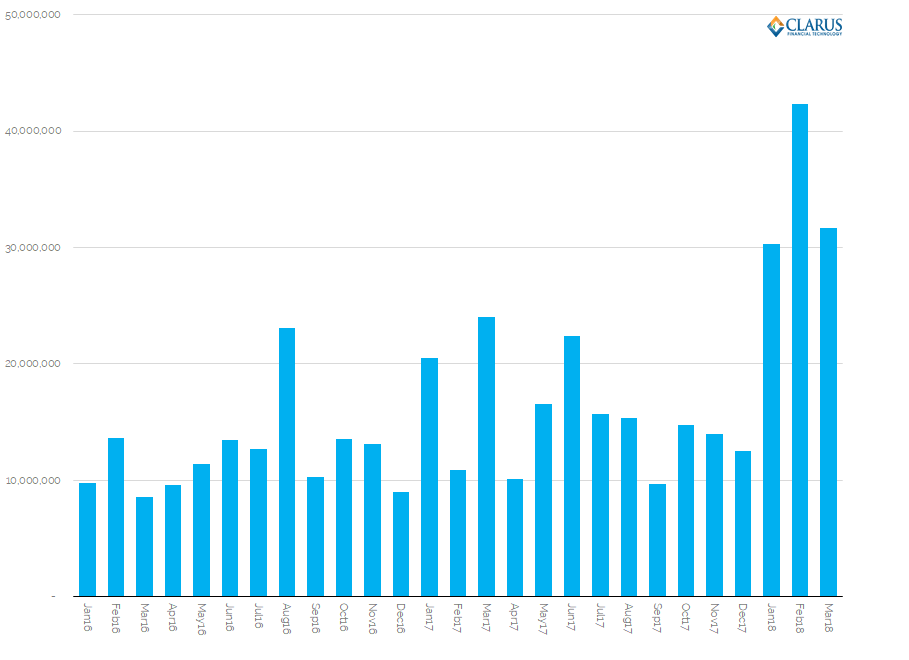
Showing;
- Across the whole curve, DV01 volumes have been huge in 2018 compared to any other point in time.
- Consistent with the story we see for the 1 year spread alone, these volumes were unusually high in February 2018.
- Volumes in March were 25% lower than these peaks reached in February.
- However, March volumes were still double the average monthly volume that we saw in 2017.
Overall, notional volumes in USD basis are very high, but the amount of risk (i.e. DV01) being traded has reduced in the past month. This indicates more short-end trading.
In Summary
- One year USD Libor-OIS spreads hit a wide of 45.25bp in March 2018, but on much lower volumes than last month.
- Notional volumes in USD basis across the whole curve (and across all indices) hit all time highs in March 2018.
- However, the amount of risk, as measured on a DV01 basis, was down by 25% last month.
- Due to a lower amount of overall risk having traded, this might suggest the move wider is close to exhausted.