We get asked often about the most recent MAC swap activity. So lets look at some data.
DATA
We are assisted by the Clarus SDRView Researcher service, which enriches all the swap data to mark-up the subtypes (eg MAC, IMM, Spot start, etc) and packages (curve, butterfly, compression, etc). Below is a snapshot of the most recent weeks data across all package types:
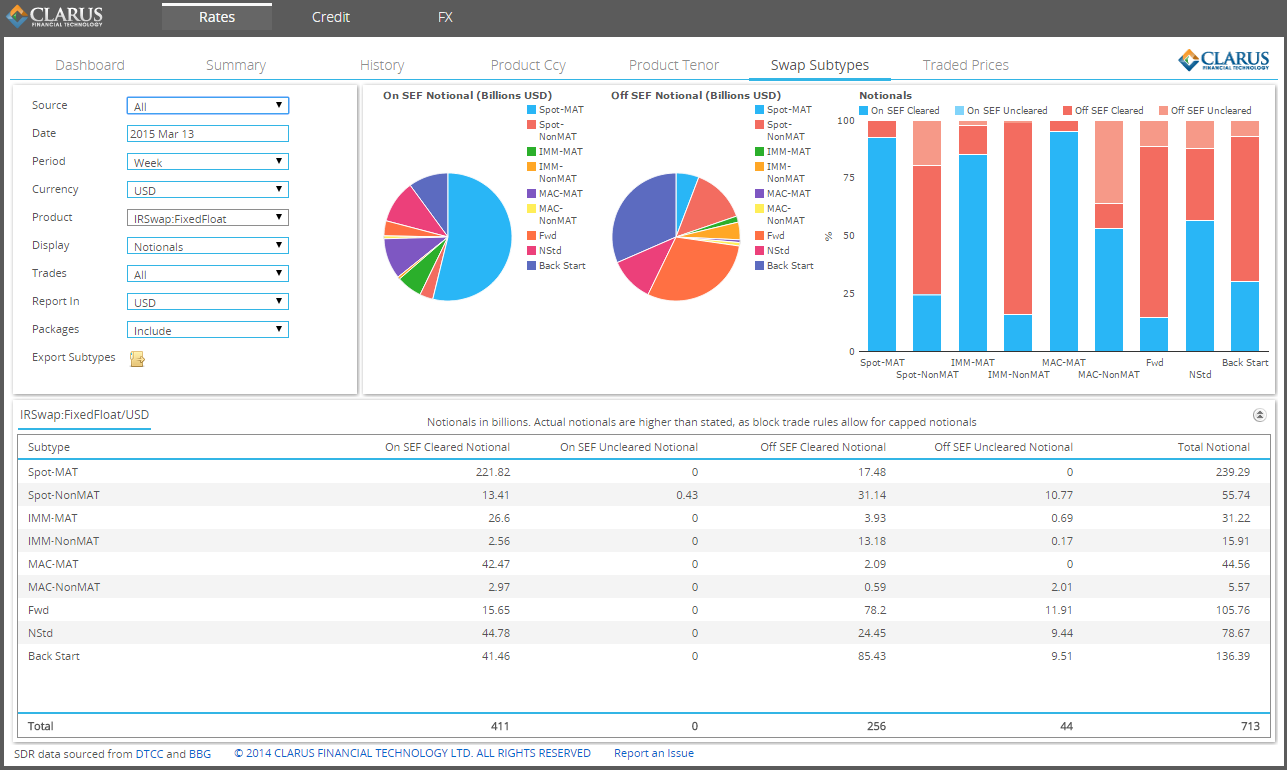
This nicely categorizes all of the USD swap activity last week in notional terms. And we can also retrieve this in trade count and DV01 terms.
I’ve exported and plotted the weekly data back to January 2014, and focused in on MAC swaps in terms of notional and trade counts:
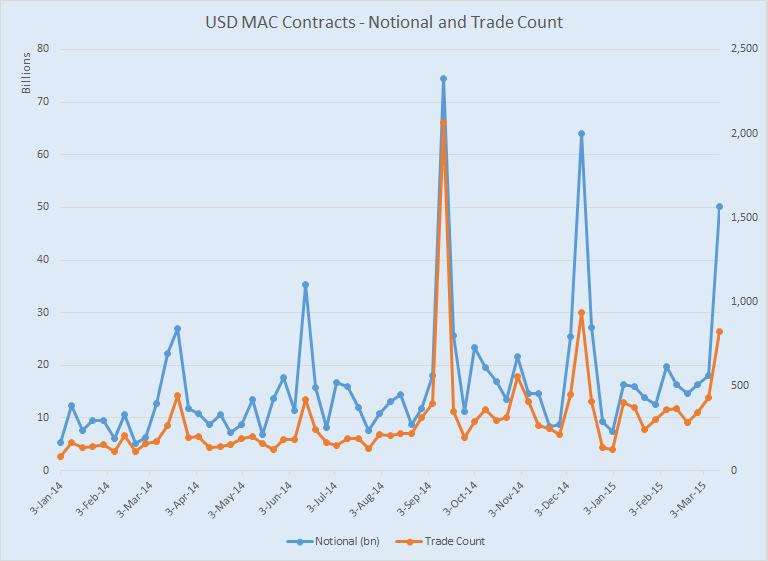
This seems to reinforce what we have found previously:
- Distinct peaks the week of MAC rolls (this includes the MAC rolls in the week ending March 13, 2015).
- A general uptrend, albeit small. I attempted a trendline but the quarterly blips wreak havoc on such analysis.
- The Sep 2014 MAC activity remains the most significant, with Dec and March trailing off.
Plotting this data as a percent of the total USD swap activity, both in terms of notional and trade count, below:
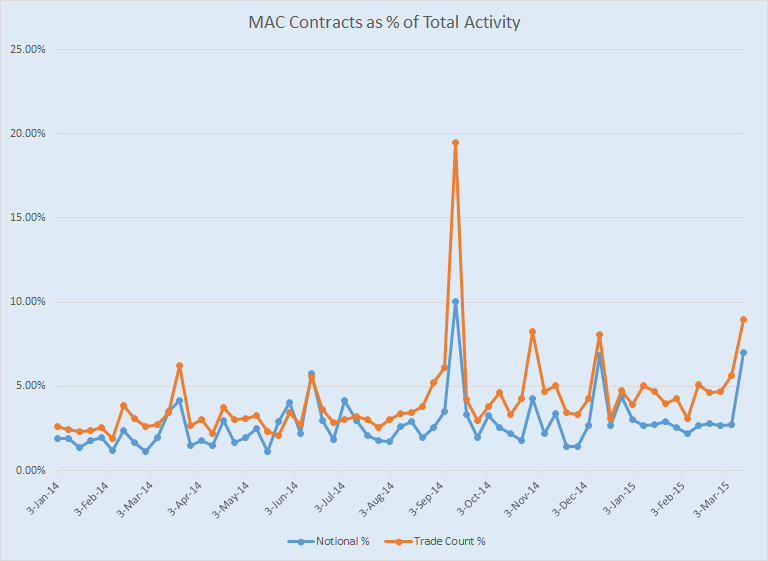
Of note here:
- The fact that the Trade Count % tends to be larger than the Notional % seems to infer that the average trade size of MAC swaps tend to be smaller than other swaps.
- Outside of roll periods, we seem to be hovering right around 5% MAC swaps in trade count terms.
ON SEF
Looking at this data within SEFView, we can see the raw notional amounts (because they are un-capped) for the SEF-executed trades. This analysis highlights the MAC rolls. Here we will look at all currencies (which is primarily USD, but we will show that further below):
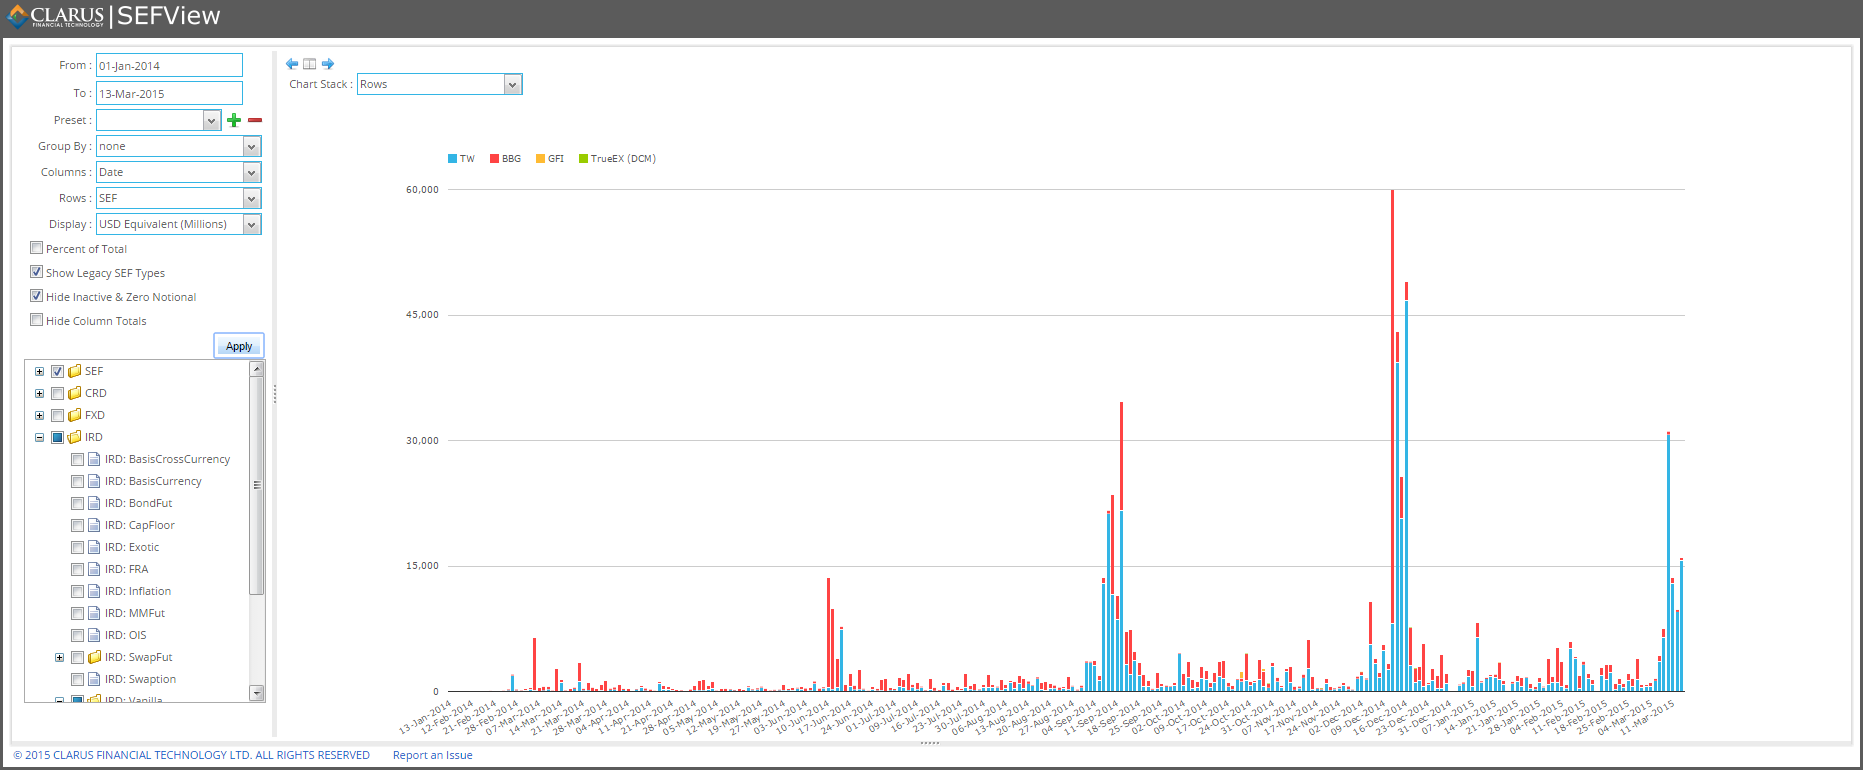
For the astute readers, there are a few things that might jump out:
- The MAC rolls seem much more obvious when looking at SEF data, which is full-notional. I would infer from this that MAC contracts are typically dealt in non-block size, except during the roll. This would seem logical, but would require more analsyis (below).
- The most recent roll week (March 2015) seems to be mostly blue (Tradeweb)
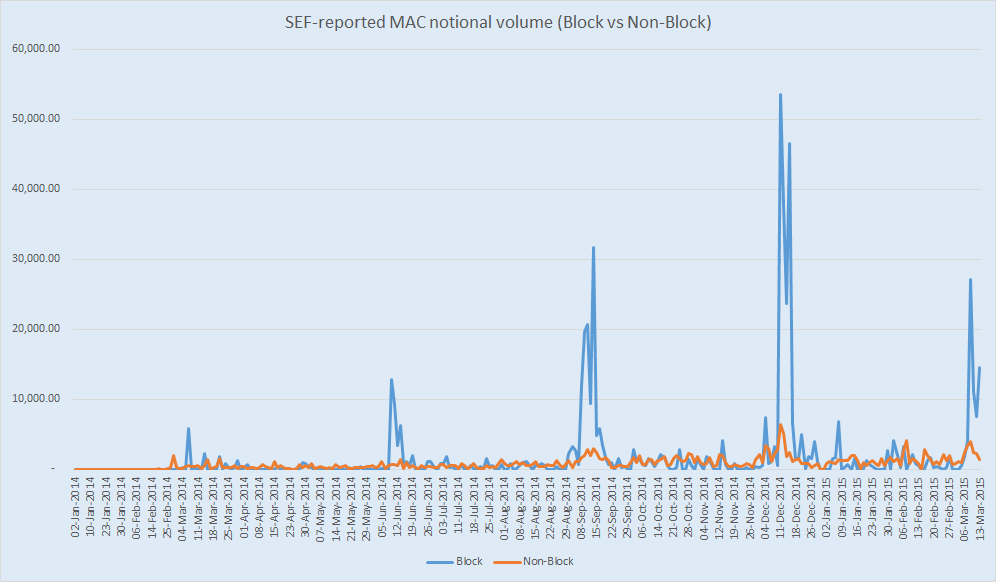
Lets look at the aspect of block trading. I pulled the SEF data from SEFView, but this time chose to plot volume reported as Block vs volume reported as non-Block. The chart of this data (below) seems to contribute to the notion that a client would accumulate a MAC position through non-block trading, and then execute block trades at the roll:
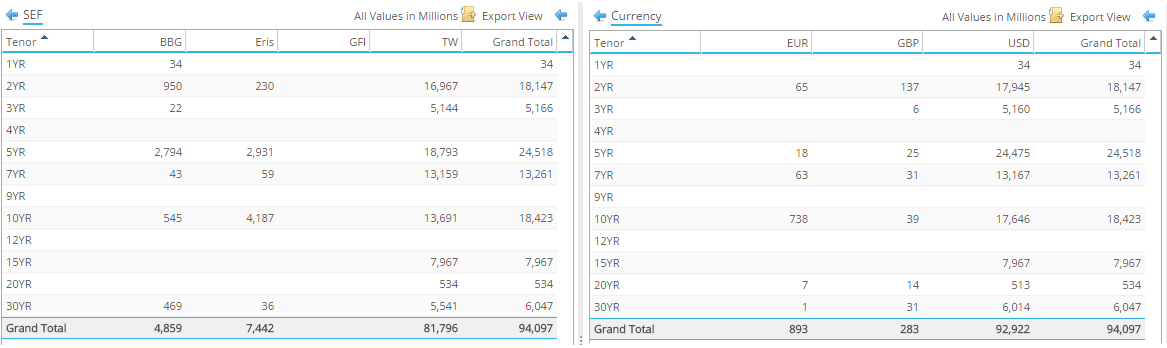
Finally, the analysis would not be complete without looking at numbers for each SEF. I’ll present four charts, all of them by tenor. The left-hand side is by SEF, and the right-hand side by currency. Note that here I have added swap futures (Eris) to the analysis, the previous charts did not include futures. These charts are only for the first two weeks of March 2015.
First in notional terms:
Then in DV01 terms:
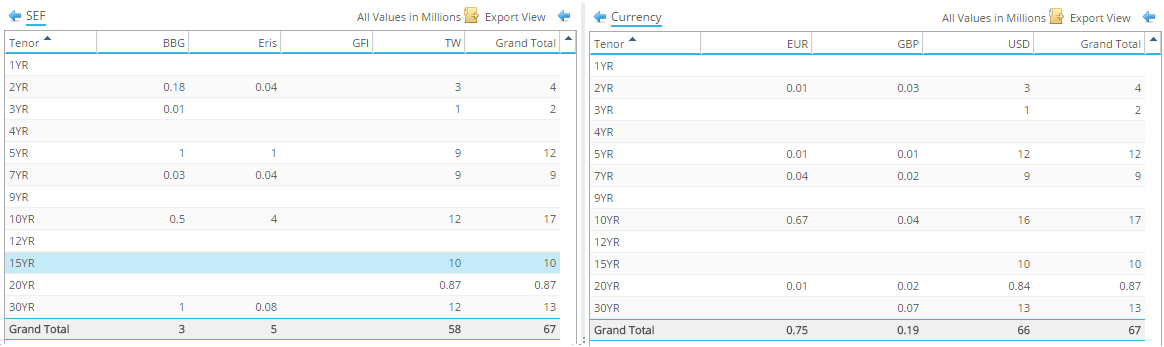
Few things of note here:
- 5, 10, and 30 YR tenors are the most active in DV01 terms.
- USD by far the most active.
- Tradeweb reporting the majority of the activity in both notional and risk terms.
I am still anticipating larger numbers to come in MAC swaps. I’ll keep checking and report my findings. Certainly by the June roll.