Continuing with our monthly review series, let’s take a look at Interest Rate Swap volumes in March 2016.
First the highlights:
- On SEF USD IRS in March 2016 volume was > $1.25 trillion
- For price forming trades, DV01 was 10% lower than Feb 2016
- Butterfly trade volumes were up and Outright volumes were down
- USD SEF Compression volumes were exceptional at >$240 billion
- On SEF vs Off SEF for price forming trades was 64% to 36% in March
- USD Swap Rates were up, reversing the Jan and Feb downwards trend
- SEF Market Share shows Tradeweb first, taking over from Bloomberg
- Tradeweb gains are due to its larger share in Compression and Roll activity
- CME–LCH Switch volumes were the lowest since Oct 2015
- Global Cleared Volumes show LCH SwapClear increasing its share of USD Swaps
- And LCH SwapClear significantly increasing AUD OIS Swap volumes
Onto the charts, data and details.
USD IRS ON SEF
Using SDRView lets start by looking at gross-notional volume of On SEF USD IRS Fixed vs Float and only trades that are price forming, so Outrights, SpreadOvers, Curve and Butterflys.
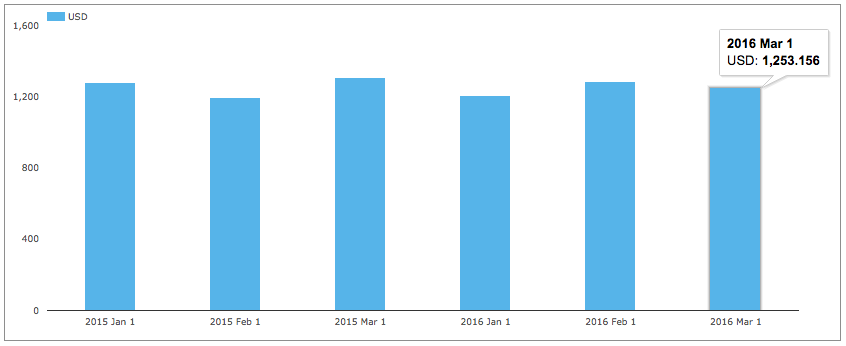
Showing:
- March 2016 gross notional is >$1.25 trillion
- (recall capped trade rules mean this is understated as the full size of block trades is not disclosed)
- A little lower than February 2016, by 2%
- Compared to March 2015, gross notional is down 4%
And splitting by package type and showing DV01 (adjusted for curves and flys).
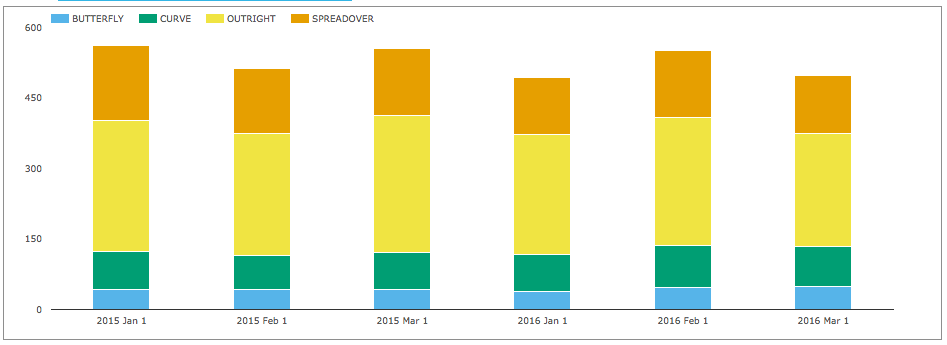
Showing:
- In DV01 terms March 2016 was 10% lower than February 2016
- Overall >$500 million of DV01 was traded in the month
- (recall capped trade rules mean this is understated)
- Butterfly DV01 was higher in March 2016 than any of the other months shown
- Outright DV01 was lower in March 2016 than any of the other months shown
And gross notional of non-price forming trades; Compression and Rolls.
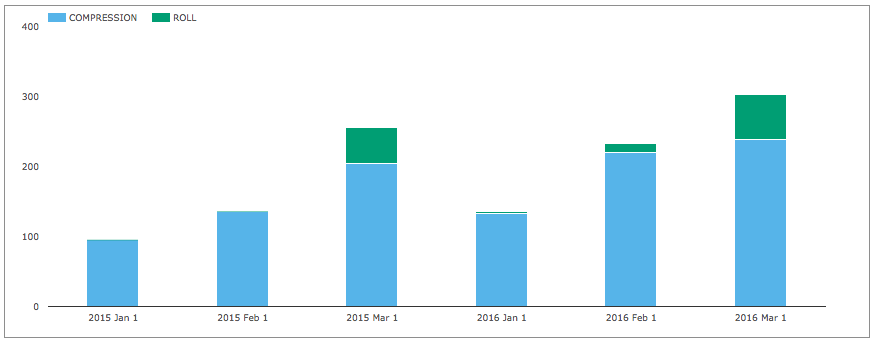
Showing:
- Exceptionally high Compression activity of >$240 billion
- Higher than the >$220 billion in Feb 2016
- Far higher than January 2016 and the corresponding months in 2015
- And higher than the >$204 billion in March 2015
- IMM Roll activity is significant as we would expect in an IMM month
- With >$63 billion in March 2016, compared to > $51 billion in March 2015
- Evidencing larger positions in IMM or MAC Swaps being rolled
USD IRS OFF SEF
Comparing On SEF vs Off SEF for price forming trades as percentages.
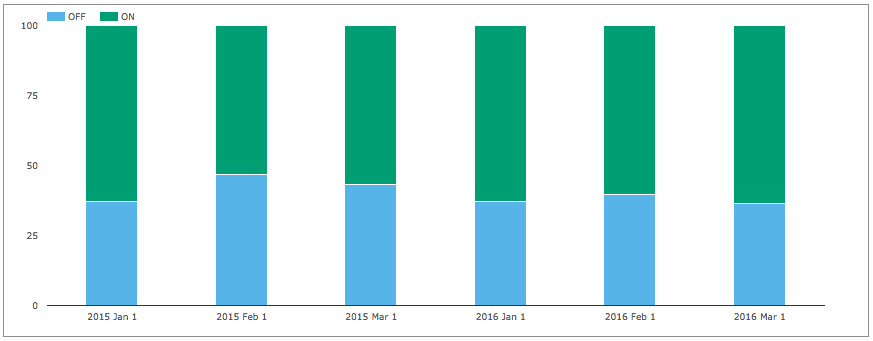
Showing that On SEF vs Off SEF for March 2016 was 64% to 36%, the highest On SEF percentage in the months shown and noticeably higher than the 57% to 43% in March 2015.
USD IRS Prices
Lets now take a look at what happened to USD Swap prices in the month.
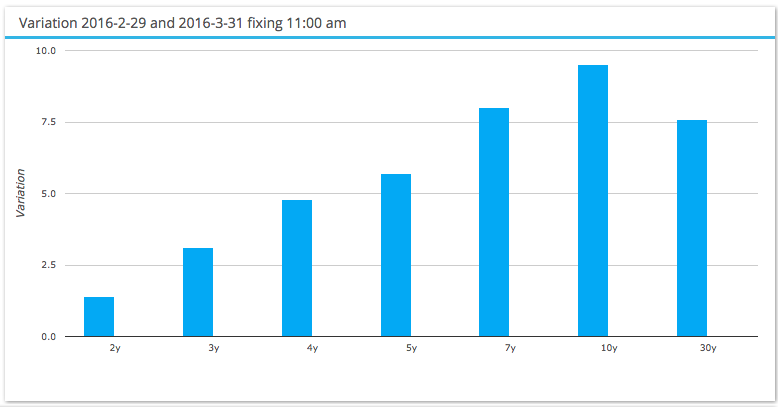
Showing that:
- Rates were up with the curve steepening
- Reversing the downward moves we saw in January and February
- Short rates up 1bps, medium up 6 bps and long rates up 8 to 9 bps
- Reflecting the general improvement in global markets
EUR, GBP, JPY Swaps
Lets also take a look at On SEF volumes of IRS in the other three major currencies.
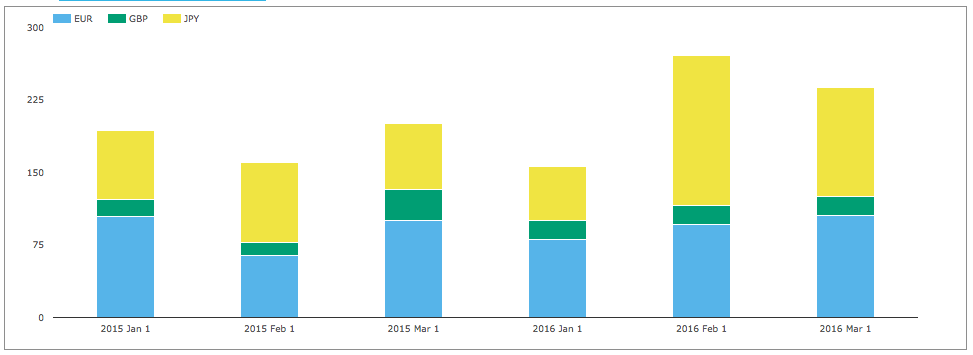
Showing similar volumes in March to those in February.
The overall gross notional in these three currencies of >$237 billion in March is just 19% of the USD volume of $1.25 trillion.
And then looking at SEF Compression activity.
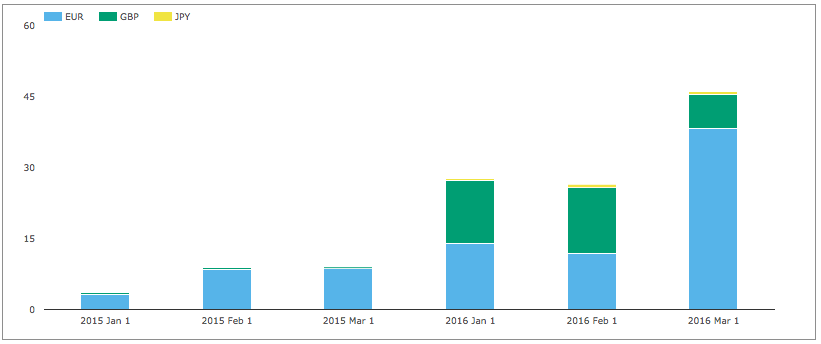
Showing that compression in EUR at > $38 billion, was significantly higher in March than other months shown.
SEF Market Share
Lets now turn to SEFView and SEF Market Share in IRS including Vanilla, Basis and OIS Swaps.
We will start by looking at DV01 (in USD millions) by month for USD, EUR, GBP and by each SEF, including SEF Compression trades and use a chart to compare the relative share in March 2016 with the prior two months.

Showing that:
- Overall March volume is higher than February
- Which the prior SDR charts show is down to Compression and Roll volume
- Tradeweb has the highest volume in March, overtaking Bloomberg
- Due to it larger share of Compression and Roll activity
- Bloomberg is second with similar volume to Feb
- ICAP-IGDL is slightly down from prior months
- Tradition is slightly higher than Feb and significantly higher than Jan
- Tullet is up from Feb
- BGC is down from Feb and similar to Jan
- Dealerweb is similar to Feb
- TrueEx down from Feb and similar to Jan
CME-LCH Basis Spreads and Volumes
Using SEFView we can isolate CME Cleared Swap volume at the major D2D SEFs (on the assumption that this is all CME-LCH Switch trade activity). Lets look at this for the past 3 months.
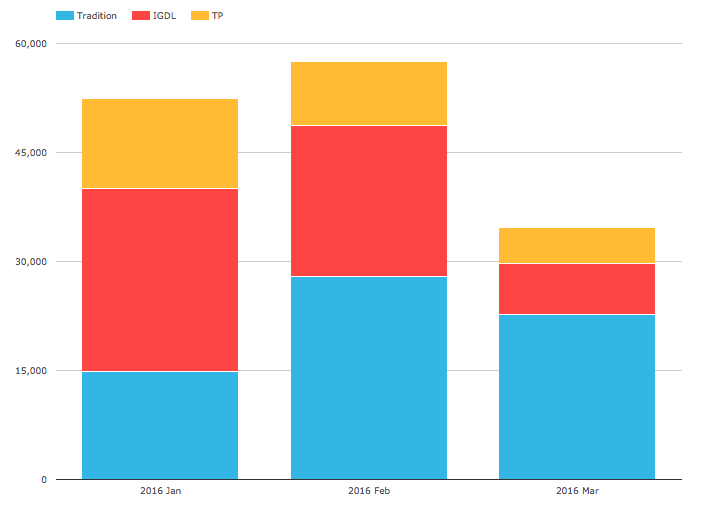
Showing:
- Overall volume in March was $35 billion gross notional
- Significantly down from the > $50 billion in prior months
- And the lowest month since Oct 2015
- Tradition mostly held on to its volume
- IGDL was significantly down
CME-LCH Basis Spreads remain at similar levels to end Feb with 30Y at 2.65 bps. The lack of volatility in the month either the cause or effect of the lower CCP Switch volumes.
Global Cleared Volumes
Now onto CCPView to look at Global Cleared Swap Volumes for EUR, GBP, JPY & USD Swaps.
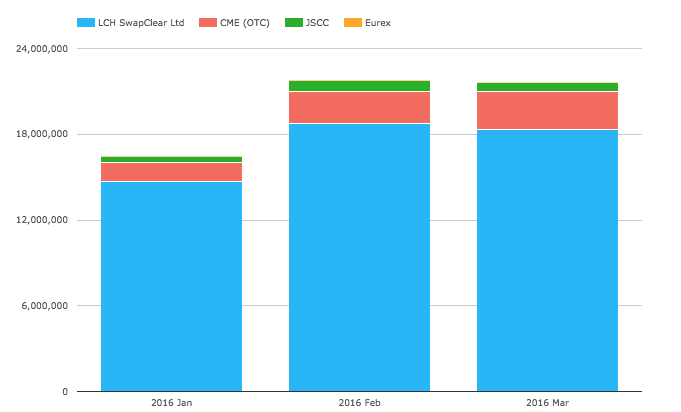
Showing:
- Overall Global Cleared Volumes similar in March to Feb
- LCH SwapClear volume at $18.3 trillion is similar to the prior month
- CME at $2.66 trillion looks higher than prior month (more on this below)
- JSCC at $607 billion is down from Feb but above Jan
- Eurex is up a bit, but at $14.5b in the month still tiny compared to the rest
Lets drill-down to the daily numbers in March for CME.
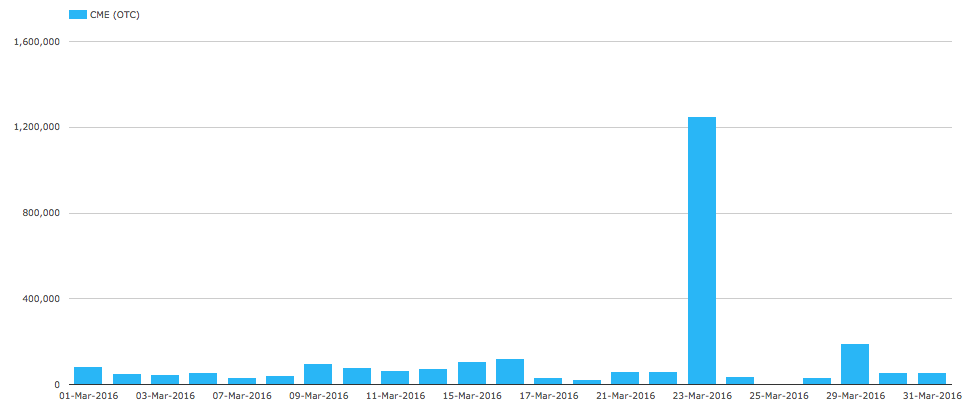
Showing that:
- 23 March has $1.25 trillion!
- Clearly this cannot be new trade volume
- And as we have observed in the past this is TriOptima compression showing up as volume
- We can verify this as the Outstanding Notional does not jump by $1.25 trillion over this period
- As an estimate lest assume that $1.2 trillion of the $1.25 trillion is compression
- Manually adjusting the CME March volume of $2.66 trillion, results in a new figure of $1.46 trillion
- Which is similar to CME’s Jan 2016 volume
A comparison of USD Swap volume at LCH SwapClear and CME gives 84% to 16% for all volume in March.
Client Clearing volume for USD Swaps shows LCH SwapClear at 77% and CME at 23%, which is higher than the 69% to 31% in Jan and Feb.
And before we end, lets look at the volumes of AUD, HKD, SGD Swaps (including Vanilla, OIS, Basis, Zero Coupon).
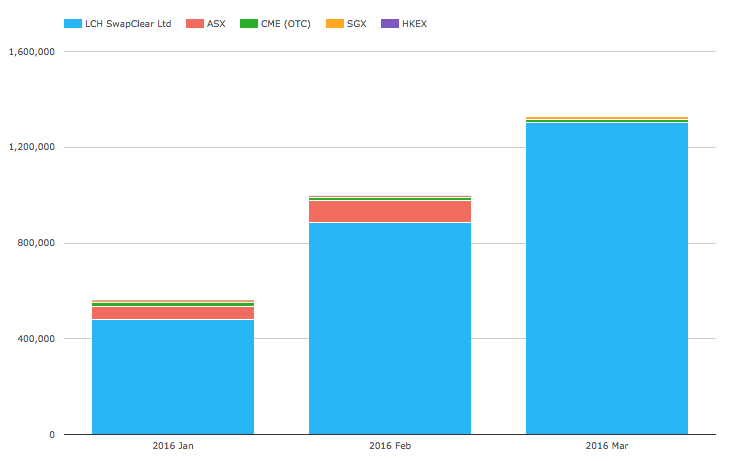
Showing:
- LCH SwapClear has the largest volume
- And is significantly up, increasing 47% from Feb (which was 75% up from Jan)
- Driven largely by increasing AUD OIS volumes
- ASX figures for March are not yet available to us
- ASX volumes for Feb were up 64% from Jan, so also on the up
- CME and SGX just register on the chart
- HKEX not visible
Thats it for today.
A lot of charts; twelve to be precise.
Thanks for staying to the end.
Our Swaps review series is published monthly.