Continuing with our monthly Swaps review series, let’s look at volumes in May 2017 and in a change from the usual format of SDR data, then SEF market share and then CCP volumes, I will take a product centric view.
Summary
USD IRS
- Global Cleared volume in May was $4.6 trillion (up from $3.6 trillion in April)
- US On SEF volume is $2.16 trillion and Off SEF $1.1 trillion
- The US total is 71% of global cleared volume
- Tradeweb has the largest SEF market share
- SEF Compression is up with > $325 billion in the month
- CME-LCH Basis volumes and spreads are down
USD OIS
- Global Cleared volume in May was $9.2 trillion (up from $4.6 trillion in April)
- US On SEF volume is $1.44 trillion and Off SEF $2.6 trillion
- The US total is 44% of global cleared volume
- TrueEx has the largest On SEF volume of $415 billion in package/rolls
- Tullet and BGC tied on $350 billion
EUR Swaps
- Global Cleared volume in May was €6 trillion (down from €6.6 trillion in April)
- LCH SwapClear has 96.5% market share in May
- EUR IRS and EONIA have similar volumes each month
JPY Swaps
- Global Cleared volume in May was $1.4 trillion
- JSCC is just larger than LCH SwapClear each month after February
- JPY IRS is 95% of volume, OIS, Basis & VNS the rest
AUD Swaps
- Global Cleared volume in May was $1.8 trillion
- LCH SwapClear with $1.6 trillion and ASX with $220 billion
- AONIA volume is up massively
Background
The three data sources I use are:
- CCPView for Global Cleared volumes and market share, available at the level of ccy/product
- SEFView for US Swap Execution Facility volumes and share, available at the level of instrument
- SDRView for US Repository data (On/Off SEF, Cleared/UnCleared) available at the level of trade
Depending on the ccy and product, I will use one or more of these sources in the sections below to analyse volumes and highlight trends.
For trial subscriptions to these data sources, please see CCPView, SEFView, SDRView product pages.
USD Swaps
Lets start with with Global Cleared volumes of USD Swaps (IRS, OIS, Basis, ZC, VNS) in gross notional terms.
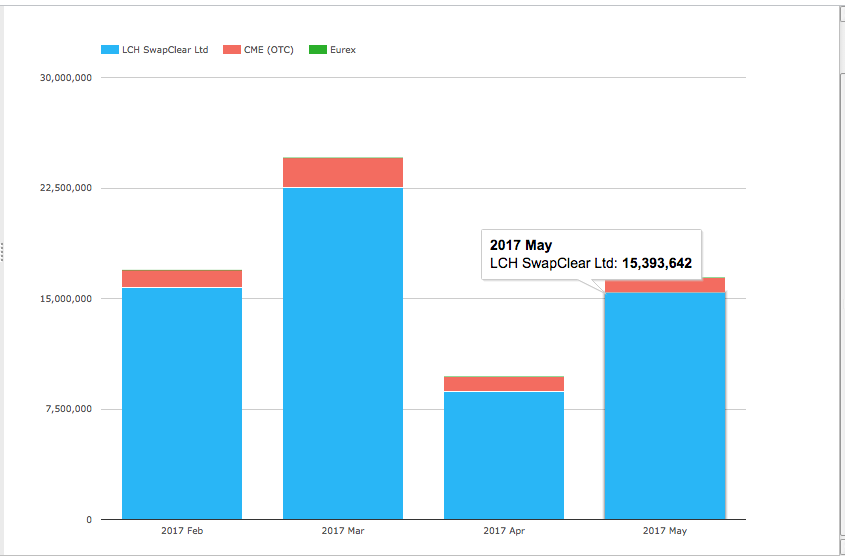
Showing:
- May volumes are significantly up from April and similar to Feb levels
- Overall volume in May was $16.5 trillion in gross notional terms
- LCH SwapClear by far the largest with $15.4 trillion in May
- CME with $1 trillion in May
- Eurex just registering with $640 million in the month
- No other CCPs have USD IRS volume
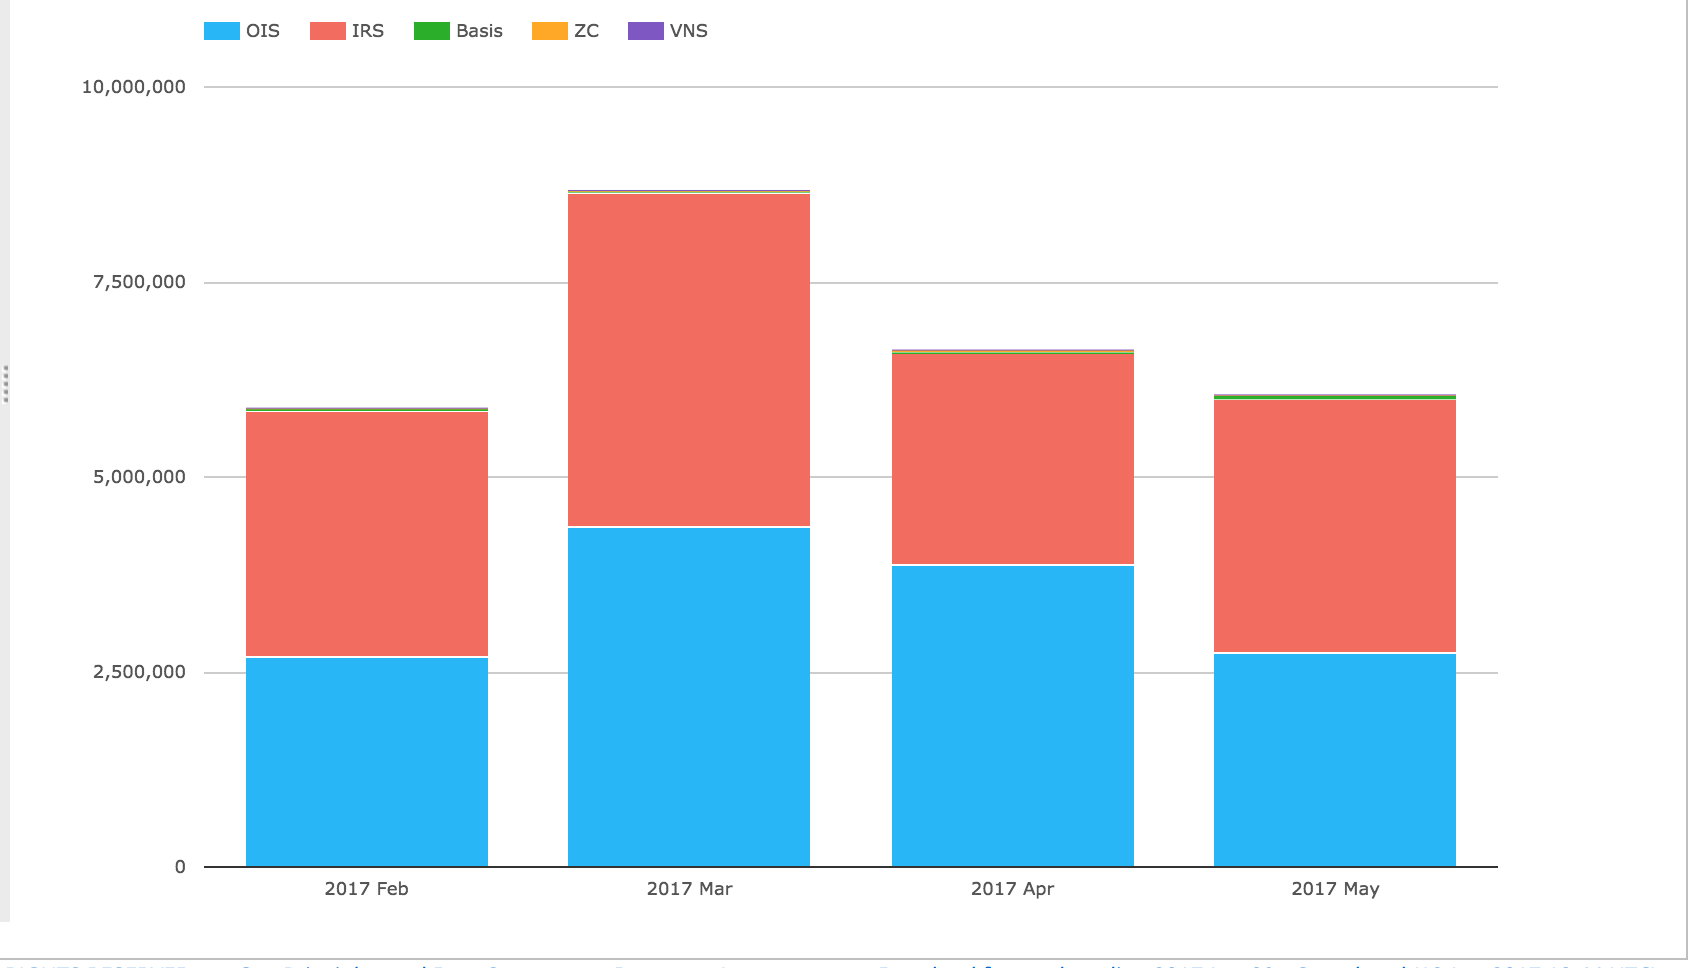
Selecting just LCH SwapClear and Product Type.
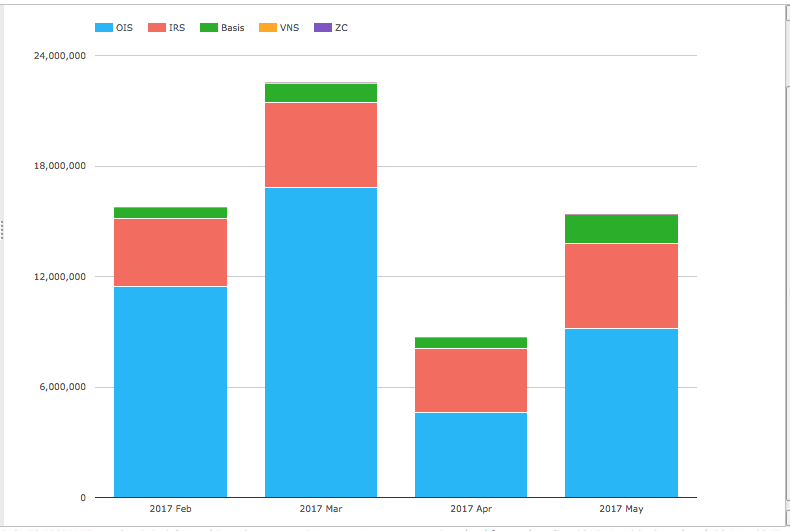
We see that:
- USD OIS volume is the largest in notional terms and the most variable month to month
- USD OIS in May at $9.2 trillion, is up from $4.6 trillion but well below the high in March of $16.8 trillion
- USD IRS notional in May at $4.6 trillion compares to the $3.5 trillion in April
- USD Basis swap notional in May was $1.6 trillion compared to $600 billion in April
USD IRS
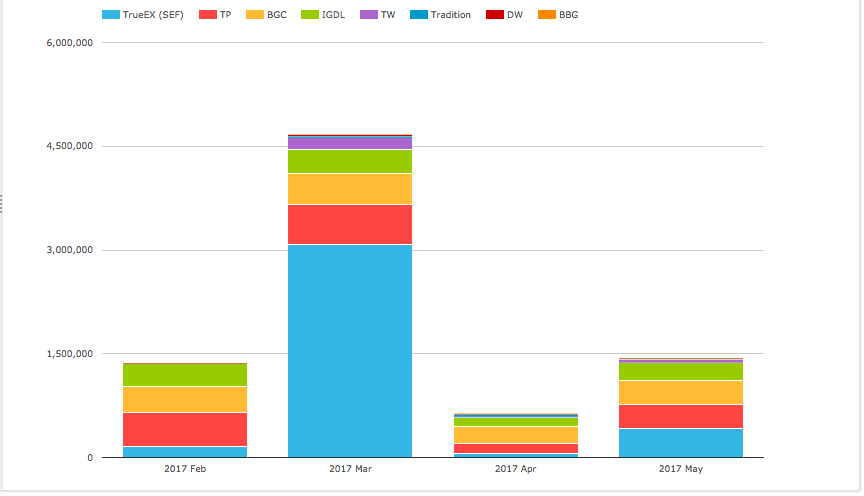
Lets now turn to US SEF volumes and market share for USD IRS (Vanilla only, so excluding OIS, Basis etc).
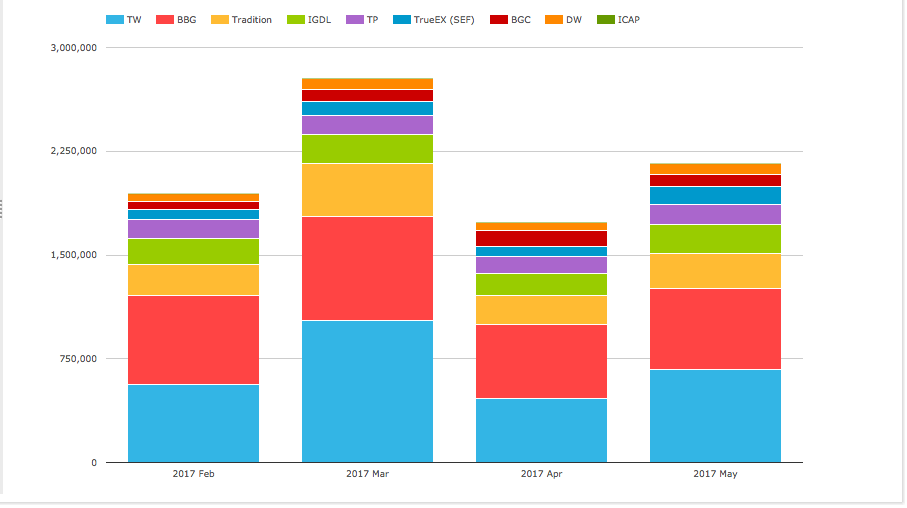
Showing that:
- Overall May volume of $2.16 trillion represents 47% of the global volume of $4.6 trillion
- Tradeweb is the largest with $670 billion, followed by Bloomberg with $585 billion
- D2C SEFs (Tradeweb, Bloomberg and TrueEx) have a total of $1.4 trillion
- D2D SEFs with $775 billion
- D2D in order of a market share are Tradition, IGDL/ICAP, Tullet, BGC, Dealerweb
- Volumes are up from April but below the highs of March
USD IRS SEF Compression
In SDRView, we can isolate non-price forming trades; compression and rolls.
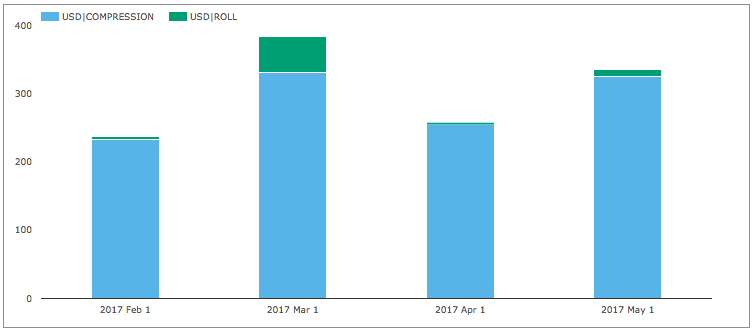
Showing >$325 billion of Compression notional with the true number higher as as capped disclosure rules for SDRs mean the actual volume is not fully disclosed.
All this Compression volume is on the D2C SEFs and means the $1.4 trillion gross notional in the previous section should be adjusted to around $1 trillion to get to a price-forming volume figure, bringing it closer to the D2D SEF volume figure of $775 billion.
USD IRS On and Off SEF
Next using SDRView, the gross-notional volume of On and Off SEF USD IRS Fixed vs Float price forming trades (Outrights, SpreadOvers, Curve/Flys).
Showing that:
- On SEF volume is > $1.5 trillion, which we know is understated due to capped notional disclosure rules
- This figure should be equal to the SEF figure of $2.16 trillion
- Off SEF volume is $740 billion, but using the same capped proportion as that for On SEF, the actual volume would be $1.1 trillion
- This makes the total On SEF and Off SEF equal to $3.26 trillion
- Volumes of both On and Off SEF are up from the lows of April, as we have seen in both SEF and CCP data
- On SEF vs Off SEF proportion is 66% to 33%
CME-LCH Basis Swaps
For the last chart for USD IRS, lets looks at CCP Switch volumes between CME and LCH.

Showing that:
- Volume in May is $50 billion, down from the $60 billion in April and the record high of $96 billion in March
- Tradition has the largest share with $31.5 billion in May
- IGDL/ICAP is next with $13.5 billion
- BGC with $3.6 billion
CME-LCH Basis Spreads ended the month with 10Y at 2.50 bps (-0.45bps) and 30Y at 3.55 bps (-0.65bps).
USD OIS
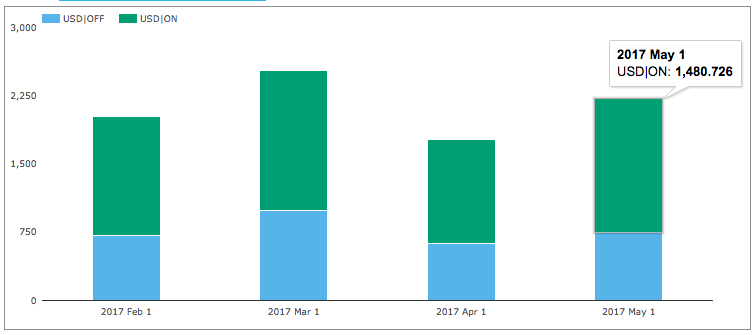
Now lets turn our focus to USD OIS and On SEF gross notional volume and market share.
Showing that:
- Overall May volume of $1.44 trillion represents 16% of the global volume of $9.2 trillion
- Meaning the bulk of this market trades either Off SEF in the US or offshore in the UK
- (Recall that USD OIS is not SEF Mandatory, unlike USD IRS)
- TrueEx the largest with $415 billion of package/roll volume
- (See March 2017 Swaps Review for more detail on TrueEx volumes)
- Tullet and BGC neck and neck with $350 billion
- Followed by ICAP/IGDL with $252 billion
And using SDRView we can look at On SEF and Off SEF volumes.
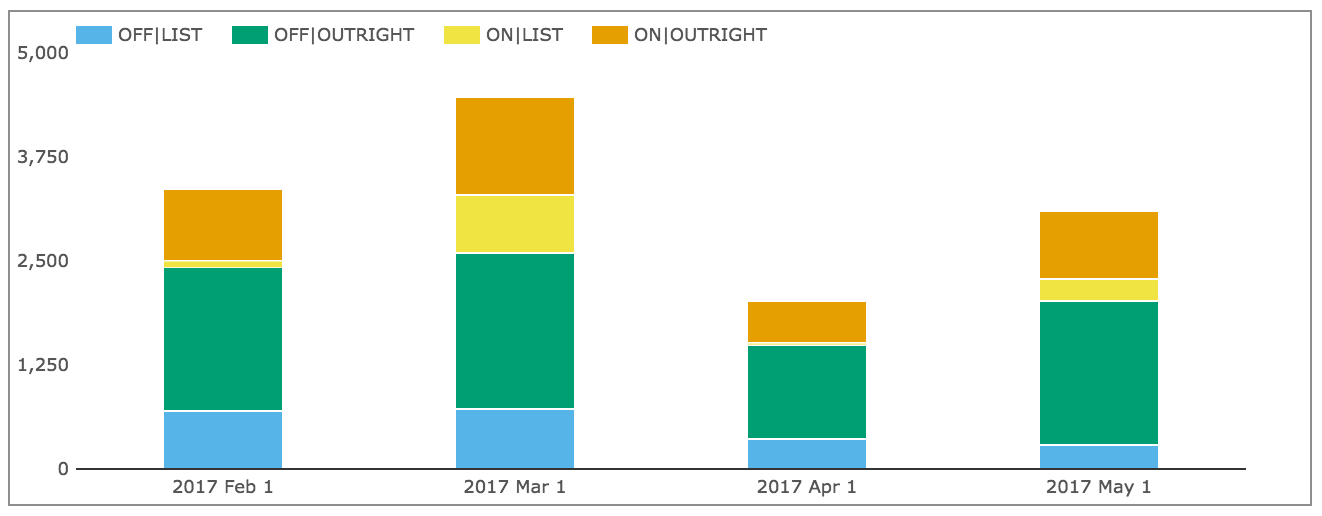
Showing that:
- May volume is up from the lows of April
- Off SEF Outright volume is the largest component at > $1.7 trillion in May
- On SEF Outright is next at > $800 billion
- On SEF List/Roll volume is >$290 billion
- Total On SEF in SDR is $1.1 trillion compared to the $1.44 trillion in SEFView
- Implying that the $340 billion difference is due to capped notional rules in SDR
- Using the same proportion, the Off SEF total of $2 trillion should be $2.6 trillion
The SDR total for USD OIS for On SEF and Off SEF is $1.44 trillion plus $2.6 trillion or $4 trillion.
Meaning that of the $9.2 trillion of global cleared USD OIS, $4 trillion or 44% is traded onshore in the US and the remainder off-shore in London and elsewhere.
EUR Swaps
Now lets switch to Global Cleared volumes of EUR Swaps (IRS, OIS, Basis, ZC, VNS) in gross notional terms.
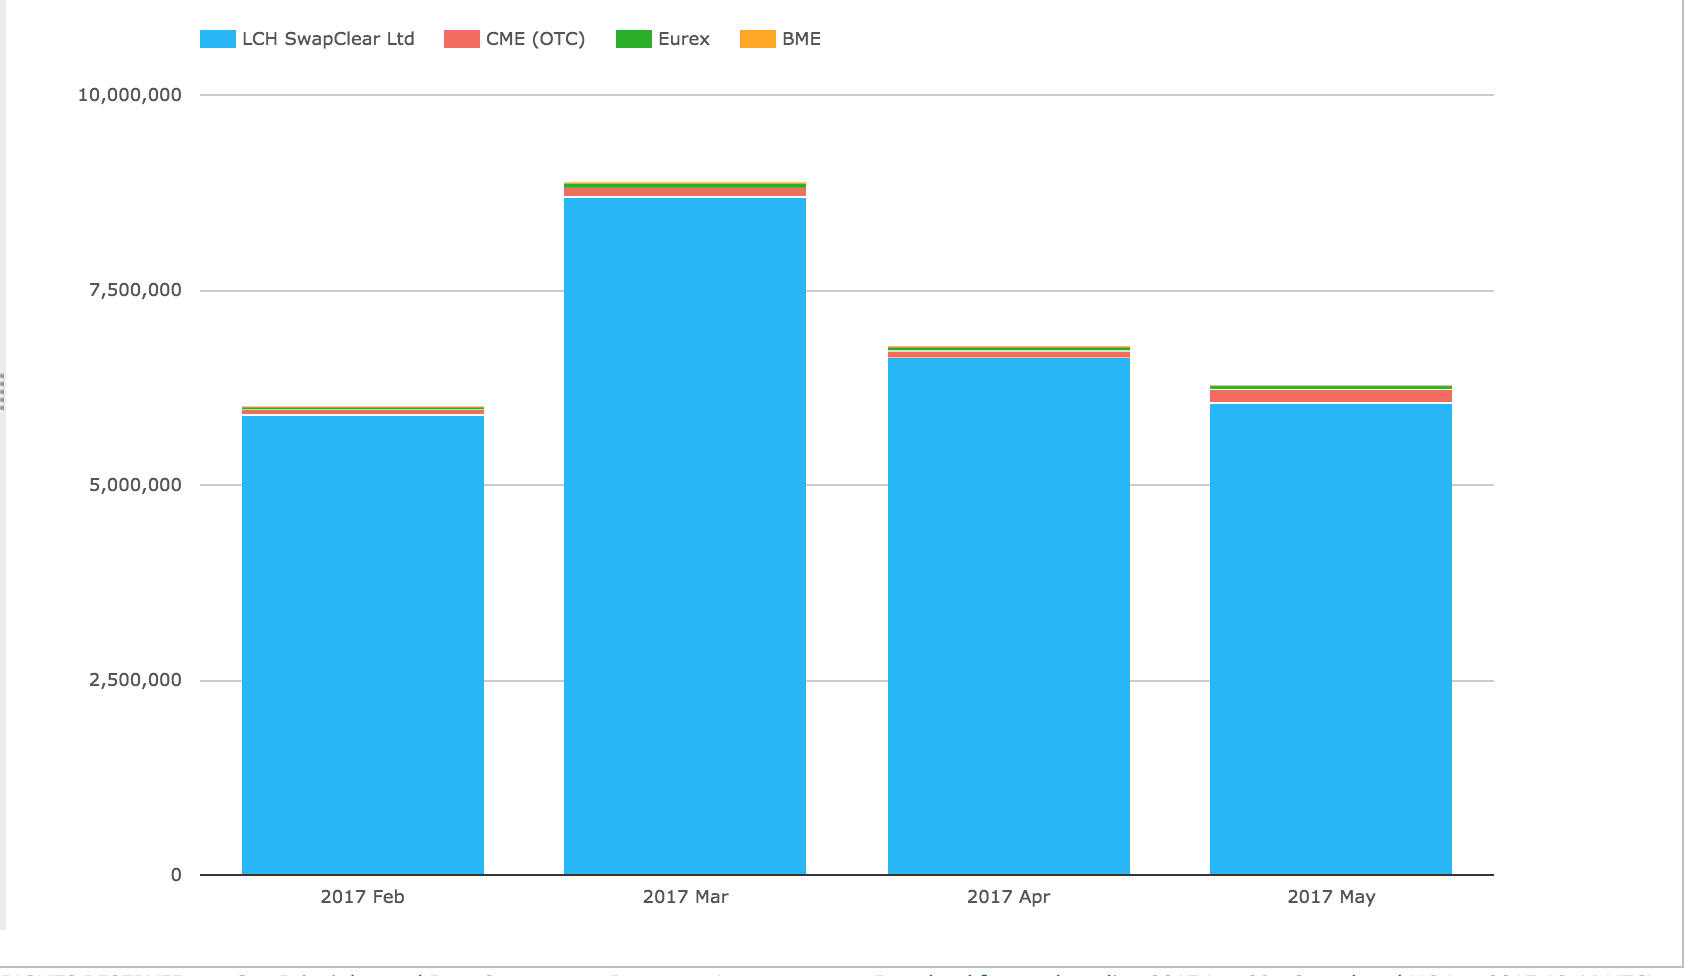
Showing that:
- LCH SwapClear dominates volumes with 96.5% market share
- LCH SwapClear gross notional in May was €6 trillion, down from €6.6 trillion in April
- CME next with €172 billion
- EUREX with €47 billion
- BME with €96 million
A real mountain to climb for EUREX or any other CCP to compete in EUR with LCH SwapClear.
Selecting just LCH SwapClear and Product Type.
We see that OIS and IRS gross notional is comparable each month, unlike in USD where OIS is much higher.
The total volume of €6 trillion in May is made up of €3.25 trillion of IRS and €2.75 trillion of EONIA.
As EUR volume in SEFView is only 5% of global volume, we will not look at SEF or SDR data.
JPY Swaps
So lets switch to Global Cleared volumes of JPY Swaps (IRS, OIS, Basis, ZC, VNS) in gross notional terms.
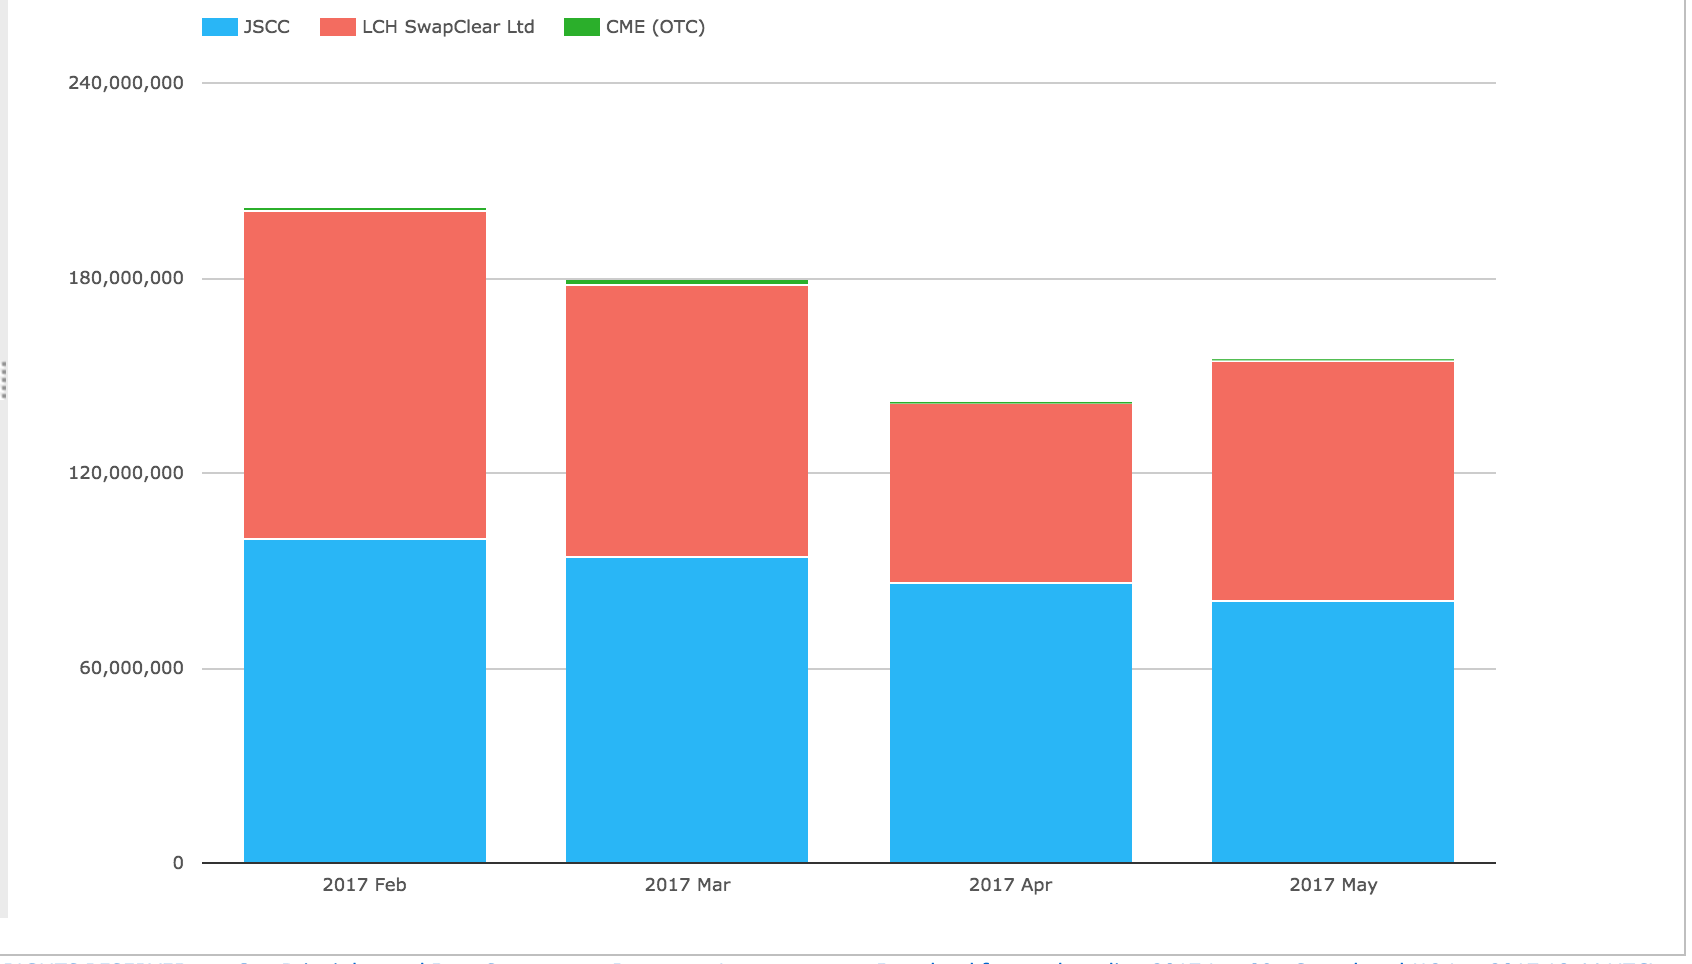
Showing that:
- May volume at JPY 155 trillion or $1.38 trillion, is slightly up from April
- JSCC has larger volume than LCH SwapClear in each month except Feb
- JSCC volume in May was JPY 80.5 trillion (or $720 billion)
- LCH SwapClear volume in May was JPY 74 trillion (or $660 billion)
JPY IRS makes up 95% of the overall volume, meaning that OIS, Basis, VNS are just 5% in total.
AUD Swaps
And before we end, global cleared volumes of AUD Swaps (IRS, OIS, Basis).
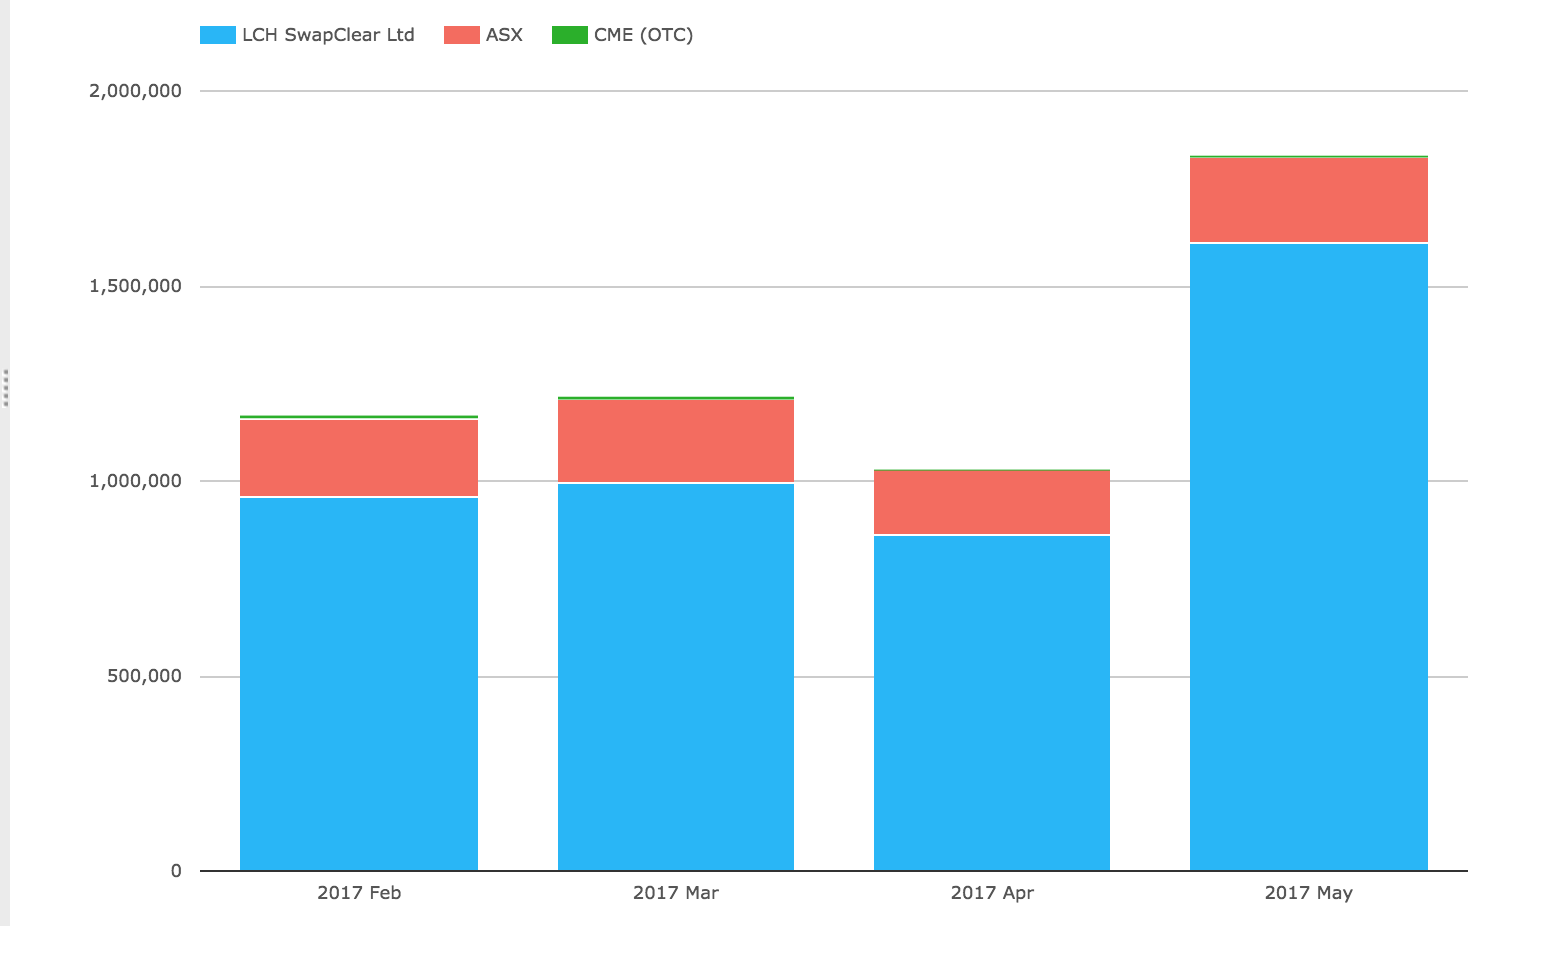
Showing that:
- LCH SwapClear volume in May is $1.6 trillion, up from $860 billion in April
- ASX volume in May is $220 billion, up from $170 billion
- CME volume in May is $6 billion
The huge increase in LCH SwapClear volumes is due to AUD OIS volume sharply up to $1 trillion in May from $470 trillion in April.
The End
That’s it for today.
Thanks for staying to the end.
Any feedback on the new format, please let us know.
Our Swaps review series is published monthly.