SEF Data Normalization & Aggregation
Drilldown into SEF Activity
Report and Filter by Asset Class, Product, Currency, Security, Currency Pair, Tenor
Report on USD equivalent notionals, 5YR equivalents
Delineates Block vs Non-Block
Includes DCM Swap Futures, as well as Bond and MM Futures as a benchmark
Full History from SEF inception Oct 2, 2013
Latest Posts
-
Feb, 4
2025 cross-currency swap volumes and market shares
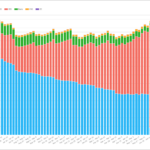
This blog reviews 2025 full-year cross-currency swap volumes, their split between on- and off-platform, and the market shares of platform groups. We focus on the cross-currency basis swaps in the top five currencies, using SDRView and SEFView to aggregate volumes, DV01, and trade count by month and year. Key takeaways For the top five currencies’ […]
Read moreJan, 7
Derivatives innovation: RTX and D2D execution automation
This blog looks at RTX Fintech & Research (RTX), a recent start-up interest rate swap SEF (Swap Execution Facility). Key takeaways: Read on for more details. All the charts, data, and statistics in this blog were sourced from SDRView. D2D SEF development After the 2008 Global Financial Crisis (GFC), the G20 consensus and national regulators exerted pressure […]
Read more -
Jun, 11
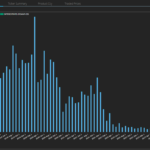
SOFR swap SEF volumes – 2025 to end May
This blog follows the recent pattern of intra-year SOFR swaps SEF volumes blogs to complement the full-year reviews in 2023 and 2024. Given recent market dynamics, I was curious about the activity levels so far in 2025. Please note: SDRView includes MTFs and OTFs as well as SEFs in its platform scope. For brevity, we […]
Read moreMay, 21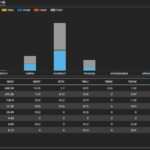
2024 SEF volumes and share in SOFR swaps
SOFR Swaps at D2D venues were usually spreadover, butterfly, curve switch or CCP switch packages. On D2C venues, spot-starting SOFR swaps were dominated by outright trades. As well as spot-starters, forward, IMM and MAC SOFR swaps also trade in significant numbers on D2C venues (unlike D2D venues). Continue reading for the charts, tables, and details. Background This post iterates, for […]
Read more -
Jun, 25
CAD Swaps – What’s New?
OMG. The last time I wrote about CAD Swaps was in 2017! Seven years later, what has changed? (Skip to the Summary to find out 😛 ). CDOR-CORRA Conversion The not-so-new news is that CDOR will cease in four days time (28th June 2024 will be the last fixing ever published). I have covered the […]
Read moreJun, 4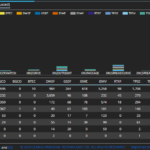
SOFR Swap SEF Volumes – May 2024
Continue reading for the charts, tables and details Background In February 2024, I published the blog 2023 SEF Volumes and Share in SOFR Swaps, which used data we collect, filter and enhance in our SDRView product. That blog looked at the type of SOFR Swaps that trade on Dealer-to-Dealer (D2D) and Dealer-to-Client (D2C) venues; namely Spreadovers, Curves […]
Read more -
Apr, 16
All You Need To Know To Avoid The Trade Execution Requirement?
What is a MAT trade? A MAT filing, or “Made Available to Trade” determination, is when a trading venue (SEF) submits a proposal to the CFTC stating that they deem certain swaps to be liquid enough to have an execution mandate applied to them. Basically, a SEF says “I think these swaps should only be traded on SEFs in […]
Read moreFeb, 14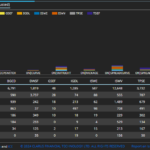
2023 SEF Volumes and Share in SOFR Swaps
Background In May 2023, I published a blog on IDB Market Share in SOFR Swaps, which used data we collect, filter and enhance in pur SDRView product. The blog looked at the type of SOFR Swaps that trade on Inter-Dealer Broker (IDB) SEF venues, also referred to as Dealer-to-Dealer (D2D venues); namely Spreadovers, Curves and […]
Read more