Or: What I learnt about Bunds today
- ISINs have made a mockery of OTC derivative transparency under MIFID II.
- So it makes sense to look at an asset class that ISINs work for – Bonds!
- Bloomberg is a venue that makes their data usable to the public.
- €6bn of Bunds traded on Bloomberg last week.
- Nearly one-third of this notional traded in the benchmark 10 year tenor.
- TRAX has also reported on €3.6bn of Bund activity this week.
- We encourage our readers to let us know how they are getting on with MIFID II data. Comments are open….
ISIN Woes
We certainly expected some teething problems with ISINs for OTC Derivatives. We didn’t expect there to be SO many problems with them. Because ISINs are the only trade identifiers, OTC data under MIFID II is severely challenged.
So let’s cast our eye over an asset class where ISINs make more sense – Bonds.
German Government Bonds (“Bunds”)
As a result of transparency deferrals under MIFID II, we generally expect to see a wave of new information hitting our screens every Tuesday at 9am London time. This is when weekly aggregated volumes are published per ISIN. I imagine the regulations were written with the assumption that:
- Each APA (or Trading Venue directly) would publish a simple weekly, aggregated volume file per ISIN at 8:55am.
- The public could consume these files and add up all of the volume traded in the past week.
- By including trade counts, we would know average trade sizes.
- The public could monitor the variations in volumes traded.
- Markets therefore provide transparency over actual traded liquidity.
- The trade level details that make up these weekly aggregated statistics would be made available four weeks after, unless the local regulator thought they should be deferred indefinitely.
This sounds like a simple, first step towards understanding European capital markets, right?
Imagine that I am a European worker. I have heard that MIFID II promises more transparency in capital markets. I therefore want to use this new MIFID II data to check that my pension is invested in assets that can be readily liquidated if I need to make a lump-sum withdrawal.
I set about putting myself into their hypothetical shoes to find out if this were possible.
Which Bonds?
Let’s be pragmatic and state that we expect to see teething problems in illiquid areas of the market. But as a Proof of Concept, let’s try to aggregate across MIFID II data sources on a weekly basis for the most liquid market segment – German Government Bonds.
First off – we need to get the list of liquid bonds. This is provided by ESMA here under the catchy title “Liquidity assessment for bond instruments except ETCs and ETNs”.
Deciphering this file, I narrowed down the list to:
- Bond types of “EUSB”, corresponding to a Sovereign Bond.
- Liquidity status of “Liquid”.
- The ISIN including “DE” for Germany.
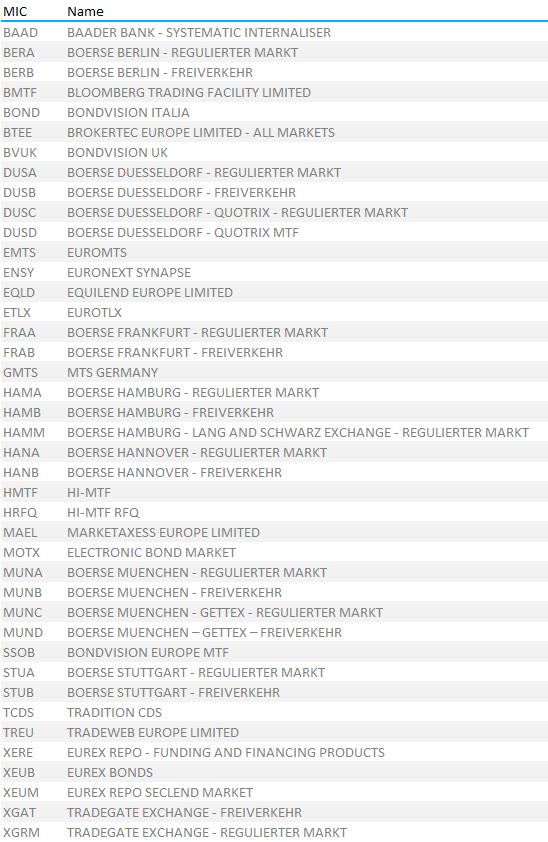
I threw the resulting list of 31 ISINs into our FIRDS descriptive MicroService et voilà:
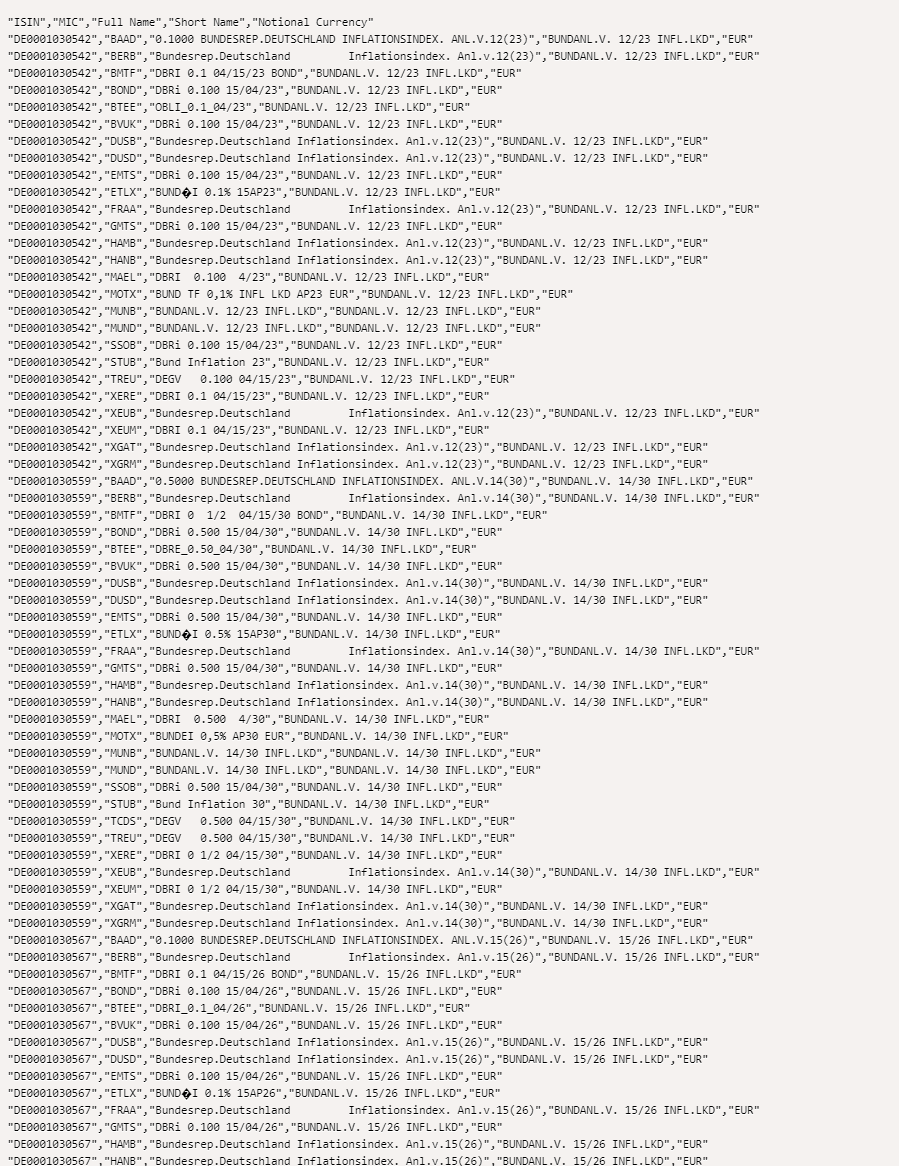
So far, so good. I’m able to get data from ESMA about what is liquid, send the list of liquid ISINs back to ESMA, and they then tell me:
- The notional currency of the bond. All EUR in this case.
- The trading venues that have listed this bond for trading.
- A short name.
- A long name.
I imagine this has been a typical workflow of many people in the industry these past two weeks. Thanks to our Clarus MicroService in particular, it works for me. I’m not sure that a hypothetical European worker would find it so easy however.
Which Data?
Okay, suitably armed with a list of 31 ISINs, I can now go out and find the weekly aggregated data. Right? That is what I inferred from the regulations. In practice:
- The data is published by both APAs and MTFs. So I will need to check out multiple venues.
- The number of MTFs that have listed German Government bonds is 41. Forty-One!
- Some APAs don’t publish weekly aggregated data. They publish all data on T+2.
- Remember that the weekly aggregate data is only for deferred trades. For a true picture of what traded, we need to include all trades that were also published after 15 minutes and after T+2. Let’s file this under “phase 1.1” of our plan and put it in our “to-do” pile for later consideration.
APA Public Data
So what is the size of this aggregation task? Let’s assume the ideal situation that most data is published via APAs and it’s only the really big MTFs who might bother publicly disseminating their data. I believe that the data an APA must make public is defined in this Article 14:
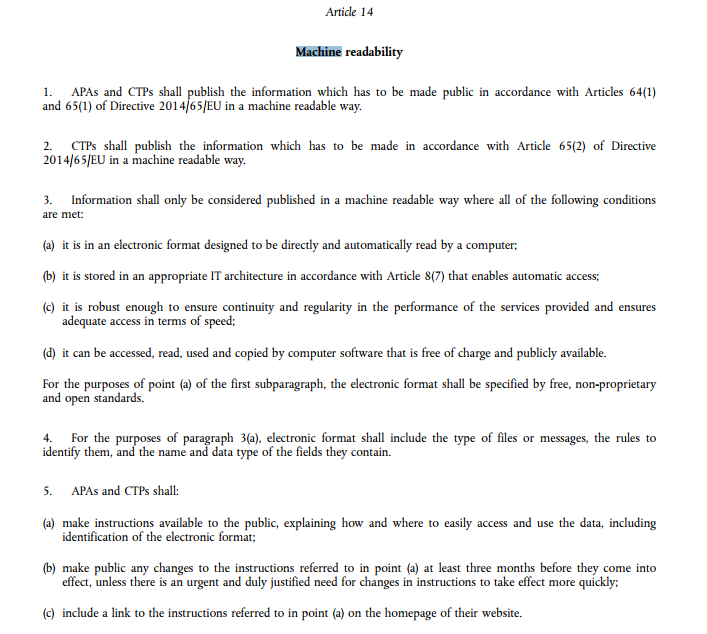
How do our readers think APAs have done in satisfying this Article 14? Please add comments below.
Have you found public data?
Is it “machine readable”?
We’d love to see the industry feedback, and it’s got to be quicker than responding to an ESMA consultation….
MTF Public Data
Many operators have multiple venues listed – MTS (part of LSEG) has BVUK, BOND, EMTS, GMTS for example. So generally, if you find data for one venue, you can hope to find data for many venues.
In my search for public data, I focussed on the D2D and D2C markets.
Let’s analyse the data for the venues I was successful in extracting data from.
Bloomberg MTF
For the second week in a row, I got deferred data from Bloomberg on their public website. Last week, we saw:
- ~1,450 ISINs reported with aggregated weekly volumes.
- 129 of these were German ISINs.
- A total volume of around €2.7bn in German Government Bonds was reported.
Looking at a chart of volumes by ISIN location, I think it is pretty much as expected:
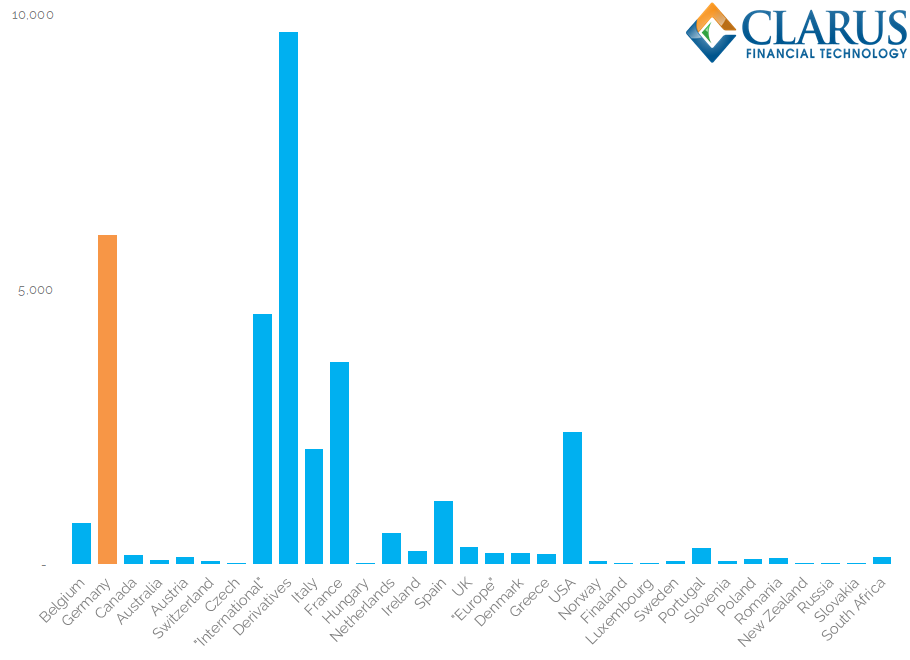
Showing;
- Notional volumes as reported in Weekly Aggregated figures by the Bloomberg MTF for the week 3rd Jan – 9th Jan.
- I have used the first two letters of the ISIN to assign the country.
- “OTC Derivatives” (code EZ) had the largest EUR-equivalent volume.
- Germany is second. This is good – it means I’m on the right track when looking for German bonds. More volume should mean more trades and a less frustrating search!
Confident I am roughly on the right track, on Tuesday I therefore repeated the process for Bloomberg’s MTF. For the week 9th Jan – 16th Jan 2018, we saw a LOT more data!
- 4,543 ISINs!
- For German Govies (can I just say “Bunds” from now on please?) €6bn in notional. Over double the first week.
Bund volumes on the Bloomberg MTF, split by ISIN, provide a meaningful analysis of what has traded and hence liquidity:
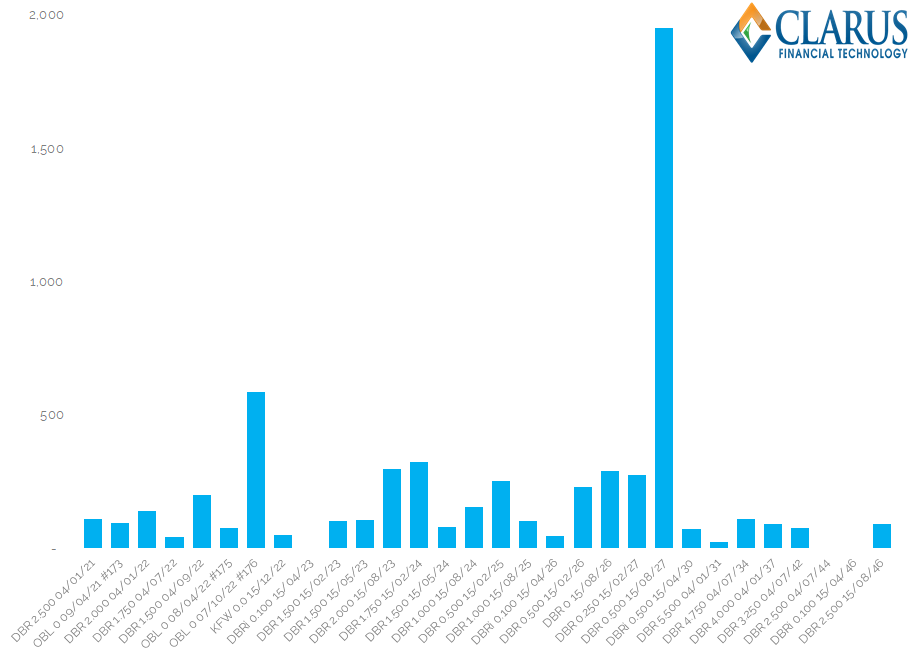
Showing;
- Nearly all “liquid” Bund ISINs traded (27 out of 30).
- The 0.5% 2027s traded 3.3 times more volume (~€2bn) than the second most traded Bund.
- Therefore, excluding the extremely liquid 10 year, every other ISIN traded an average of ~€150m over the week.
TRAX APA
Because I was on the website at 9am, I was also able to extract the first 1,000 “IDAF” records reported from TRAX for the week 9th-16th January. This caused me a degree of RSI (it’s a manual process) – let’s hope it was worth it. I’m not convinced there were “only” 1,000 ISINs reported on – my hunch is that I could only see the first 1,000 judging by time-stamps.
For Bunds, we saw the following volumes:
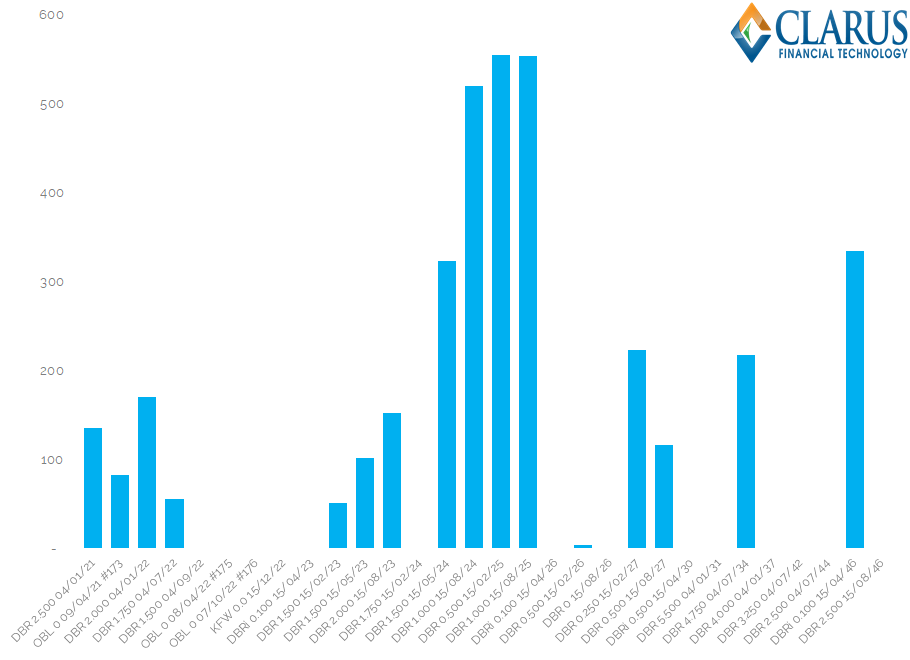
Showing;
- €3.6bn in volume.
- Only ~60% of the “liquid” ISINs had any volume.
- Activity is highest in maturities of 6-7 years.
Other Data
We are fortunate that Bloomberg is such a large cross-asset platform, providing a lot of transparency data. So far, they’ve also got a 62% market share in transparent Bund markets….
The TRAX APA looks promising for Credit….
Likewise the Nasdaq APA for Scandi credit….
But I expected a lot more transparent and usable data on German Bunds.
Is it just me? Let us know your feedback regarding public data from other APAs and MTFs in the comments below.