- Some MTFs provide weekly aggregated volume data under MIFID II.
- We examine Bloomberg’s EUR IRS data after the first week.
- Clarus data shows that out of a global market of €450bn, useable public MIFID II transparency data provides insight into €8bn of the total market. This is beyond disappointing.
- Dodd Frank data provides more transparency for EUR IRS markets than does MIFID II!
MIFID II – More Data
Last week’s blogs were extremely well received (and quoted in the FT). We should have been able to follow-up those blogs with a new series of blogs looking at weekly aggregated data.
Why? As per the Tradeweb website:
What does this mean?
- Every Tuesday at 9am, an MTF (or a Trading Venue) should make weekly aggregated volumes available to the public.
- We expected to be able to head to all MTF websites and get a weekly aggregated file of volumes per ISIN.
- So far, this has not been the case.
If anyone has found these aggregated files, please reach out to us.
Bloomberg MTF
Fortunately, we were able to grab the Bloomberg aggregated files. Finally – some data to work with! From the SEF market, we know that Bloomberg see a sizeable chunk of IRS volumes traded across their platforms, so this looks like a very promising start for MIFID data.
What does the data show?
- Weekly aggregated data for around 1400 ISINs.
- Of these, only 33 were Derivatives.
- Only 27 were EUR Interest Rate Swaps. 27!
Clarus Microservices
Needless to say, we don’t get the nice “Description” column from the data above in the raw file. No, this is all ISIN related remember. So, we turn to our Clarus Microservice:
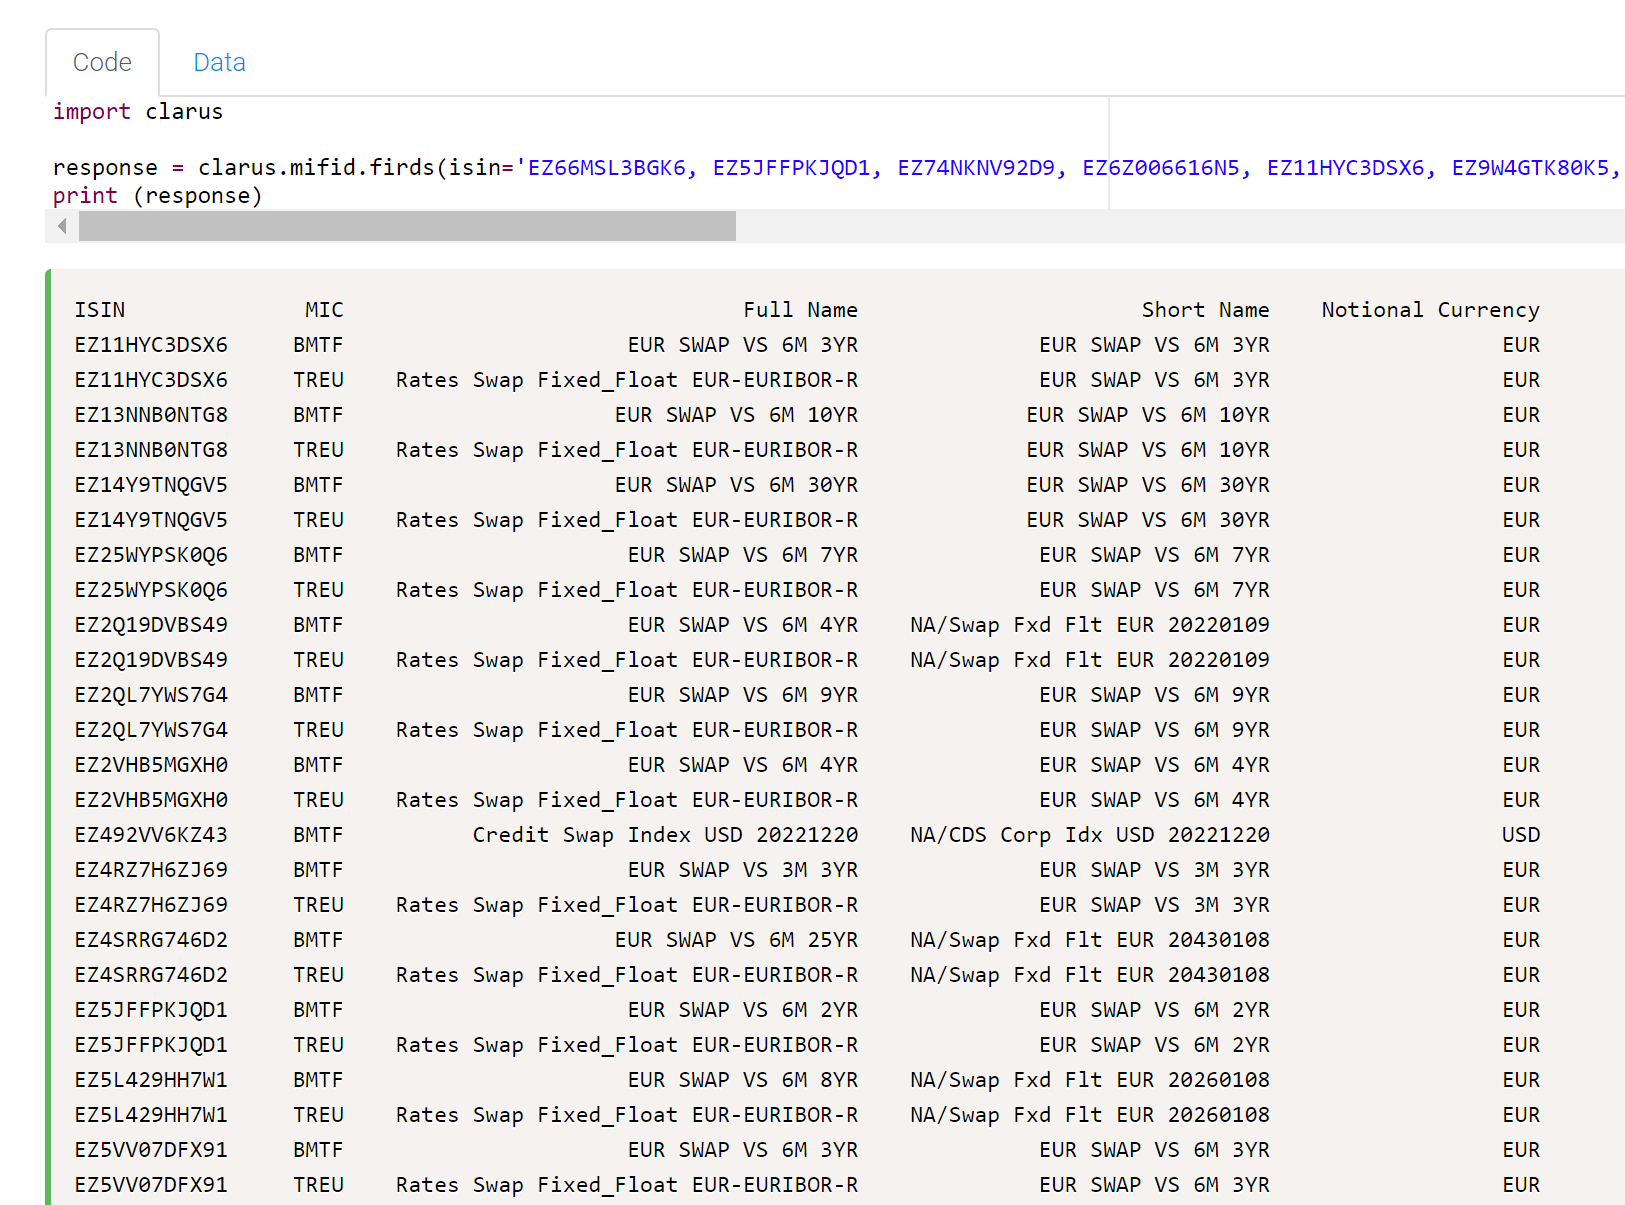
Our first Microservice for MIFID provides;
- The currency of the ISIN.
- The tenor of the ISIN.
- A short description of the product.
- The trading venues (via the “MIC” code) that have traded this ISIN.
Well done to Bloomberg (MIC code BMTF) and Tradeweb (TREU) for having consistent ISIN codes. It is baffling as to why the IDB MTFs have not submitted the exact same ISINs for trading as the D2C venues. But please read Amir’s blog as to why. There are likely teething problems this week as to how the ISINs are being created for IRS, including Cash vs Physical settlement, Tenor of the Index and Index names all to be ironed out. Why this wasn’t sorted last year is beyond me….
Bloomberg Volumes
For the weekly aggregated data alone, we see the following volumes in EUR IRS having traded across the Bloomberg MTF:
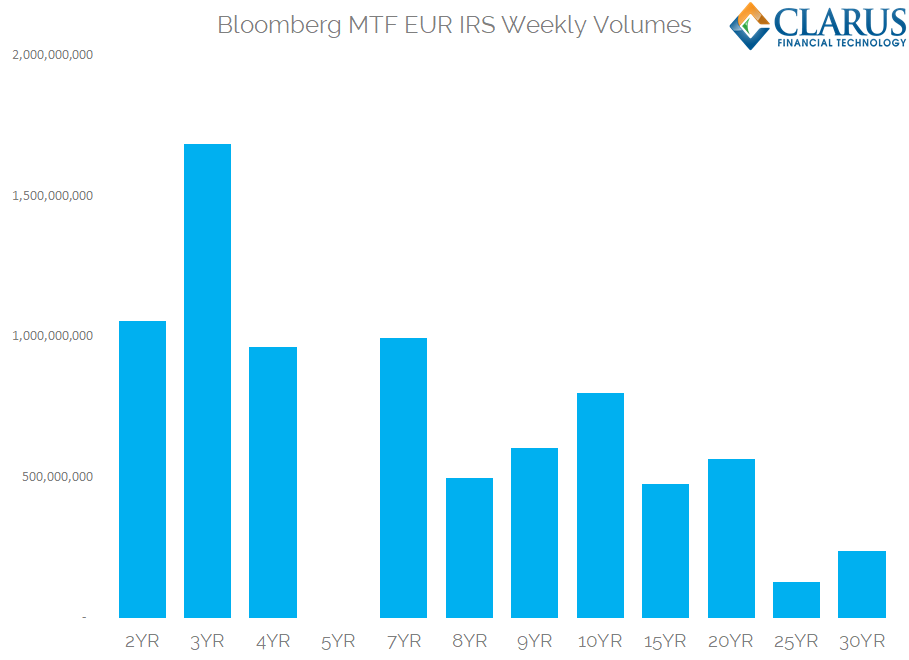
Showing;
- A total of EUR8bn in notional traded.
- This was across 12 different tenors.
- By notional, 3 years was the most active tenor.
- On a DV01 basis (a maturity-agnostic measure of risk), the most active tenor was 20 years.
- No 5 year trades. At all. Really?!
As per the Tradeweb disclosure, we can infer that there was more than one transaction in each ISIN. Remember that for Interest Rate Derivatives, the ISIN of a given tenor changes every single day. However, BMTF does not include a transaction count, so we do not know how many trades occurred in each ISIN.
BMTF vs BSEF
MIFID II data isn’t the only transparency data we have. Dodd Frank can now rightly hold its’ head up high as the gold standard for transparent data provision to the public. So of course we have to compare the Bloomberg MTF data to their SEF data. Let’s do this on a DV01 basis, so that we do not have any tenor skew. Source: SDRView.
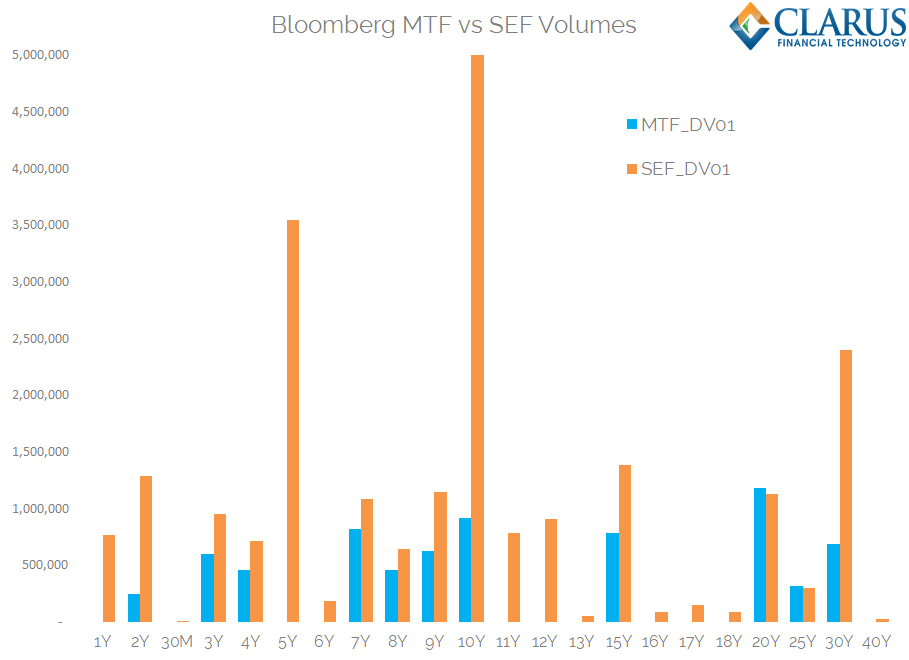
Showing;
- Total DV01 traded in EUR IRS on the BMTF (as reported for weekly aggregated ISINs) was €7.15m.
- Total DV01 traded across BSEF was €23.45m!
- In notional terms, €34bn traded across BSEF. Remember, just €8bn went across the MTF according to the aggregated data.
Data Perspectives
What is this Bloomberg MTF data providing us with in terms of the overall market? Because Clarus have a broad range of data products, we are confident that we know exactly how large the overall market is. Therefore, we can confidently state the following:
- Total cleared D2C EUR IRS market for the first week of January was €452bn (source: CCPView).
- Total traded in D2C EUR IRS on-SEF (i.e. under Dodd Frank rules) was €104bn (source: SEFView).
- Usable MIFID II data? €8bn.
“Transparency” and its’ caveats
What can we conclude from our first look at data for a European trading venue that makes data available to the public in a usable manner?
Not much.
Public transparency under MIFID II has been very loosely defined. It takes an intricate knowledge of the regulations to actually understand what is transparent and what is not.
In this simple exercise of analysing data from one trading venue, we must caveat that:
- These are weekly aggregated volumes per ISIN. But they are probably not the total aggregate volumes that traded in that week for that ISIN. To get that total we have to:
- 1. Sum all the volume of trades already reported within 15 minutes that were below SSTI and LIS thresholds.
- 2. Wait four weeks for any trades that had the full deferral period of four weeks applied.
- There are inconsistencies in the data. For example, the “To Be Cleared” flags for all of these trades are “FALSE”.
- We may be missing OIS trades vs EONIA.
In Summary
- After the first week of MIFID II, we have some usable transparency data for the European D2C EUR IRS market.
- However, we still have more data from SEFs than from MTFs. This is crazy.
- The European market for EUR IRS therefore remains opaque to the public.
- This data is falling well short of the goals of G20 reforms.
- On the plus side, we are beginning to make sense of the first wave of data. It can only get better from here, right?
- More analysis will follow – particularly for the bond data from Bloomberg. Watch this space.