- We update our analysis on NDF Clearing in 2019.
- We find that 20% of the overall market is now cleared.
- NDF volumes in Asian currency pairs have rocketed higher.
- Clearing volumes have reached somewhat of a plateau. Why?
NDF Volume Analysis
Finding up-to-date analysis on uncleared OTC derivatives is currently a frustrating job. The last BIS triennial survey is now over three years old, and we must wait until about October 2019 for refreshed numbers.
As we looked at last week, data on Notional Outstanding is fundamentally flawed, and is not a good way to measure current market activity.
We therefore have to take a look at other sources of information.
Fortunately, for FX markets we have other survey data to fall back on; namely, the Central Bank surveys of FX markets that are conducted every six months. As a five point summary of this data, I have written previously:
- The surveys are conducted in the UK, US, Japan, Singapore, Canada, Australia every six months.
- The surveys look at average daily volumes during a single month across a broad range of FX products.
- There is a publication delay of around 3 months.
- Being survey based, they are somewhat similar to the BIS Triennial Survey. The BIS survey is broader. The Central Bank surveys focus on the largest market counterparties for each local market.
- The results are not normalized. I found NDF volumes reported by the UK, US and Japan – but not by the other three centres.
The most recent survey data is now from October 2018. Okay, that is now six months ago, but when I cross-check versus Cleared NDF volumes in CCPView, it also coincides with a plateau in volumes of cleared NDFs in four of the major currency pairs:

Monthly Cleared NDF volumes in USDBRL, USDCNY, USDINR and USDKRW
Seeing as volumes in clearing are no longer increasing at substantial rates each month, reviewing the market as of October 2018 should be fairly representative of where we are now.
Central Bank Data
First off, from the Central Bank Survey data, how have overall NDF markets fared since April 2016?

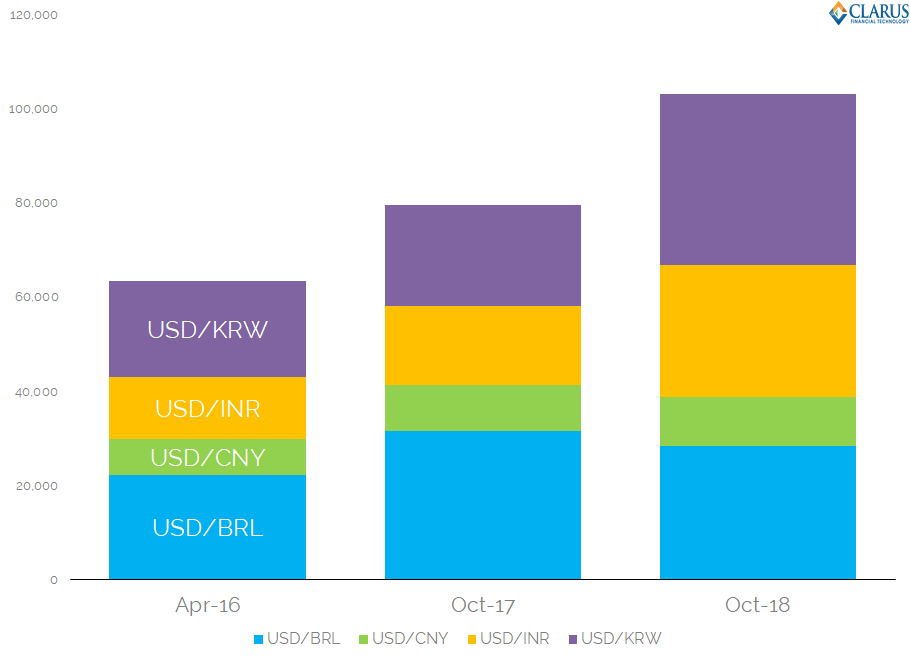
Showing;
- Truly substantial growth in NDF volumes since April 2016.
- NDF volumes saw particularly large growth from 2017 to 2018, increasing by 30%.
- Average Daily Volumes (ADV) topped $100bn for the first time in October 2018 across these four major currency pairs.
- Remember that these volumes include both cleared and uncleared – they are representative of the whole market.
- The growth in volumes has been strongly driven by increases in USD/KRW and USD/INR.
- ADV of USD/INR has more than doubled since April 2016.
There are, therefore, very strong tailwinds for NDF markets from the increase in total volumes. With that in mind, let’s take a look at Cleared volumes.
Cleared NDF Volumes
Average Daily volumes in Cleared NDFs since April 2016:

Showing;
- Continued growth in Cleared NDF volumes since we last looked at this analysis for October 2017.
- In the 12 months from October 2017, NDF cleared volumes increased by 22%.
- The fastest growing Cleared market was USD/BRL, seeing a close to 50% increase in Cleared volumes.
- This is in direct contrast to the USDBRL uncleared market, which actually shrunk during that time.
- Maybe unsurprisingly, the rate of growth in clearing of both USD/INR and USD/KRW did not keep up with the uncleared market’s growth. This is probably simply due to only a subset of the market having access to Clearing of NDFs at the moment.
Clearing Rates in NDFs
Finally, I wanted to update the analysis from last week and run it specifically for NDFs by currency pair.
So, across our four currency pairs, how much of each market is being cleared?

Percentage of NDF markets being cleared by currency pair
Showing;
- USD/BRL continues to see more and more of the market clearing. Over 20% of the overall market is cleared, and an even larger portion of D2D markets.
- Clearing growth has lagged the market in other currency pairs however.
- USD/INR continues to be the most mature cleared market, recording an impressive 25% + of the overall market. This is down by nearly 10% compared to October 2017.
- Across the market for these four currency pairs, 21% was cleared in 2017. That was pretty stable at 20% in 2018.
Of course, we have to caveat this massively and state that this data is all based on single-point in time observations. I guess another test will be when the BIS Triennial survey is updated and we can track the performance of these central bank surveys compared to that survey.
We continue to be frustrated at the lack of data for uncleared markets!
In Summary
- 20% of NDF volume was cleared in October 2018.
- We saw exceptionally strong growth in NDF volumes across the whole market between October 2017 and October 2018.
- Clearing volumes also rose during this time, although at a slightly slower pace.
- Since October 2018, Cleared NDF volumes have been very stable.