- The challenges in Emerging Markets recently, as well as finding different data sources for NDFs, prompted me to refresh our data on FX markets.
- Is Clearing still accelerating for NDFs?
- It looks that way.
- Clearing accounted for 16% of the total market, even before the recent 30% growth in Cleared volumes.
2018 Q1 and March in-particular saw all-time NDF records
NDF Clearing continues to break new records. As you may have seen via LCH:
.@LCH_Clearing‘s #ForexClear has reported a record first quarter: In Q1 2018, ForexClear cleared $4.3 trillion in notional, exceeding the previous record quarter (Q4 2017), by 31% https://t.co/BhRDjb1fRm
— LCH (@LCH_Clearing) April 6, 2018
It is interesting to see the data on a longer timescale. Yes, 30% year-on-year growth, but look at it compared to where we were two years ago:
Showing;
- Average monthly volumes in Q1 2016 were just $63bn.
- Average monthly volumes in Q1 2018 were $726bn!
- Volumes are now 11.5 times larger than two years ago. That is a huge shift in such a short period of time.
- What I cannot explain on the above chart is the abrupt drop in volumes during April. Was it because it was a short trading month?
April SDR volumes also show a drop in volume (for both Cleared and Uncleared). April 2018 saw 15% less USD-equivalent notional reported to SDRs than in March 2018. So this is not specific to Clearing – NDFs just didn’t trade as much during April. Why? Volumes so far in May (up to 18th) are already at 80% of April’s volumes with another 9 trading days to go – making April look surprisingly (suspiciously?) low. I was particularly surprised at this because there has been recent volatility in Emerging Markets. Maybe it’s just because we look at USD equivalents? Anyone with any more insight – please comment below.
Central Bank FX Surveys
Away from the “live” data, it’s good to be able to monitor Cleared volumes compared to the broader market. As you may have seen in our previous blog, we were pointed in the direction of the Central Bank surveys for FX. What I found can be summarised as:
- The surveys are conducted in the UK, US, Japan, Singapore, Canada, Australia every six months.
- The surveys look at average daily volumes during a single month across a broad range of FX products.
- There is a publication delay of around 3 months.
- Being survey based, they are somewhat similar to the BIS Triennial Survey. The BIS survey is broader. The Central Bank surveys focus on the largest market counterparties for each local market.
- The results are not normalized. I found NDF volumes reported by the UK, US and Japan – but not by the other three centres.
In terms of reconciliation, this paper from the Bank of England states that the BIS Triennial Survey and the six-monthly Central Bank surveys are broadly consistent. From a quick look at the data, I found that this was true when looking at the overall volumes for NDFs in April 2016 (BIS: $130bn ADV, Central Banks: $147bn ADV; Difference ~13%).
I do have problems reconciling the figures at a currency pair level.
This highlights the value in transaction-level public reporting. Any type of consolidation in results can lead to a loss of transparency.
We believe that in due course, public trade reporting across multiple jurisdictions will make these types of surveys for Derivatives markets redundant. We hope that saves the regulatory community a whole lot of work! We particularly need to see usable and accessible data under MIFID II for this to become a reality. Let’s hope the MTFs and APAs are listening.
Central Bank Data
As we saw in our previous blog, as Clearing (which is a post-trade process) becomes more important to the market, we find it tricky to gauge exactly how much of the market is being cleared as it changes our SDR data as well. These Central Bank surveys will shed more light.
First – how have overall NDF market volumes changed between April 2016 and October 2017?
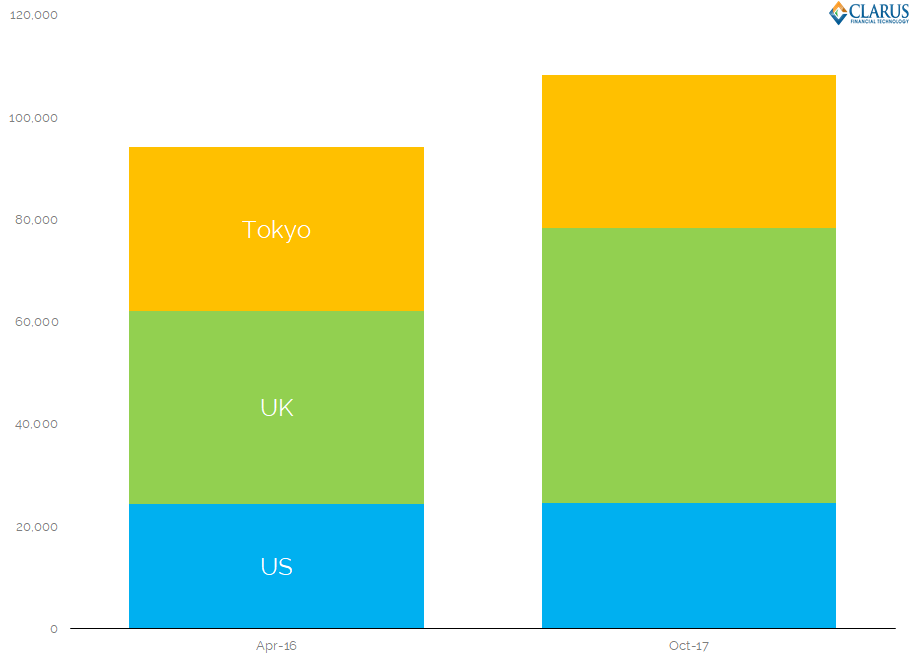
Showing;
- Average Daily Volumes, in millions of USD-equivalent, for NDFs traded in USD/BRL, USD/CNY, USD/INR and USD/KRW. These also happen to be four of the five largest currency pairs that are cleared, so it fits in nicely with our data. USD/TWD is the missing “large” currency pair here.
- Volumes in these NDF pairs increased by 15% in the 18 month period from April 2016 to October 2017.
- All of this growth was out of London. ADVs in these NDFs increased by 42% in London!
Looking at this data by currency pair:
 Showing;
- USD/BRL and USD/INR accounted for the growth in volumes.
- USD/BRL ADVs increased by 34%.
- USD/KRW ADVs increased by 28%.
From my “deep dive” into USD/BRL, I was under the impression that most volumes were transacted out of New York for this pair. That is still true ($17bn plays $14bn). But the gap has closed considerably between London and New York. London volumes in USD/BRL have increased from $8bn to $14bn. I can’t help thinking that some of that must be down to the shift towards dealer-to-dealer Clearing across the same time-period?
London also increased its’ share of Asian currency pairs, with 56% of volumes in the three Asian currency pairs now transacted in London. This is up from 45% in April 2016.
Clearing Data
How does that leave us in terms of Clearing? We can show the percentage of each currency pair that was Cleared in October 2017:
![]() Showing;
Showing;
- 10% of USD/BRL was cleared.
- 14% in USD/KRW.
- 21% in USD/CNY.
- 23% in USD/INR.
Overall, for these four currency pairs, 16% of volumes were Cleared. This assumes that 100% of Cleared volumes were reported to the Central Banks – which I think is fair. This analysis supports our previous analysis based on minimum clearing levels.
The only thing I would say is that NDF Cleared volumes have increased by around 30% since October 2017. April 2018 looks like a low volume month for NDFs generally, and yet will be the survey period for the next Central Bank data – another downside of relying on periodic surveys. We shouldn’t have to wait long (July?) for the next surveys to be published.
In Summary
- 16% of NDF volume was cleared in October 2017. This is now backed-up by two different methodologies.
- Clearing volumes have increased by around 30% since the last Central Bank FX surveys.
- April 2018 was a low volume month for NDF trading.
- It will be interesting to see how market volatility impacts the uptake of Clearing.