- Little has changed in FX NDF Clearing since our last update in March.
- From the data, Clearing is now a “business as usual” operation for a significant sector of the market.
- We further refine our data methodology by introducing an estimate of the errors inherent in our market share metrics.
- These errors look to be acceptably small, at just +/- 1.5%.
Open Interest in Cleared NDFs
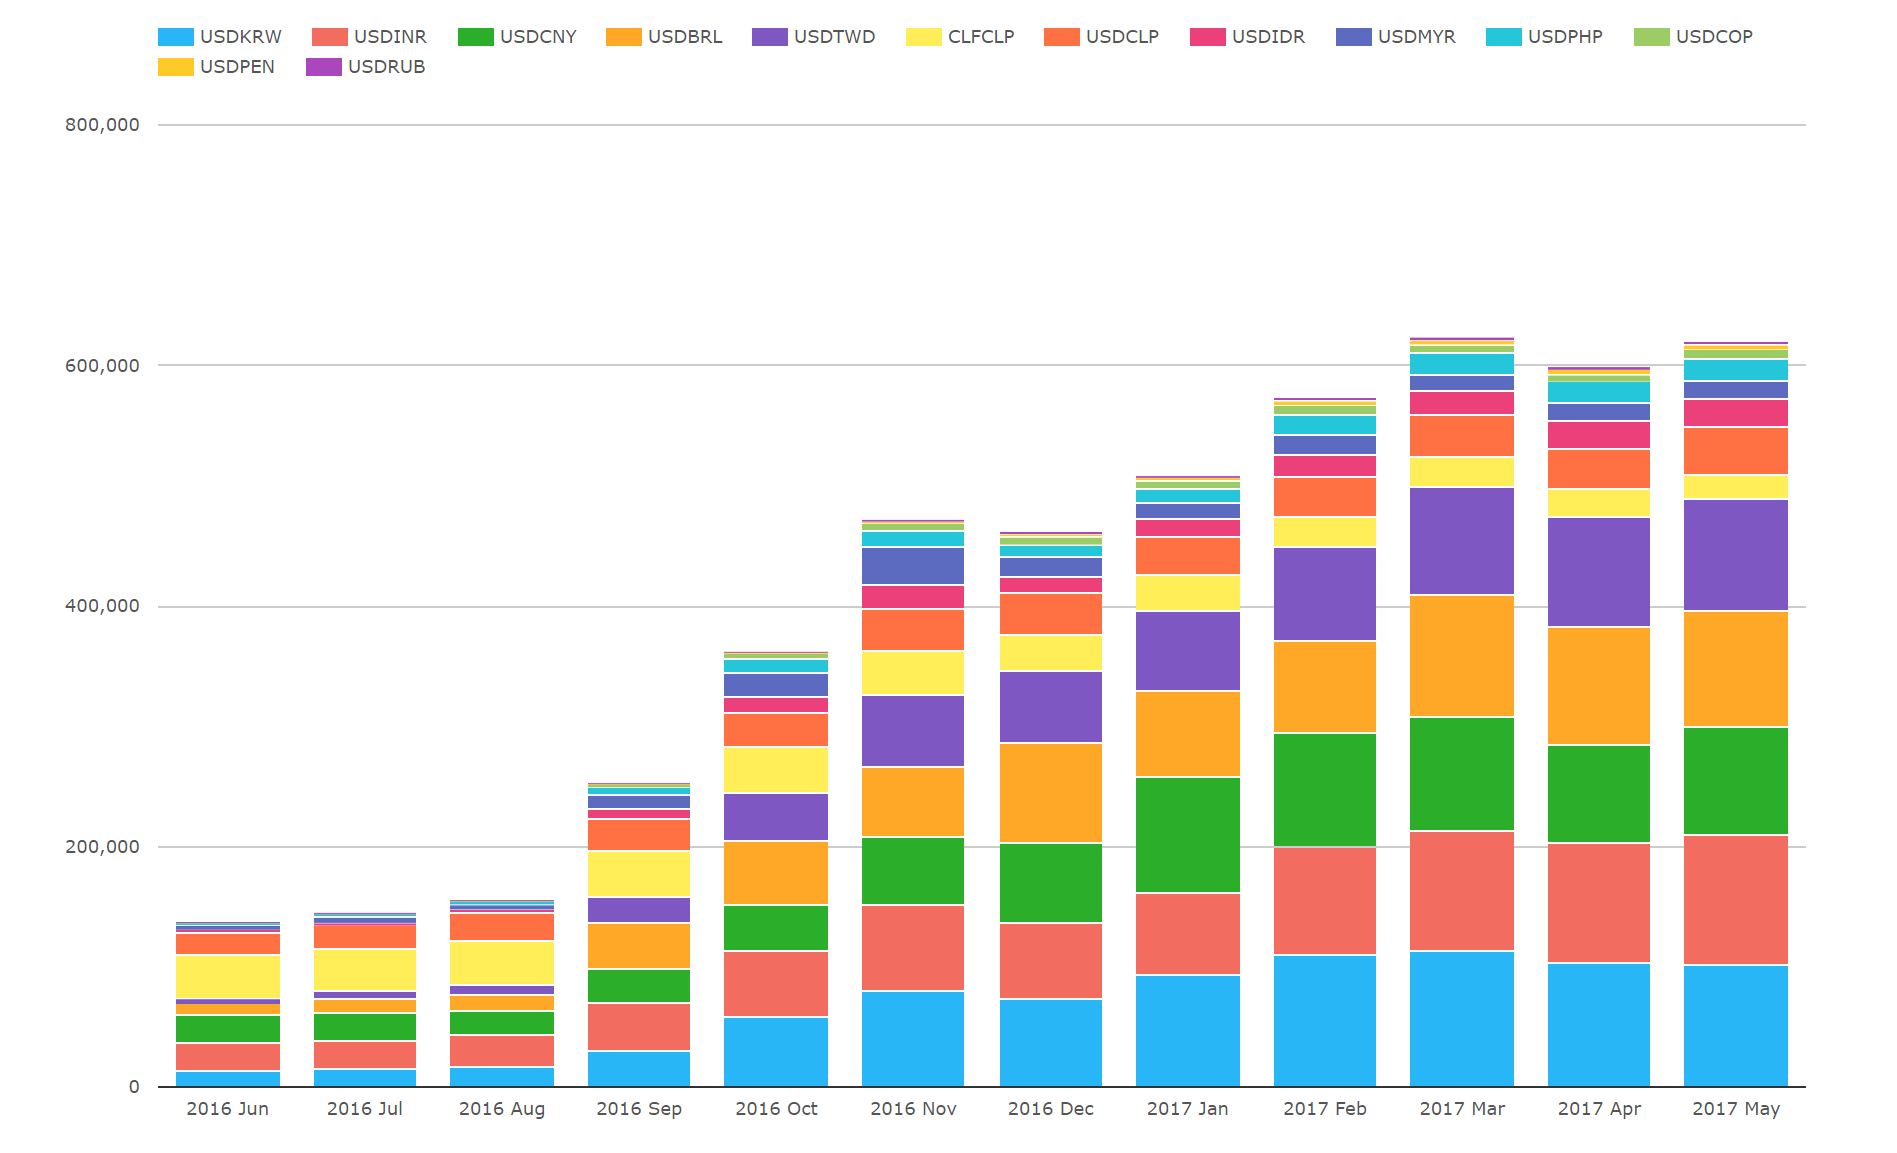
Since our previous update, we can see that Open Interest in cleared NDFs now resides above $600bn equivalent. This Open Interest has held at this level since March 2017. The growth phase that we have been previously blogging about may be beginning to transition towards a more mature market.
Due to the short-dated nature of NDFs, it is likely that large amounts of notional mature each month at the Clearing Houses. The steady open interest suggests that these maturing positions are being replaced by new trading, which is a reassuring sign for the Cleared market.
Volumes in NDFs
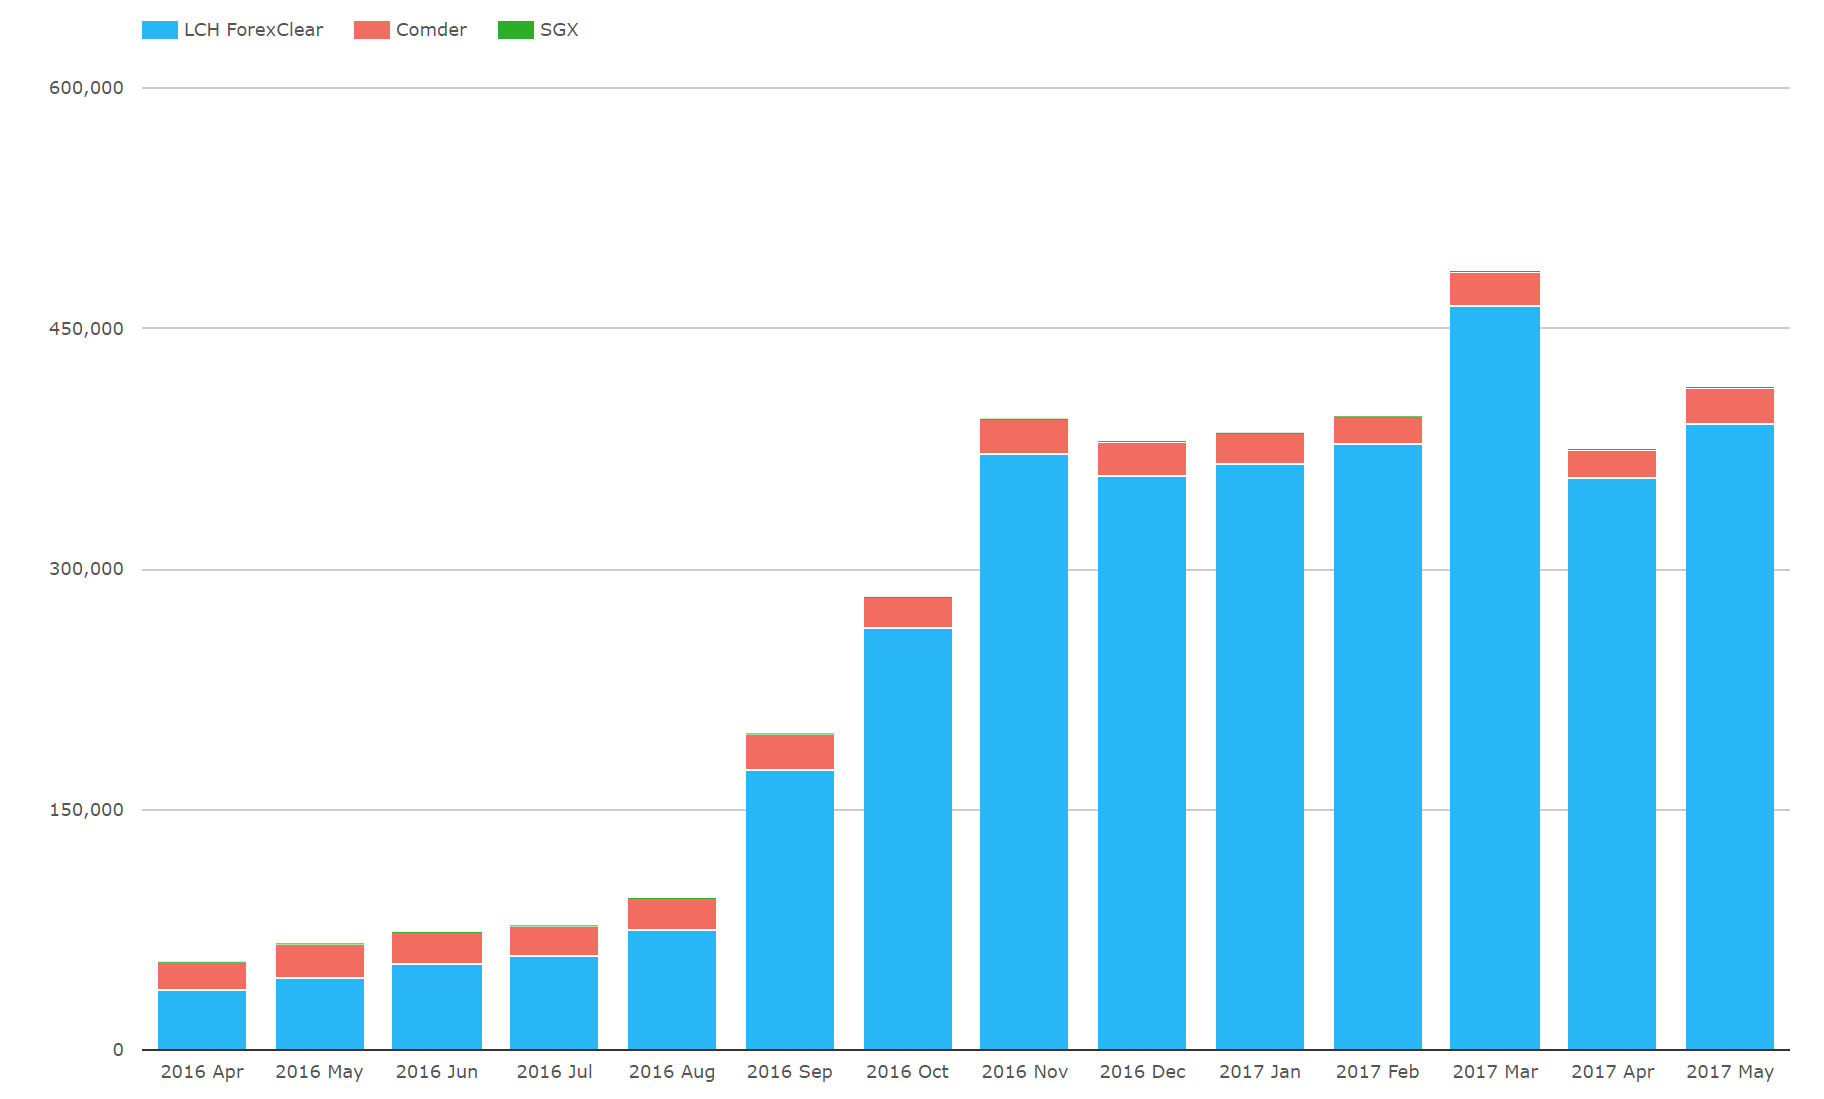
When we look at volumes that are being cleared (from CCPView) and/or traded by US Persons (SDRView), we find that market volumes have been static during most of Q2 2017:
Showing;
- Cleared volumes had a record month in March 2017, clearing nearly $500bn equivalent across the three CCPs.
- LCH ForexClear have a commanding market share above 95%.
- Cleared volumes have tailed-off slightly since March. This is consistent with the market activity reported in SDRView.
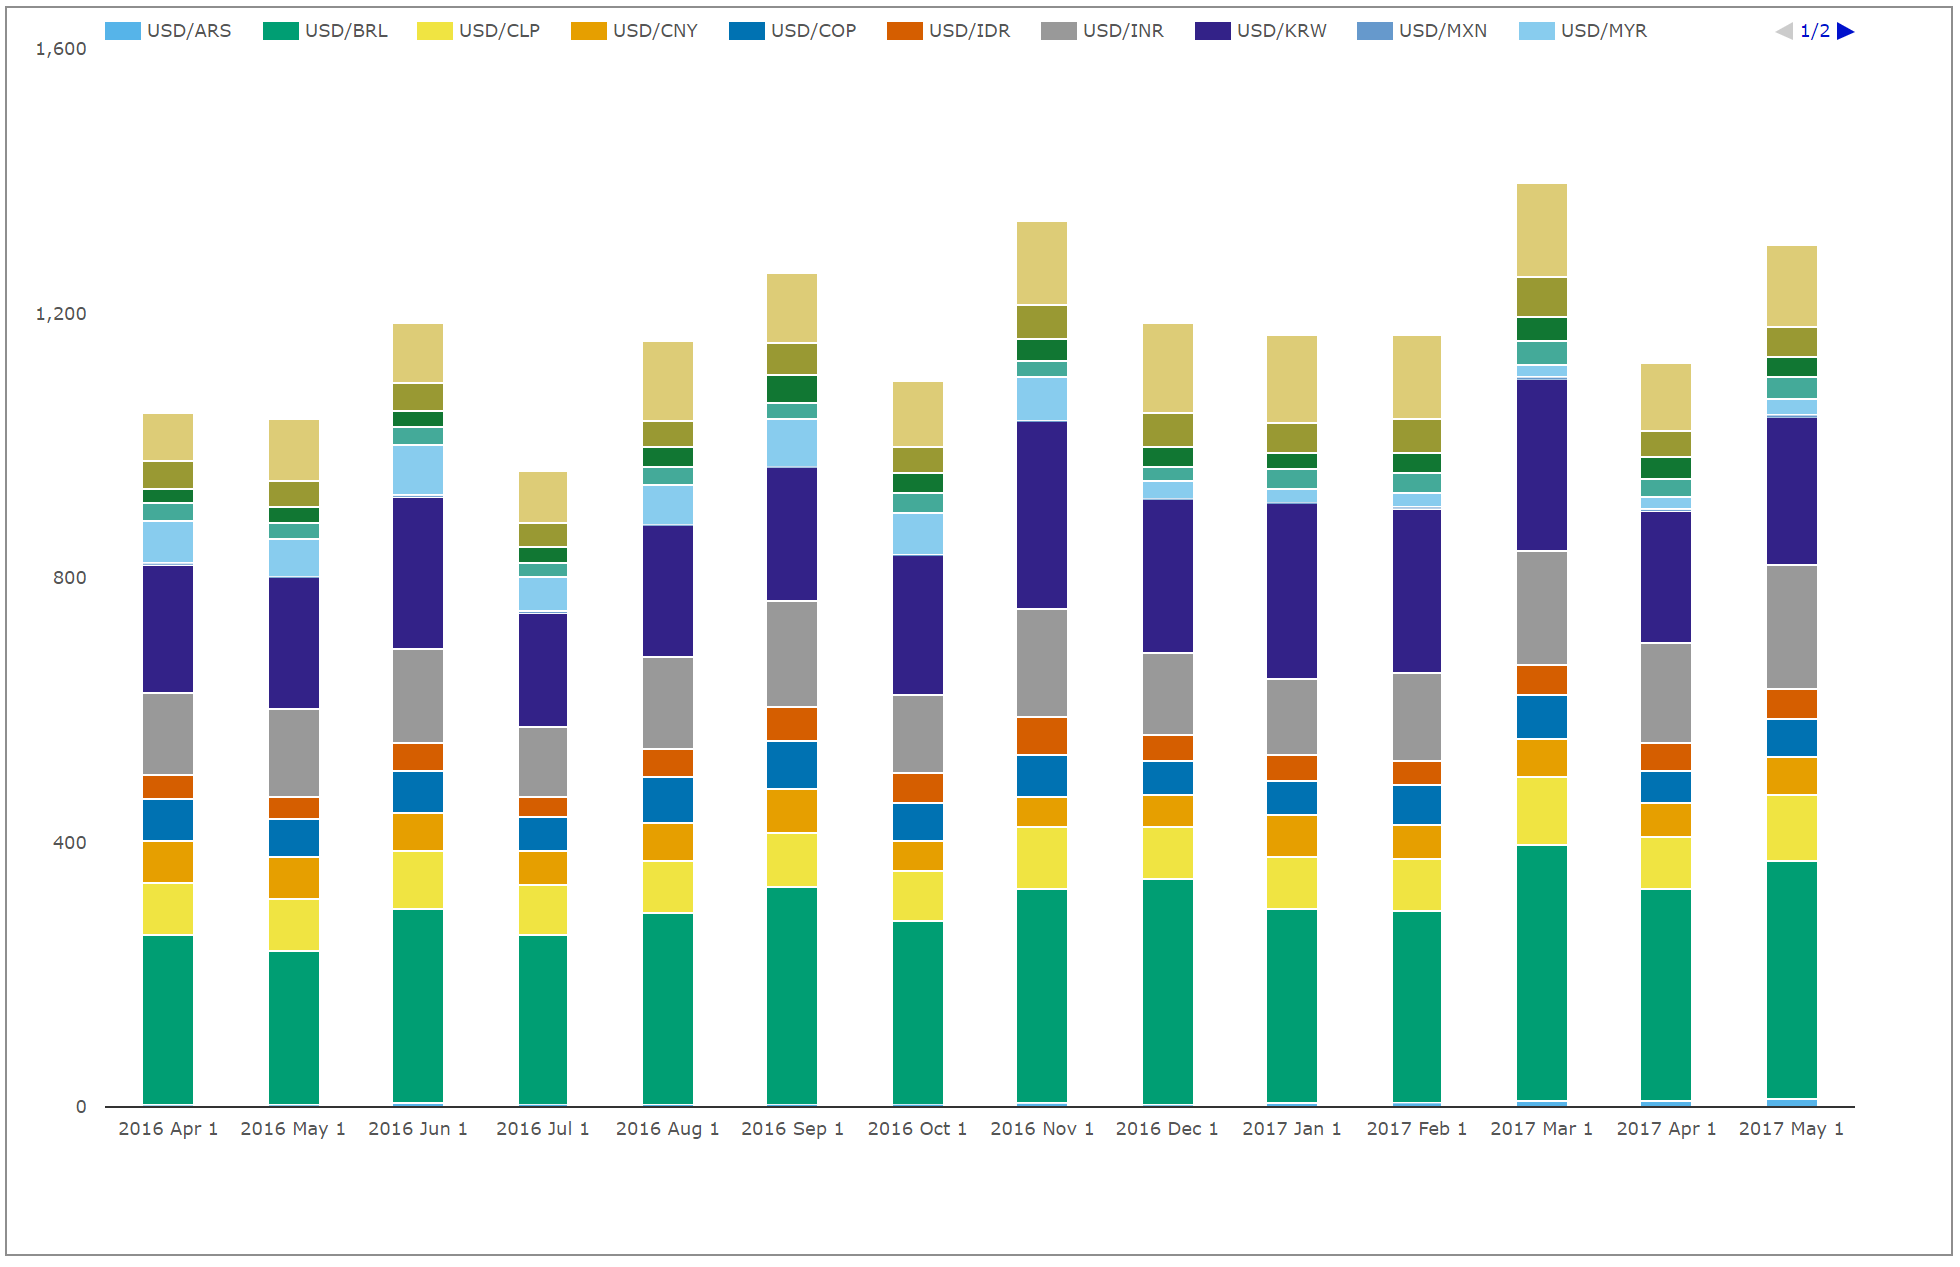
- SDRView data shows that NDF volumes have been fairly static recently, but have grown over the past 12 months.
- Volumes in the most recent 3 months have been 16% higher than the equivalent months in 2016.
In light of which, this could prove a bit of a dull blog this week! From the data, it looks like clearing is now a de-facto “business as usual” operation for a significant sector of the market. Similar to the early days of Rates clearing, this also appears to be a post-trade process.
Calibration
In light of fairly static market activity, I thought I would take the opportunity to calibrate our data. This is an important process as the data should be resilient across various calibration techniques.
- As Amir highlighted recently, Average Daily Volumes are widely used in futures markets and are a key measure of market activity.
- The BIS publish ADVs in their triennial FX survey, therefore they are an important benchmarking tool.
- However, given that the BIS data is only published once every 3 years and for only a single month, their ADV figure may also mask elements of the data – such as volume days with particularly large or particularly small volumes.
- I thought it would be interesting to therefore run our NDF volume analysis on total volumes cleared each month, rather than on Average Daily Volumes.
As previously, we have to contend with the fact that our SDR data does not cover the whole market. We estimate that SDR trade reporting accounts for 38% of total market activity. We therefore need to scale our SDRView (uncleared) volume data by this scalar to estimate total market activity.
Now to the (newly calibrated) data:
- We previously took all SDR data and assumed we captured 38% of the whole market.
- We know that CCPView captures 100% of cleared market activity.
- Therefore we have a particularly difficult calibration question to answer as Clearing becomes more prominent: Within the SDR data, how much of the Cleared data do we see?
- We would therefore remove this Cleared data before scaling the market by 38% to give us an accurate total market figure.
- For Rates trades, we could filter by the “Cleared” flag in the SDR records. However, for NDFs, Clearing occurs post-trade, therefore very few trades are actually reported to the SDRs as cleared:
- Due to this post-trade novation to clearing, the data that we collect from SEFs also fails to identify whether trades are being cleared or not. ICAP have flagged a few NDFs as cleared at LCH on their daily SEF reports, but this is rare.
Fortunately, we can identify our margin for error. We can do this by assuming that either:
- SDR data has no cleared trades. We therefore need to scale all of the SDR market by 38% to calculate overall market size.
- SDR data has 100% of the cleared trades. We therefore need to subtract the Cleared volumes from the SDR total, and only then scale by 38% to calculate total market size.
Using the above process gives us a range of estimates for each month of how much of the market is being cleared:
Showing;
- Monthly Cleared volumes of NDFs as the solid blue bars.
- Within each bar are two markers showing the maximum and minimum percentages of the overall market that we calculate as being cleared.
- For example, in March 2017, up to 16.9% of the overall market was cleared, whilst it could have been as low as 13.3%.
- In 2017, the gap between our high and low estimates has been less than 3.5%.
This calibration exercise therefore gives us an error range of less than 3.5%. Put another way, we could say that in May 2017, 13.6% of volumes were cleared (+/- 1.5%).
Dealer To Dealer Volumes
Should we perform the same analysis for our SEFView data (i.e. strip out all Cleared volumes before we scale up)? It is tempting, but ultimately I don’t trust this part of the calibration to be accurate, due to the much smaller sample size.
On average, around 35% of NDF volumes reported to SDRs have been executed on a SEF. This means that SEFView represents around 17% of the entire market. Whilst we can accurately propose that this is mainly D2D activity (due to the venues reporting NDF volumes) it is not fair to say that all cleared trades are therefore transacted over a SEF.
We can however strip out 38% of cleared volumes before scaling the D2D market. That sits more comfortably with me, but it does not really change our numbers. We still estimate that 35% of D2D volumes globally are being cleared:
In Summary
- New cleared volumes are still being transacted at an impressive rate, but Open Interest in cleared NDFs shows signs of a plateau.
- Consistent with our previous analysis, around 14% of the global market is now cleared.
- We are confident that this analysis is within a +/- 1.5% range of error.
- We estimate that 35% of D2D volumes are now cleared. This is consistent with prior estimates.
- We will continue to refine our analysis and closely monitor the volumes.
- Importantly, the transition to Clearing has not had any negative impacts on overall market volumes.