We have dedicated Risk Free Rate (RFR) views in most of our data products and today we complete the picture by adding these to SEFView, which aggregates daily volume from all Swap Execution Facilities. Let’s use this to see where SOFR Swaps are trading.
D2D Venues
The inter-dealer market trades SOFR vs FedFunds Basis Swaps, so starting with YTD weekly volumes in gross notional terms for these.

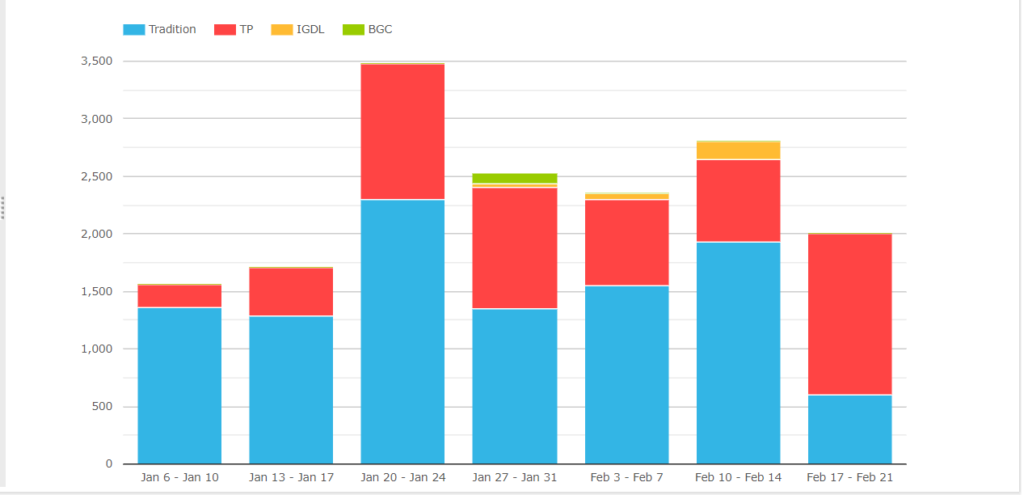
- Tradition the largest, with a cumulative $10.4 billion over the period and a weekly average of $1.48 billion
- TP next with a cumulative $5.7 billion and weekly average of $820 billion
- IGDL with $235 million and BGC with $100 million YTD.
Meaning that YTD market share is Tradition 63%, TP 35% in gross notional terms.
In DV01 terms this hardly changes; Tradition 63%, TP 33%, IGDL 3%.
Next let’s look at the tenor’s traded so far in 2020.

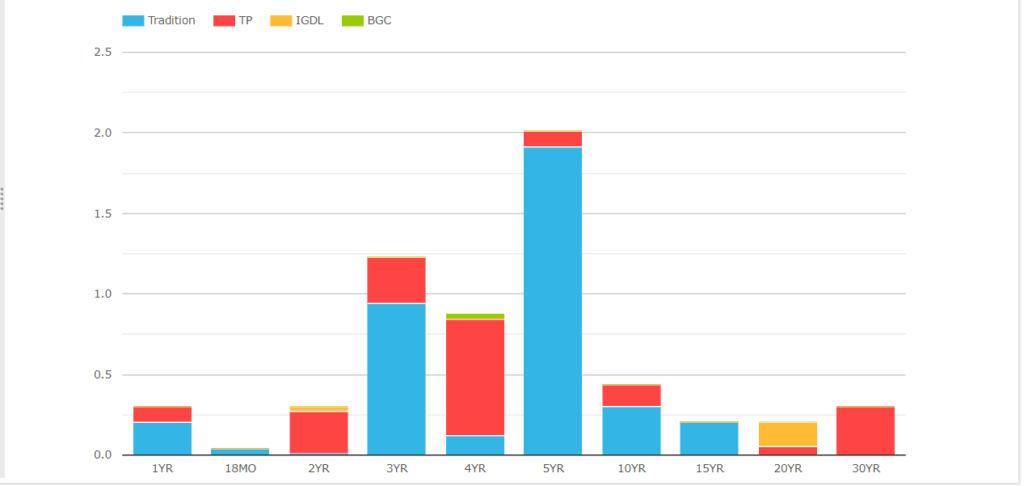
- Tradition with large volumes in 3Y, 5Y, 10Y, 15Y
- TP in 2Y, 4Y, 30Y
- IGDL in 20Y
A reasonable range of tenors traded.
Libor Basis Swaps
To get a perspective on these volumes, we can easily compare with all other USD Basis Swaps traded on D2D Venues, mostly Libor-Libor or Libor-FedFunds.
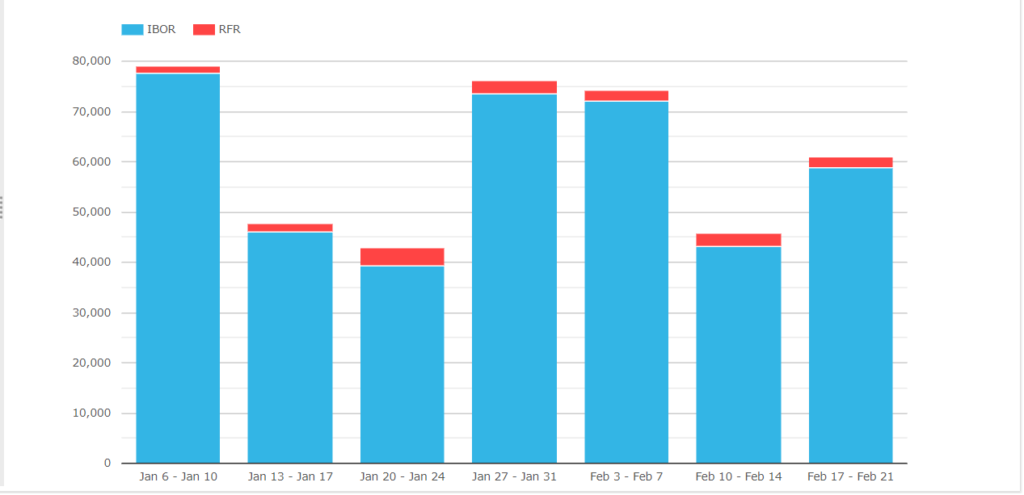
Showing that YTD the cumulative gross notional of SOFR Basis Swaps at $16.4 billion is dwarfed by the $410 billion of IBOR Basis traded on D2D SEFs.
A long way to go for SOFR Basis trading to hit meanigful levels compared to IBOR Swaps.
D2C Venues
Turning next to D2C venues, Bloomberg has volume in OIS Swaps, so SOFR vs Fixed.
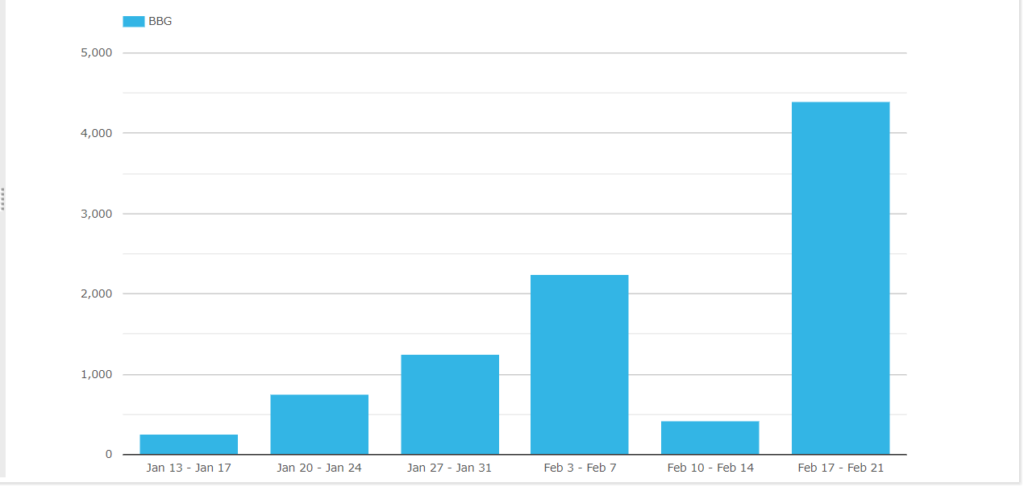
The week of 17-21 Feb with $4.4 billion, significantly higher than prior weeks.
And re-doing this to show the tenors that traded each week.
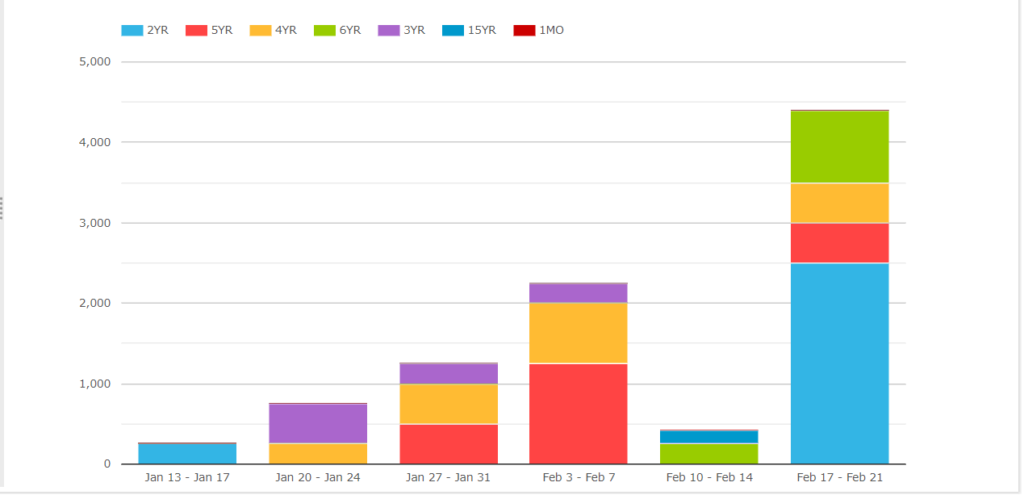
Showing 2Y, 5Y and 4Y the largest.
Major Currencies RFR vs IBOR
To end, let’s zoom out and look at YTD trading on SEFs, in six major currencies, split by Swaps that reference IBOR and those that reference RFRs. (Remember this is volume from US SEFs only, so US persons trading, but still representative of the relative volumes that trade globally.

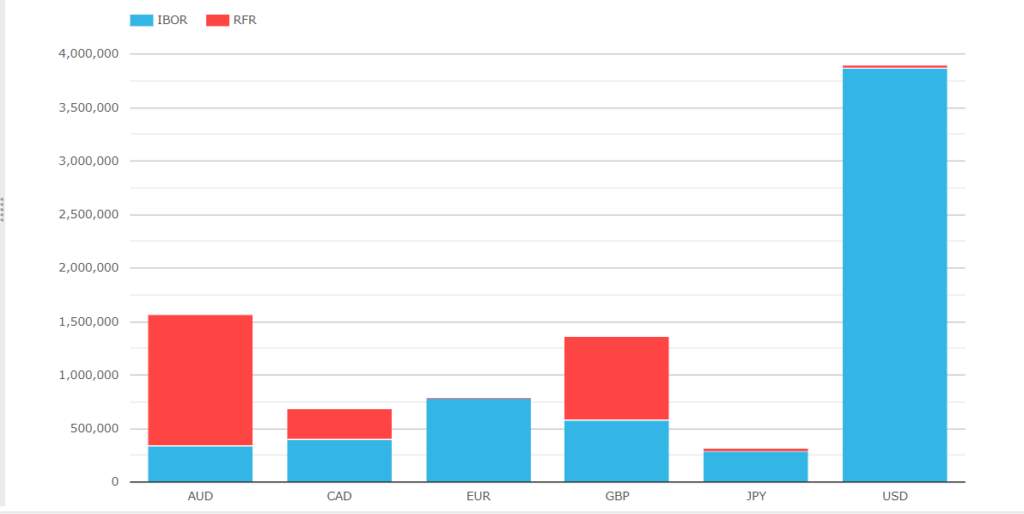
- AUD (AONIA) and GBP (SONIA) larger gross notional than IBORs
- CAD (CORRA) also standing out
- EUR (€STR), JPY (TONA) and USD (SOFR) tiny compared to IBORs
That’s It
That’s all I have time for today.
SEFView has new RFR views.
Comparing volumes of IBOR and RFR Swaps.
To get more detail and track progress, please contact us.