As it is now one year since my last blog on this topic, see Swaptions Trading on SEF Platforms, I thought I would take a look at Swaption volumes in 2014.
EUR & USD Swaptions
First using SDRView Res we can select trade counts per month.

Which shows that:
- Jan 2014 was the highest volume month
- Oct 2014 was the next highest
- On average 2,800 USD Swaptions were traded each month
- While 1,000 EUR Swaptions were traded (by US persons)
- So EUR was 30% of USD by trade count
Lets now look at gross notionals, first noting that 25% of USD and 17% of EUR Swaptions were larger than the capped size, both surprisingly high percentages, meaning that these numbers are understated from the actual volume.
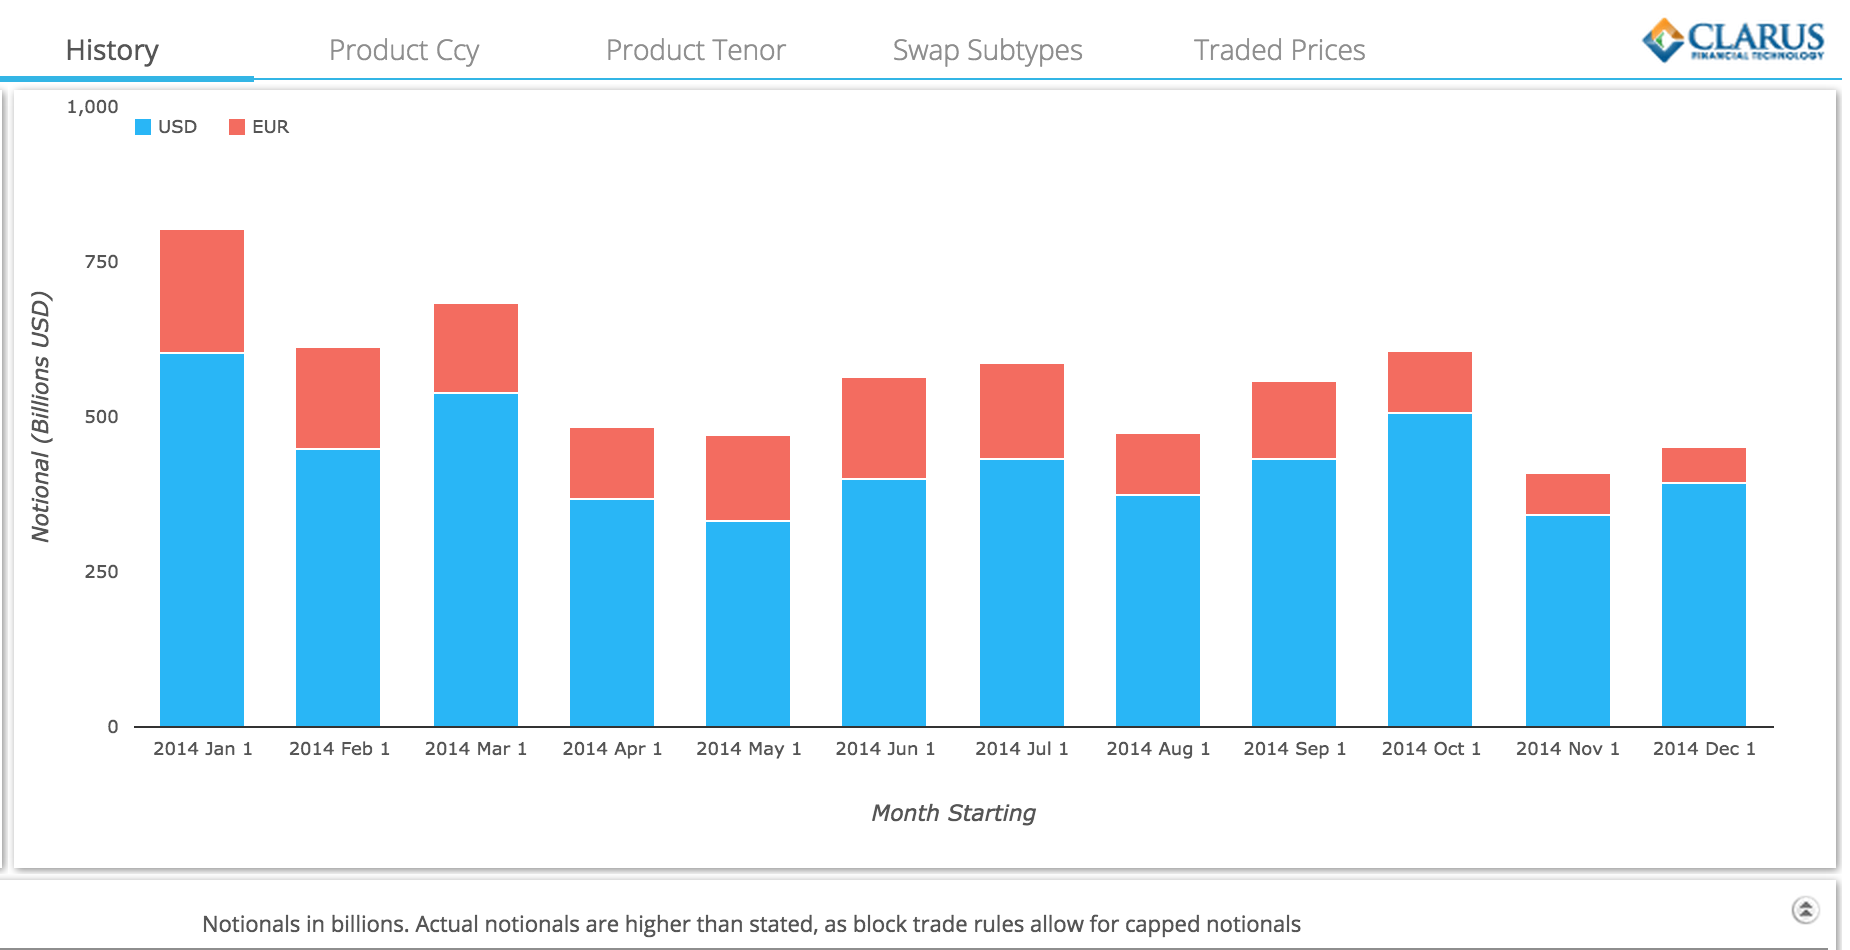
Showing a similar trend to the prior chart, with greater than $450 billion of USD and $130 billion of EUR Swaptions being traded each month.
On SEF vs Off SEF
Next lets breakdown Oct 2014 trade counts in terms of On SEF vs Off SEF.
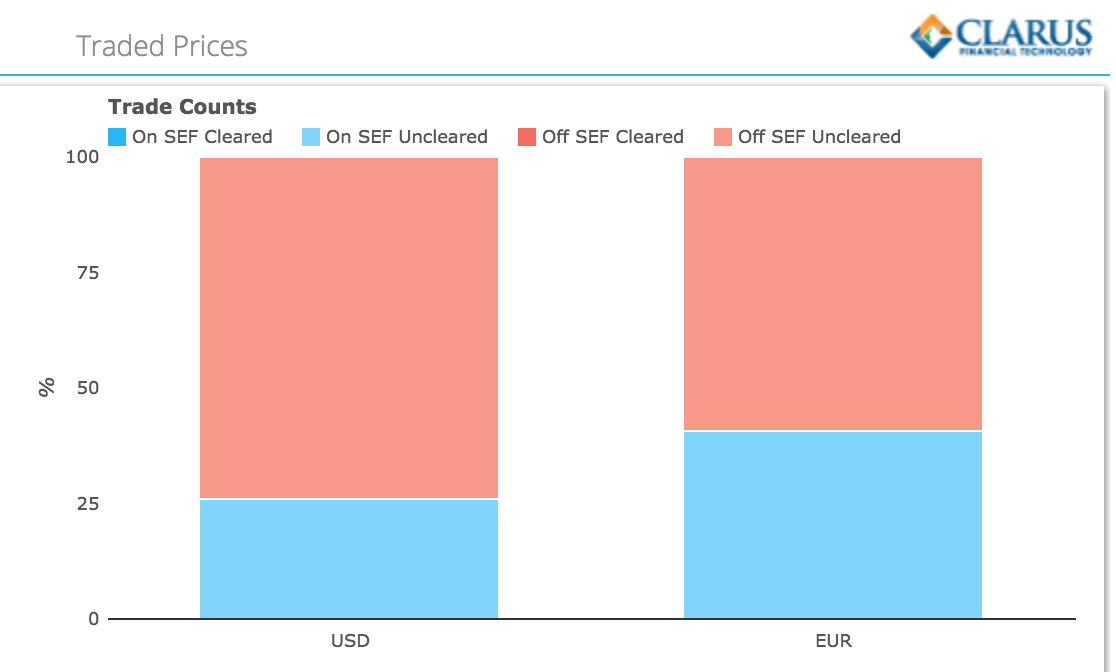
Which shows that:
- 26% of USD Swaptions were On SEF
- 40% of EUR Swaptions were On SEF
- Nothing is Cleared
SEF Market Share
Using SEFView we can look at each SEFs volumes in EUR & USD Swaptions:
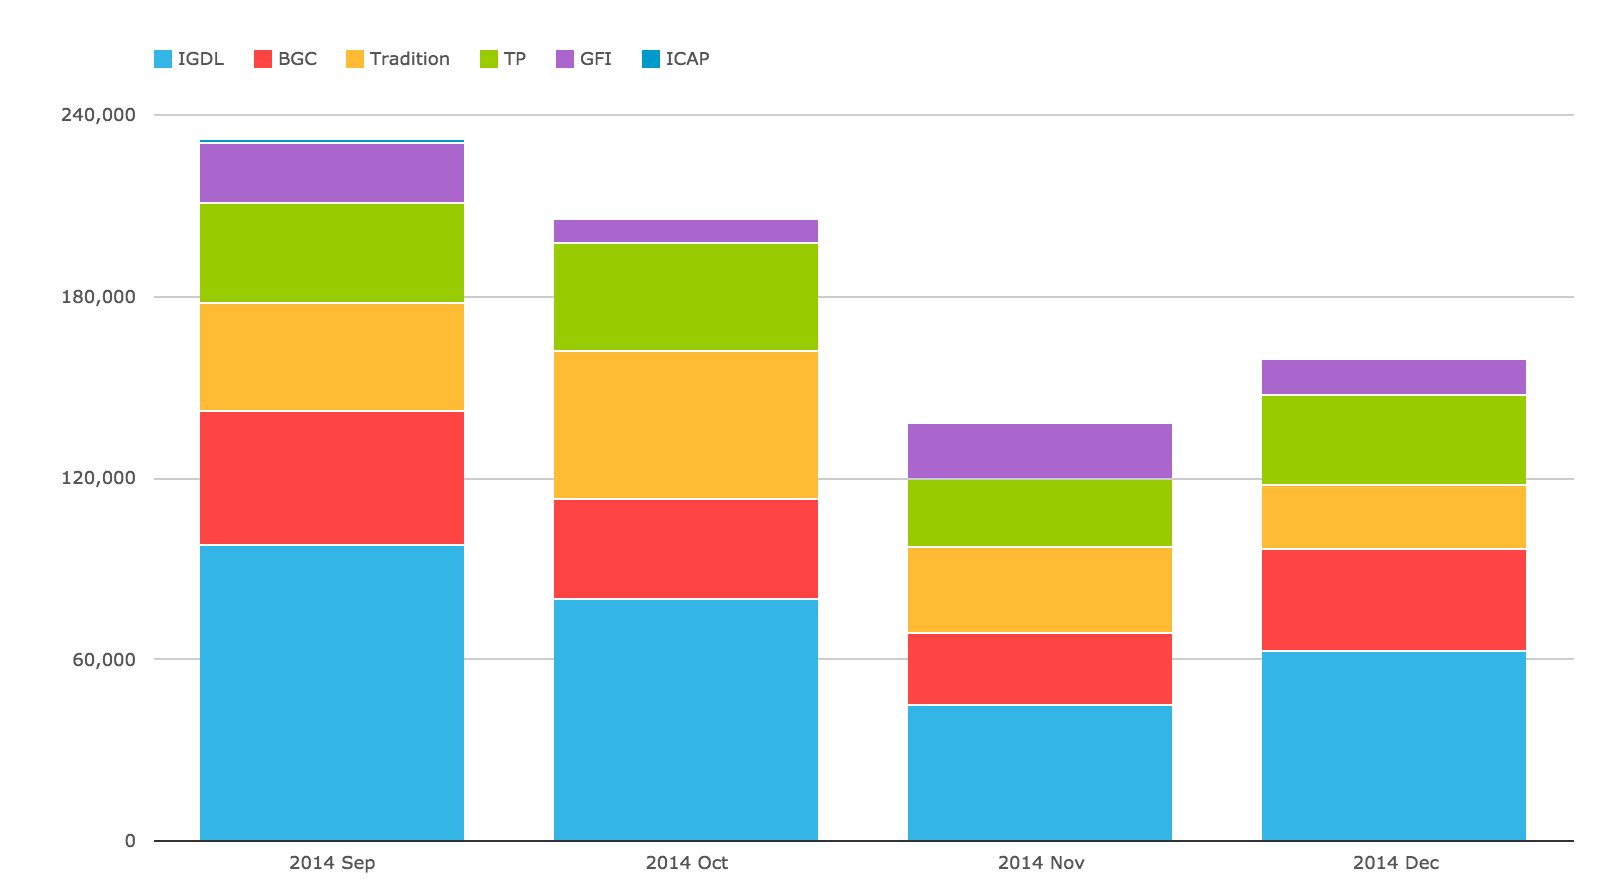
This shows:
- IGDL has the largest share with 39%
- Followed by BGC and Tradition, each with 18%
- Then TP with 16% and GFI with 8%
- (Neither Bloomberg or Tradeweb showing any volume)
Summary
So overall not much of note in 2014 for Swaption volumes.
Possibly we need the advent of Clearing and then MAT on SEFs to change this.
If that starts in 2015, I hope to do my next blog on Swaptions before another year has passed.