Following on from last week’s look at the volatility in EUR swaps markets, I wanted to switch my attention to see the knock-on effect in USD swap markets. So let’s look at some of the Technical Analysis that is possible via our suite of SDRView tools.
Is That an Outright or a Spread Sir?
One of the best parts of using SDRView Pro is that our users can filter out butterflies, spreads, spreadovers and compression from the data. That leaves us with a clean trade population of “outrights”. In theory, these are the pure price-forming trades that should drive any Technical Analysis in swaps.
Candle Charts
Given the extent of the sell-off in Fixed Income during June, I figured it was best to start simple. So below is a classic candle chart showing the price evolution month-to-date of 5 year USD Swaps:
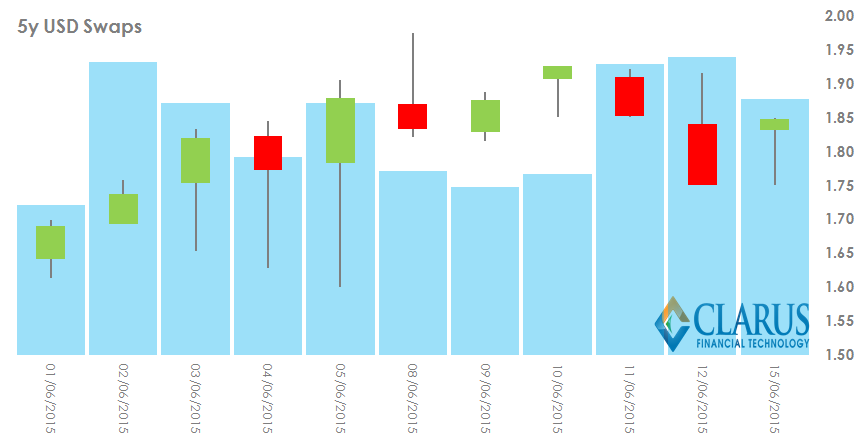
Showing:
- Volume of 5y traded as the blue bars
- The bottom of the candle “wick” is the daily Low price.
- The top of the candle “wick” is the daily High price.
- The top and bottom of the candle “body” are defined by the Open and Close prices each day.
- If the Close price is higher than the Open price, then the body of the candle is coloured Green (an “up” day).
- If the Close price is lower than the Open price, then the body of the candle is coloured Red (a “down” day).
By combining the price and volume data in one chart, we can quickly see that:
- Participation has been approximately equal in both up days and down days (more on this later).
- Of the two largest volume days, one occurred on an “up” day (green candle, 02/06/2015) and one occurred on a “down” day (red candle, 12/06/2015).
- The “quietest” days are typified by low volumes and short candle “wicks”. This means that the daily range of prices from High to Low (and Open to Close) was narrow.
- The 2nd June was unusual in seeing a very narrow range in prices (small candle) and yet very healthy volumes.
We can also turn our attention to 10 year USD Swaps and create a similar chart. This is possibly an even more appealing prospect, with 10 year swaps seeing 1067 trades month to date, compared to 665 in 5 years.
Here we see a different story to 5 years:
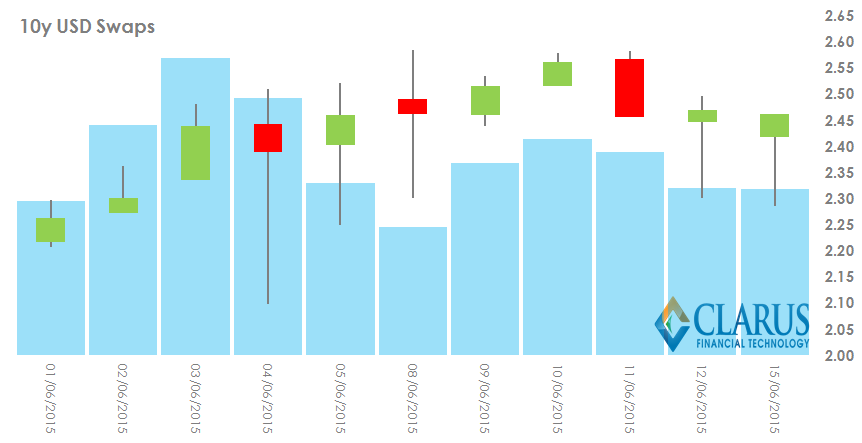
- Three of the top four volume days occurred on “up” days – i.e. when the candles are green.
- There isn’t the same consistency of shorter candles corresponding with lower volumes. Are there more “off-market” trades being reported in 10 years?
- Volumes did not pick-up towards the end of last week/start of this week like they did in 5 years.
- The move lower in 5 years on the 11th seemed to lead to healthy volumes on the 12th, whilst this is not seen in 10 years. This may suggest that markets are sensitive to price around the 1.90% level in 5 years, but not to the 2.50% level in 10 years.
Volume at Price
We can extend that final idea by looking at the Volume at Price graphs for this month. Below is a chart for 5 year Swaps that adds up the volume traded in 1bp price increments. In addition, I have used the previous days Close to assign each trade as either an “Up” trade or a “Down” trade:
- An “Up” trade occurs if the price is higher than the previous day’s close.
- A “Down” trade occurs if the price is lower than the previous day’s close.
5y USD Swaps
We see the following two charts for June 2015:
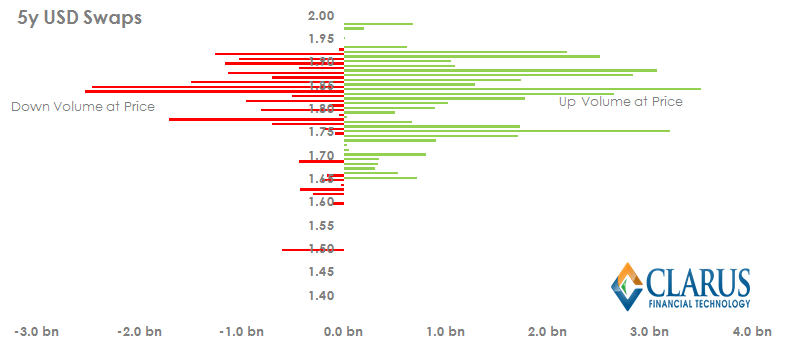
Showing:
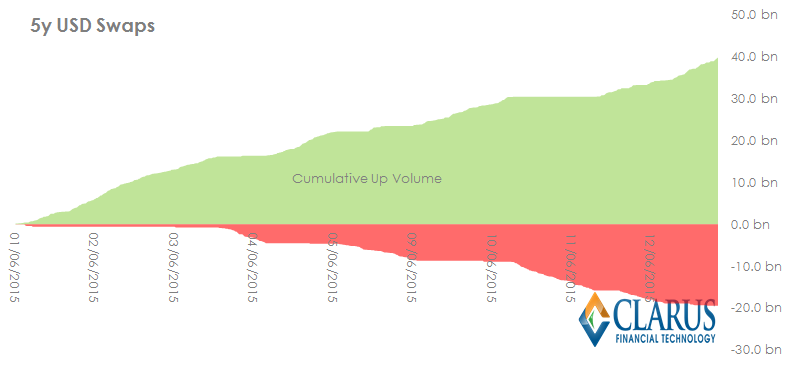
- The lower chart shows that 5y USD Swaps have seen over twice the volume trade when the Change on Day has been positive (so-called “up volume”), than when it has been negative (“down volume”). Remember that our sample includes 7 green candles versus 4 red ones, so this is not hugely surprising.
- “Up Volumes” have actually been greatest towards the top of the price range. Witness the large number of long green bars around 1.90%.
- “Down Volumes” were more concentrated in the middle of our price range at prices less than 1.85%.
- There is a disequilibrium between Up and Down volumes above 1.90% in price, where both the length and number of long green bars is greater than the red bars. This is surprising as our candle chart would suggest markets only spent a limited time above 1.90% this month. We saw only one Close above that level.
- Compare this to the equilibrium that seems to exist at 1.85% where the length of both green and red bars is more balanced.
- To my mind this means that 5 year swaps need a decisive break in price above 1.90% to sustain a move towards higher rates.
10y USD Swaps
Switching to the longer maturities, we see a different picture:
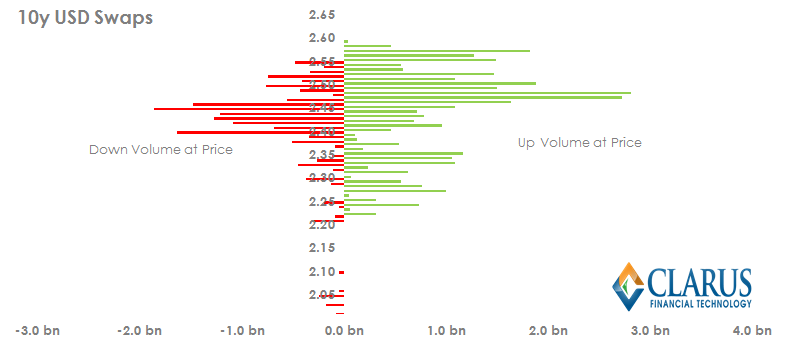
I have omitted the cumulative volumes chart as it shows much the same as five years – namely that the up volumes are 208% larger than down volumes. Given we only have 3 red candles in our sample period, we may have expected an even larger ratio for 10 years. However, the Volume at Price chart explains why:
- The long green bars are all concentrated at the top of the range and above the longest red bars.
- This suggests that a break higher in price has been successful and that buying pressure is able to counteract selling pressure at these higher prices.
- Judging by the length of the green bars, the key price level seemed to exist somewhere between the 2.45% and 2.50% ranges.
- Our last three closes in the sample period were all above 2.45% and the 10 years did not follow the 5 years lower on the 12th June (green candle in 10 years versus red candle in 5 years).
- Therefore, it appears that 10 years is safe from downward pressure so long as levels above 2.45% are maintained.
- Volumes may not support a move either way until we are well and truly clear of this level (2.45%) as the capital has now been deployed. Hence, the volumes in 10 years have declined relative to the 5 year activity during the last 3 sessions.
That’s it folks!
As with any Technical Analysis, other findings are also possible. However, as an overview of what is possible using the Clarus SDR products, I will leave it there for this week.
And of course continue to monitor the price action around 1.90 in 5s and 2.45 in 10s!