- We calculate the average maturity of USD IRS traded across SEFs.
- Over the past 3 years, this average maturity has meaningfully increased.
- This maturity extension has been seen on both D2D and D2C venues.
- The activity across D2D venues suggests that dealers continue to hedge the bulk of client trades with swaps themselves (as opposed to futures, cash bonds or other off-SEF instruments).
- The maturity mismatch between D2D and D2C venues has remained consistently small despite this increase in underlying duration.
SEFView Data
When I look at data for our markets, SDRView tends to be my first port of call. It is the most transparent source of data and allows us to run all types of analysis as trades are reported. However, as we acknowledge every month in our Swaps Reviews, the individual transactions are capped at the reporting threshold. It is therefore useful to look at SEFView as well.
The analysis I wanted to look at this week could easily be affected by very large trades. We are going to look at the Average Maturity of all USD Fixed-Float Interest Rate Swaps. These averages can clearly be affected by large trades over the reporting thresholds. Fortunately, SEFView data is not capped and includes maturity data that allows us to calculate the DV01 on each SEF.
Total DV01 Per Month
First off, we define the data set we are going to use. We’ll look at the largest market – Fixed Float, USD interest rate swaps.
Showing;
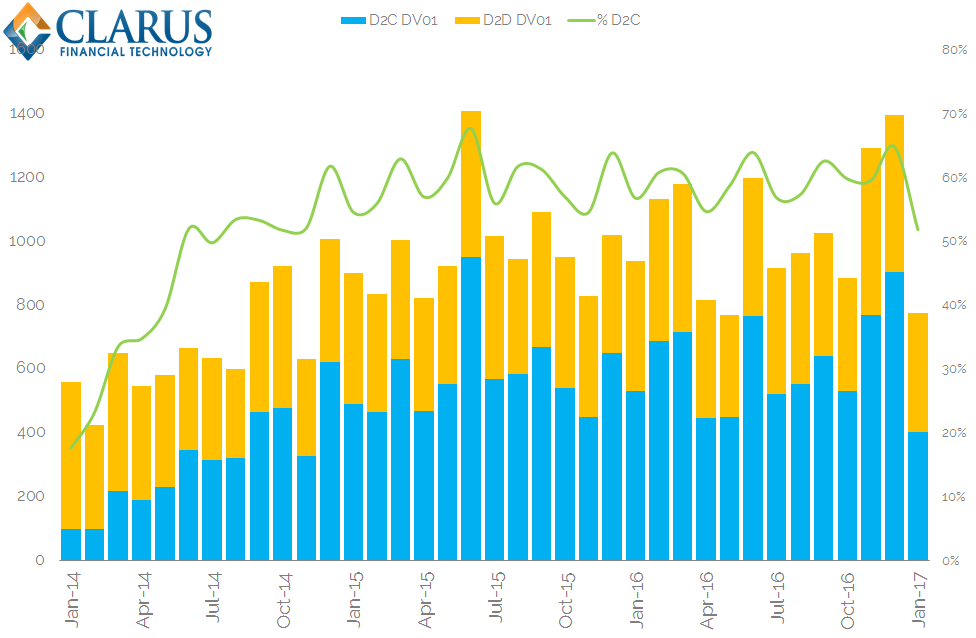
- The total DV01 of USD IRS traded each month across all SEFs.
- The volumes are split into D2D (orange) and D2C (blue) venues.
- The green line tracks the share of D2C trading. This was at 65% in December 2016, our last full observation month.
- DV01 traded across the SEFs has increased from less than $600m per month in January 2014 to nearly $1.4bn in December 2016.
- The proportion of D2C trading that occurred has increased over time, but the sharpest increases were seen during 2014 rather than recently.
Average Duration
Using DV01 as our measure, we can calculate the volume-weighted average maturity of trades across each SEF. We can do this on a daily, weekly, monthly etc basis. We call this the Average Duration.
Let’s take a look at the trends in Average Duration. First – a high level monthly chart across the whole market:

Showing;
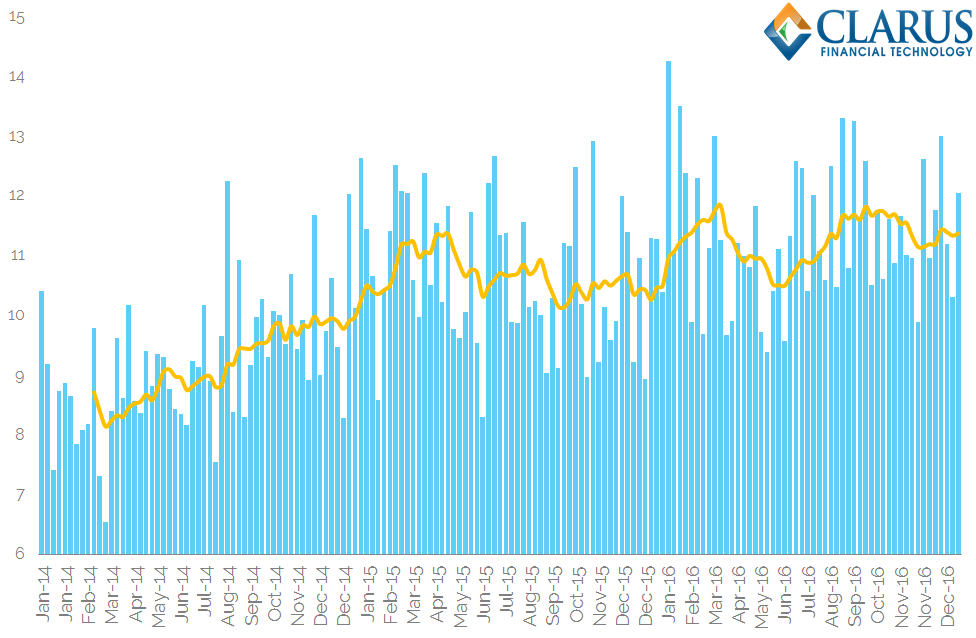
- The shortest Average Duration was back in Feb 2014 at 7.8 years.
- This has increased across the whole market in the past 3 years.
- In Dec 2016, the Average Duration was 11.8 years. This is the second highest reading we have had in the time-series.
- As we can see from our volume charts, overall volumes have increased over this time period as well.
- Market impacts aside, increasing volumes and increasing duration should at least spell good revenues for the SEFs!
Average Duration by Activity
Over the past three years, SEFView data therefore suggests an extension in duration across the market as a whole. Let’s see if these changes are consistent across the data series.
First – the same time-series on a weekly basis with a ten week rolling average:
Showing;
- Exactly the same data as the previous chart, but this time aggregated on a weekly basis instead of monthly. I have also included a ten-week rolling average to show a longer period of aggregation.
- No matter how we cut the data, the extension in average duration is clear.
- The longest 5 weekly durations were all during 2016.
- The shortest 5 durations were all during 2014.
- So not only are averages moving higher with time, but the tails (the very short weeks and the very long weeks) are also higher.
- Therefore, the data offers a sure sign that behaviour is changing.
Let’s now look at this data by venue type – Dealer-to-Dealer (D2D) and Dealer-to-Customer (D2C) behaviour.
Showing;
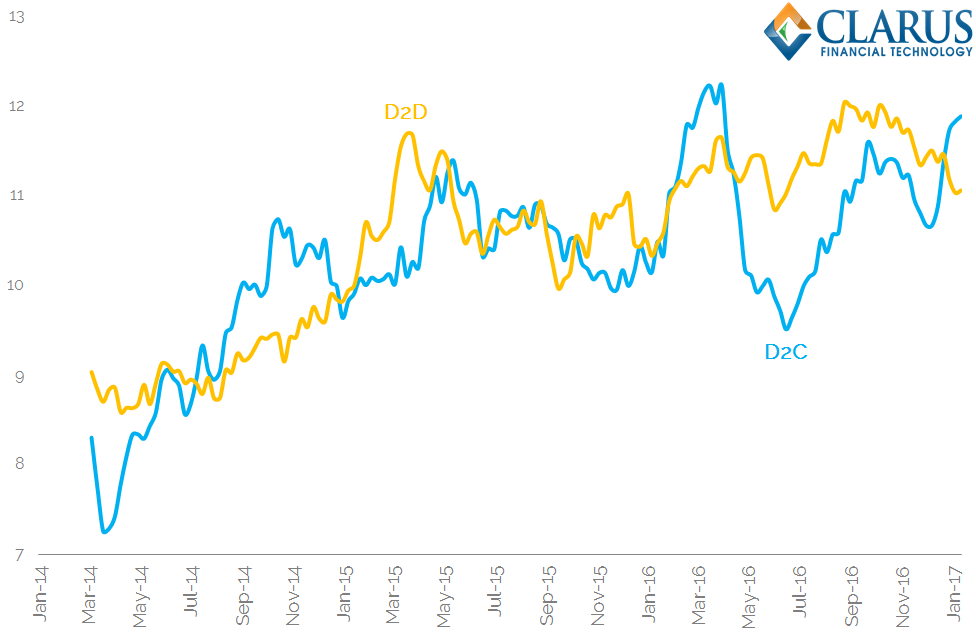
- The rolling 10-week Average Duration for D2D platforms versus D2C platforms.
- The increase in both time-series is clear.
- Interestingly, the average duration of D2C trades first increased noticeably in Summer of 2014, before coming back towards the D2D average (which was slowly climbing).
- Whilst the D2C time-series is more volatile, the two are clearly following the same trend higher across our observation window.
Agency Execution and Differences in Hedging Behaviour?
I wanted to analyse the differences between the two time-series in more detail. I was following a few of these thoughts:
- If dealers take less risk, the two data-sets should become more correlated over time as dealers increasingly offer agency-type execution models.
- If clients require a meaningful extension of maturity, liquidity may be difficult to source for ultra-long trades on-SEF. I’m just not sure how meaningful “on-screen” liquidity is for long swaps right now. Pre-SEFs, it could be ephemeral even at the best of times.
- We may observe D2D markets in a status-quo on-SEF. This could suggest that some of the longer maturity stuff is trading off-SEF.
- Dealers may choose to hedge risk in different ways – for example with futures. Again, this changing dynamic could be inferred by actually seeing no change in the D2D time-series on-SEF.
Therefore, let’s look at the average maturity mismatches in the time-series data between D2C and D2D SEF venues on a monthly basis:
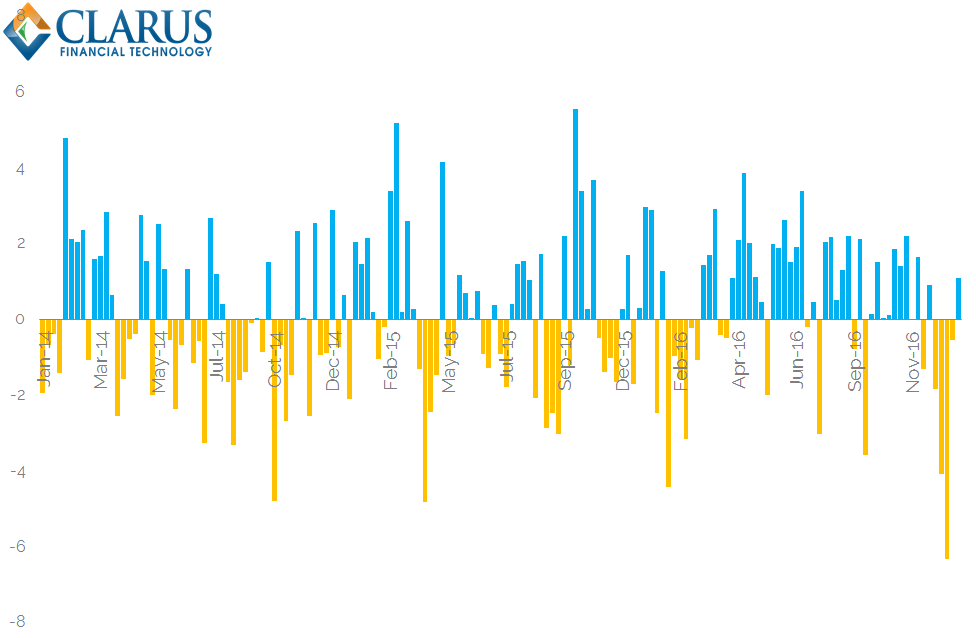
Showing;
- The difference in years between the Average Duration traded across D2D SEFs vs that traded on D2C SEFs.
- A positive reading means that Dealers have traded a longer duration in that month than D2C venues.
- As the previous chart hinted at, the balance between positive and negative readings is fairly matched.
- This does not suggest any systematic under- or over-hedging of maturity by dealers.
- It is also difficult to argue that any changes have been observed over the past 3 years. This does not suggest that agency execution is becoming any more prevalent.
- The data suggests that dealers continue to provide a degree of maturity transformation to clients but mainly run well-matched books in terms of average duration.
In Summary
- One reason that bid-offer spreads in OTC Derivatives have traditionally been wider than other asset classes is due to the liquidity transformation that dealers perform.
- A client may demand a customised structure that a dealer must hedge using liquid, interbank instruments that hedge most, but not all, of the client trade features.
- Given this backdrop, it would not have been surprising to see a difference in the average duration traded across different SEFs catering for either the D2D or D2C markets.
- However, we see very similar duration being traded across both market segments.
- There has been a noticeable behavioural change in the past 3 years however.
- The average duration of swap trades is now significantly longer than back in 2014.
- Whether this is down to changes in US monetary policy specifically, or other market dynamics is not clear from our first analysis of this data.