
- 60% of risk in USD OIS is now subject to trade-level reporting.
- Up to 87% of risk in standardised maturities like 10Y is reported within a couple of minutes of trading.
- The level of transparency in OTC Rates markets is now comparable to other asset classes, including equities trading.
USD OIS Trading
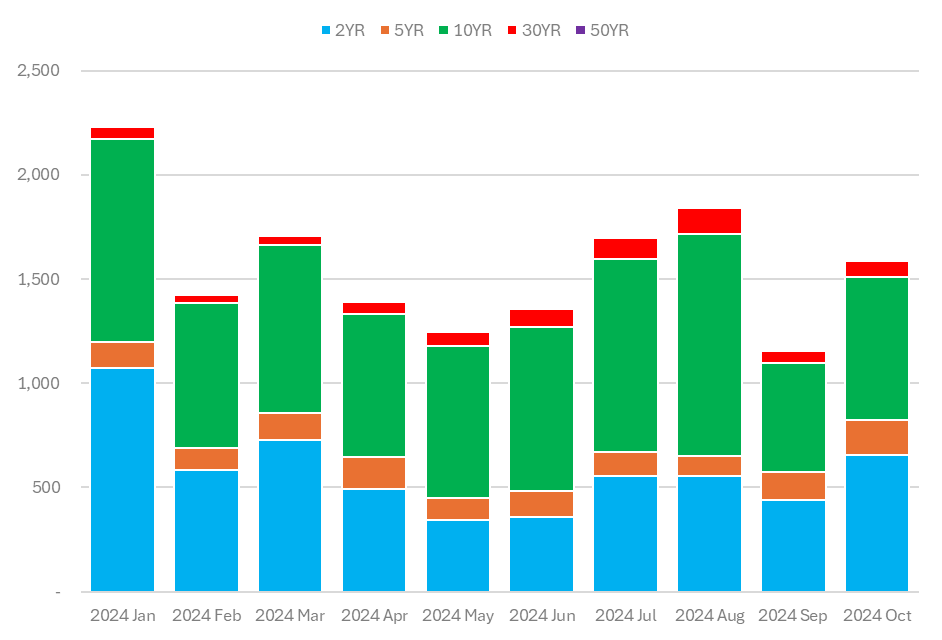
The chart below shows the entire global USD OIS cleared swaps market in 2024:

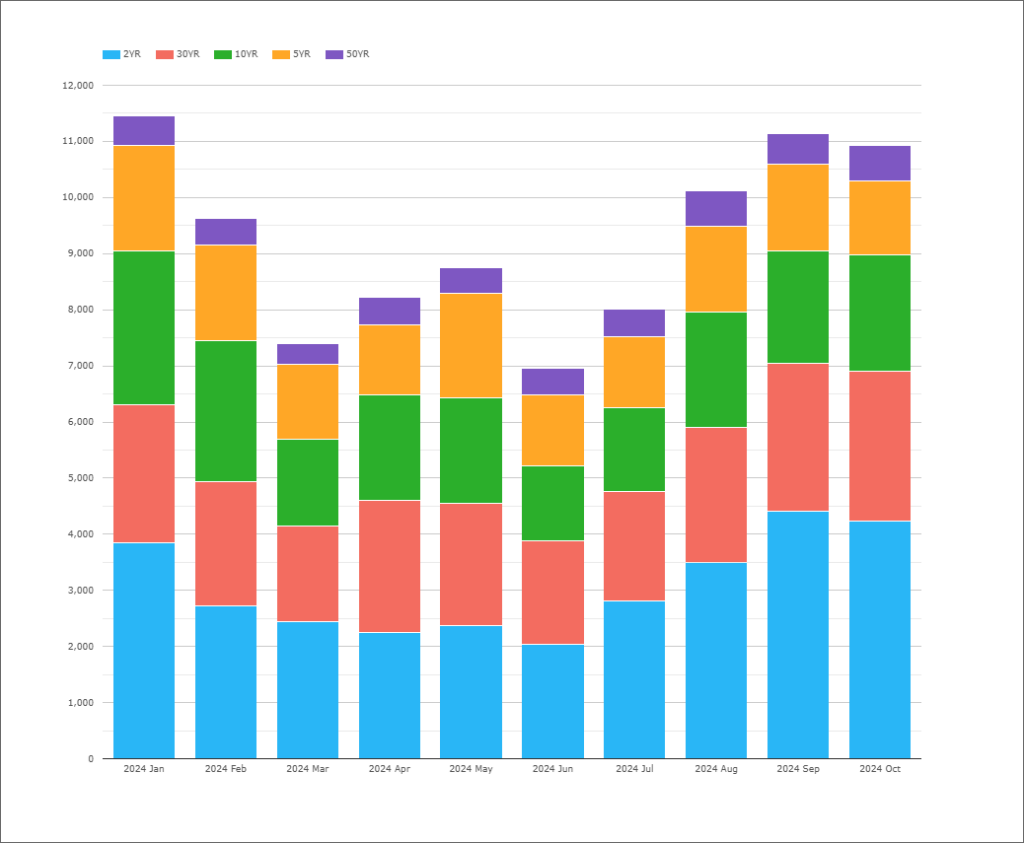
The chart shows the amount of DV01 traded in benchmark maturity buckets – ranging from 2Y to 50Y – in USD OIS versus both SOFR and Fed Funds. The data is from CCPView.
This data is reported directly by CCPs, with it collected, augmented and standardised via CCPView. But CCPView is not the only place that this risk is reported. Let’s take a look at other sources of data.
SEFs
For all trades that are transacted on a regulated SEF (Swap Execution Facility), SEFView allows us to look at the total risk traded in USD OIS in the same tenor buckets. It shows the total volume transacted per instrument, along with highs, lows, opening and closing prices.

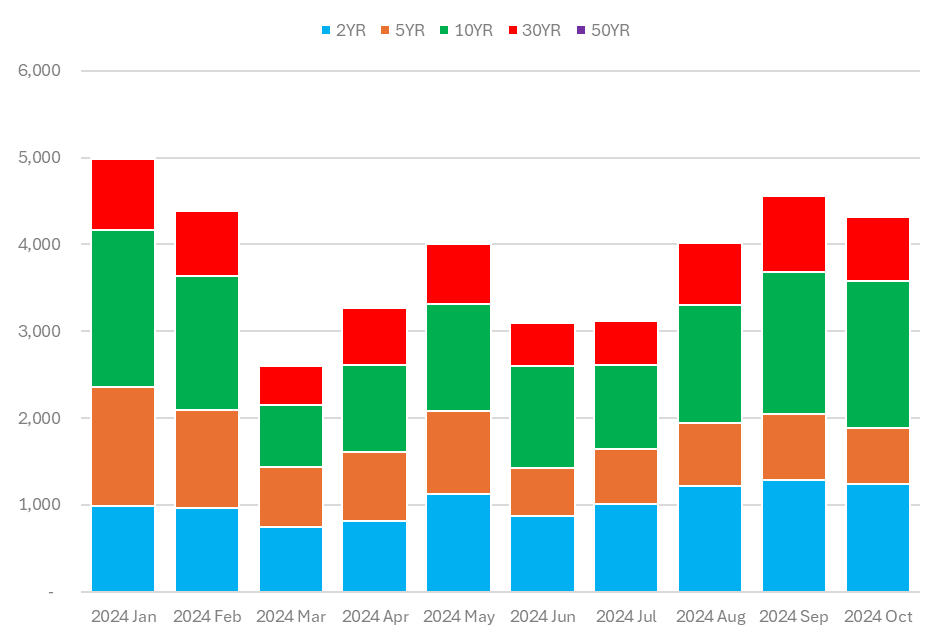
This chart poses a simple question – how much of the global USD OIS market is transacted on-SEF. The answer is “it depends!”:
- On average, over 40% of risk is transacted on SEF.
- But it varies across maturities.
- A lot more risk is transacted on SEF in the 5Y and 10Y areas of the curve (the “belly” of the curve).
- Up to 87% of 10Y risk is now executed on a SEF.
- And on the flipside, SEFs appear to have a relatively small footprint in maturities longer than 30Y.
Off-SEF
It doesn’t take a genius to work-out that the SEF market is more transparent than transactions done off SEF. Fortunately, the off-SEF market is covered by trade level reporting via SDRView. How much risk do we see reported for off SEF trades in these maturity buckets?

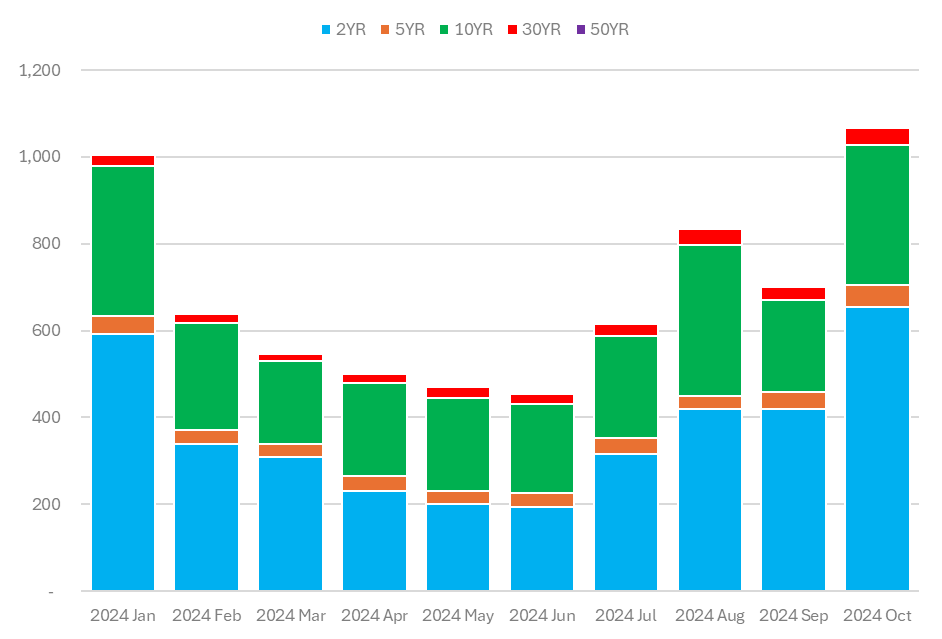
At first pass, with less than ~$1bn of DV01 reported off-SEF each month, it might look like transparency isn’t great for Off SEF transactions. To the untrained eye, this suggests that less than 10% of global risk is executed off SEF (but still captured by US trade level reporting requirements).
However, that statement ignore the impact of block trades.
How Much of the Market is Transparent?
The off SEF market is split into trades under and over the block (or capped notional) thresholds. We need to estimate the true size of the capped notional trades to estimate how much of the market is actually subject to trade reporting.
We do not know the exact figure, but we can take a pretty good stab at it. Calibrating the total size of the SEF market in SEFView versus the capped notional On-SEF trades allows us to scale-up those capped Off-SEF trades by the same multiplier.
Sparing you the all of the steps, we find the following data for off-SEF trading per tenor bucket:

Running the exact numbers, we have trade-level transparency on 60% of the market. 10Y maturities have the highest level of transparency when compared to data provided by CCPs.
Scoring Transparency
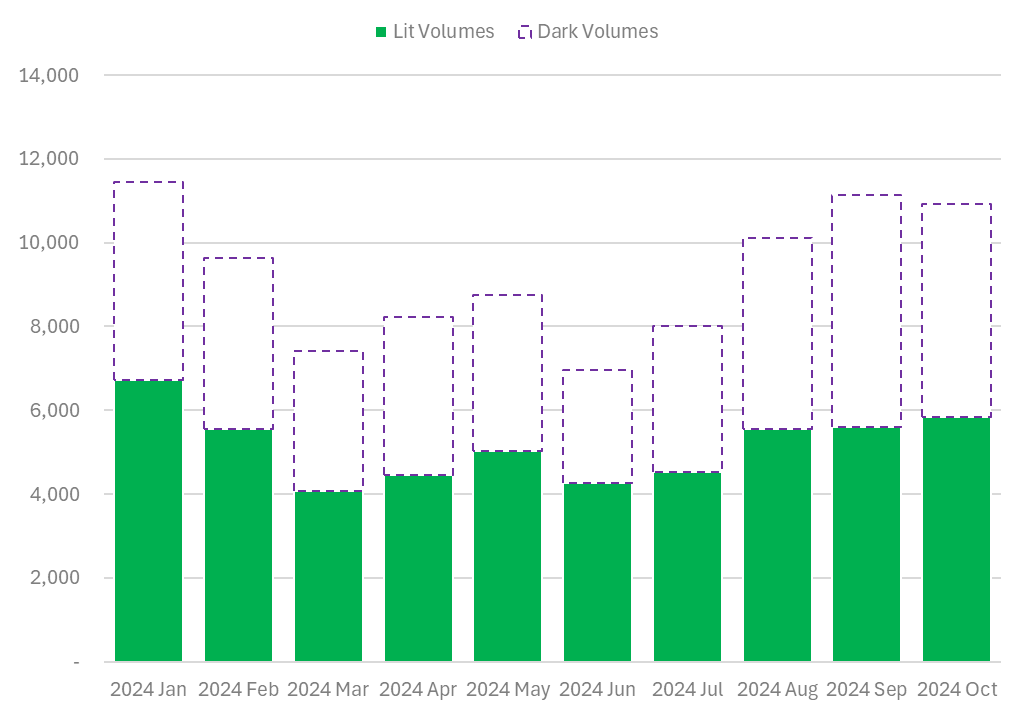
Thanks to the combination of trade-level reporting from SDRs and instrument level volumes from SEFs, we can show that 60% of volumes are subject to transparency requirements:

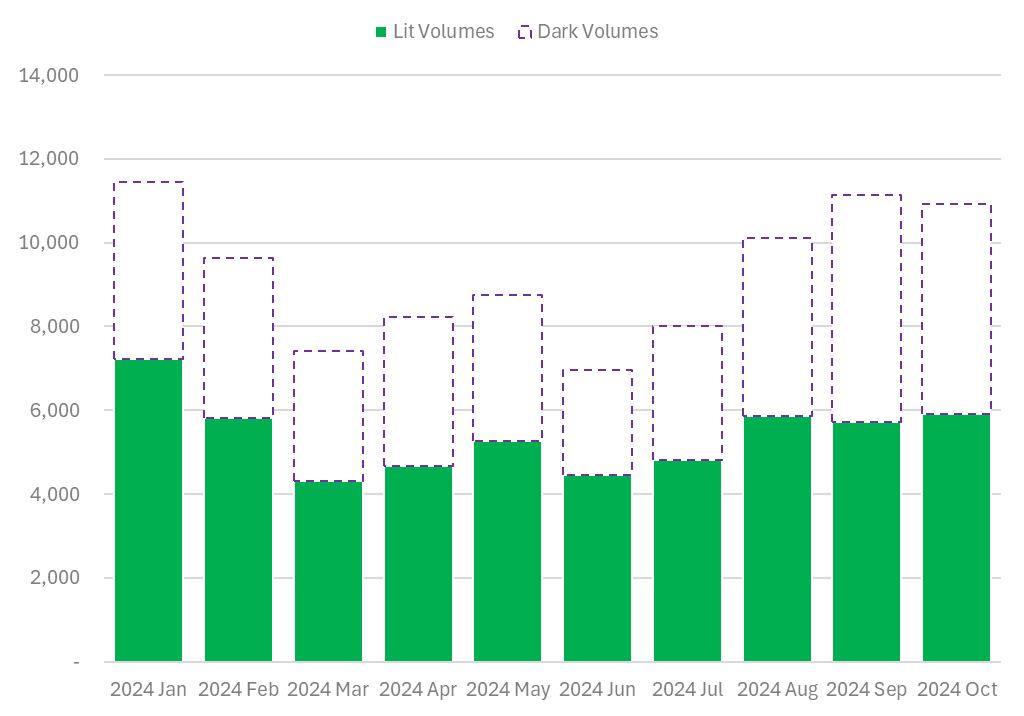
The proportion of the market that is transparent month-to-month is pretty stable, and lies between 57% and 64% of volumes in most months.
How Does That Stack Up?
Equity markets are often held up as the paragon of transparency – and yet Nasdaq report that 40-50% of trading activity occurs in so-called “Dark Pools”:

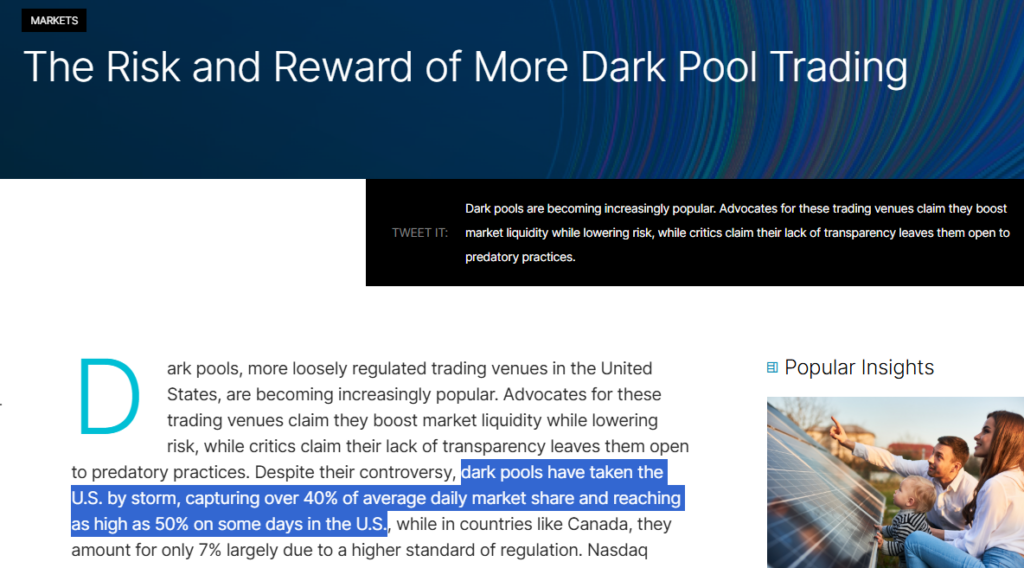
Whilst we should not make a direct comparison between Dark Pools in equity space and true Dark trading in OTC Rates, it is nevertheless helpful to have some kind of metric in other markets when talking about transparency in Rates trading.
In Summary
- Significant Transparency Achieved: 60% of risk in the USD OIS market is now subject to trade-level transparency, with up to 87% transparency in key maturities like 10Y. This level is comparable to some transparency metrics in equity markets.
- Transparency Varies by Venue and Maturity: On-SEF trading accounts for around 40% of risk, particularly concentrated in the 5Y and 10Y tenors. Off-SEF trades are captured through trade reporting, with calibration required to understand the true volume of block trades.
- OTC Rates Hold Their Own: OTC Rates markets show a steady 60% transparency rate—comparable to equities, where 40–50% of trades occur in “Dark Pools”—challenging the narrative that OTC markets are inherently opaque.