- SOFR traded notional hit $50bn in monthly notional for the first time.
- We take a look at the details of some of the block trades that drove this notional higher.
- LCH data shows that the amount of risk traded has been between $4m and $10m DV01 during May and June.
- We show how our data products are used to analyse SOFR activity from 3 day maturities all the way out to 30 years.
SOFR Volume June 2019
USD SOFR trading has been active throughout May and June 2019. Gone are the days when I would NOT receive an email alert for trading activity:

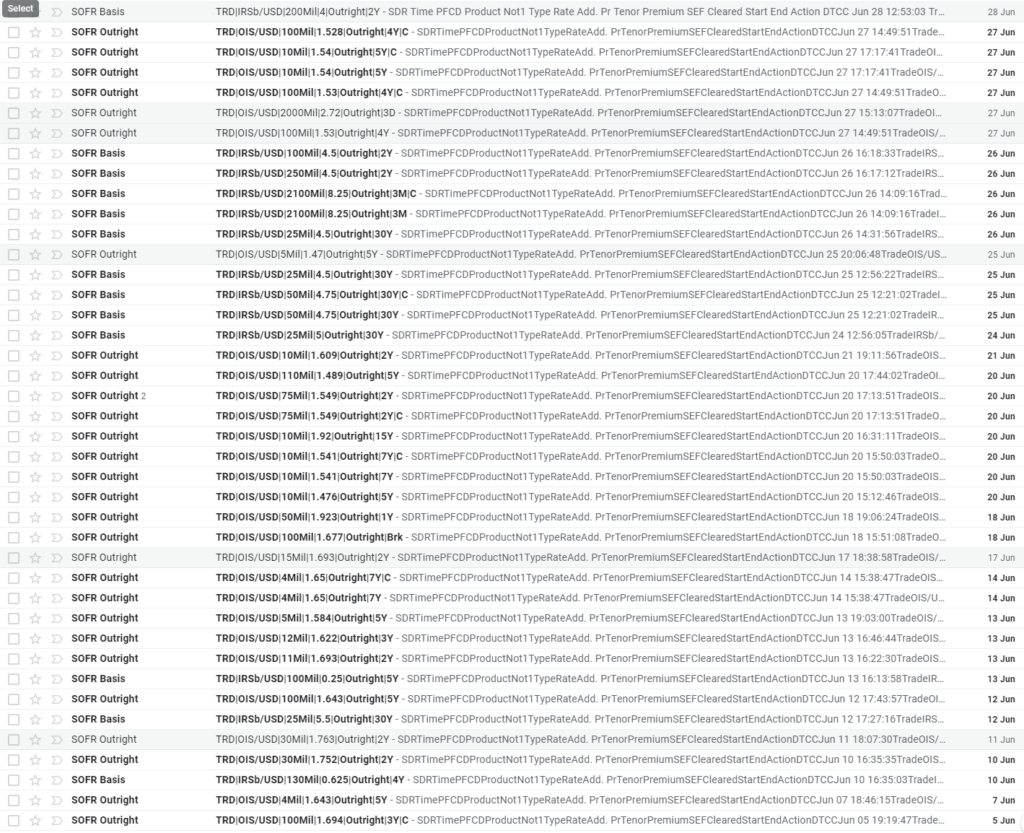
SDRView sends email alerts to my inbox every time a SOFR trade is transacted!
As an indication of how trading has picked up during 2019, that is a pretty good measure. Now let’s take a look at the underlying data.
SDRView Pro
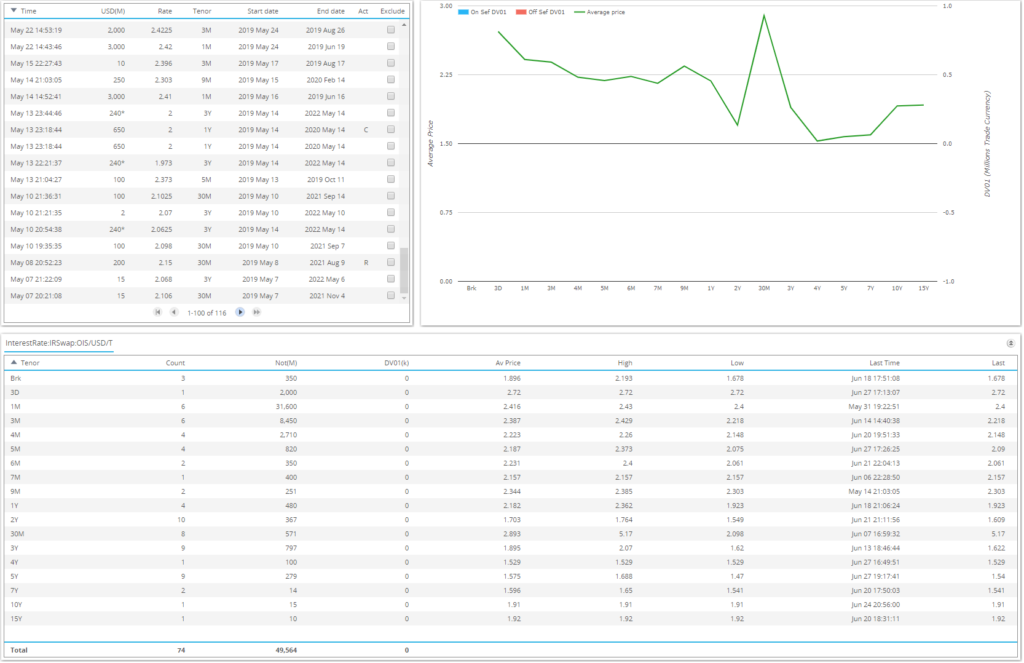
The last two months of SOFR activity in Outright OIS are shown below:

Showing;
- 74 trades in outright SOFR OIS between 1st May and 30th June 2019.
- A reported notional of $50bn.
- Activity in tenors as short as 3 days all the way up to 15 years.
- The most frequently traded tenor was 2 years, trading 10 times in two months.
- The most notional was traded in the one month tenor, with 6 trades accounting for nearly $32bn in notional.
- Over the observation period, the average prices varied from 2.72% (the short 3 day trade) down to 1.529% in the 4 year.
For those looking for particular repo-related trades, the single 3 day trade was over the half-year end (28th June – 1st July) and this probably explains why it was done at the relatively high rate of 2.72%. This compares to the actual fixings of 2.42% on the 1st July and 2.5% on the 28th June 2019.
The same screen for activity in SOFR Basis shows the following;
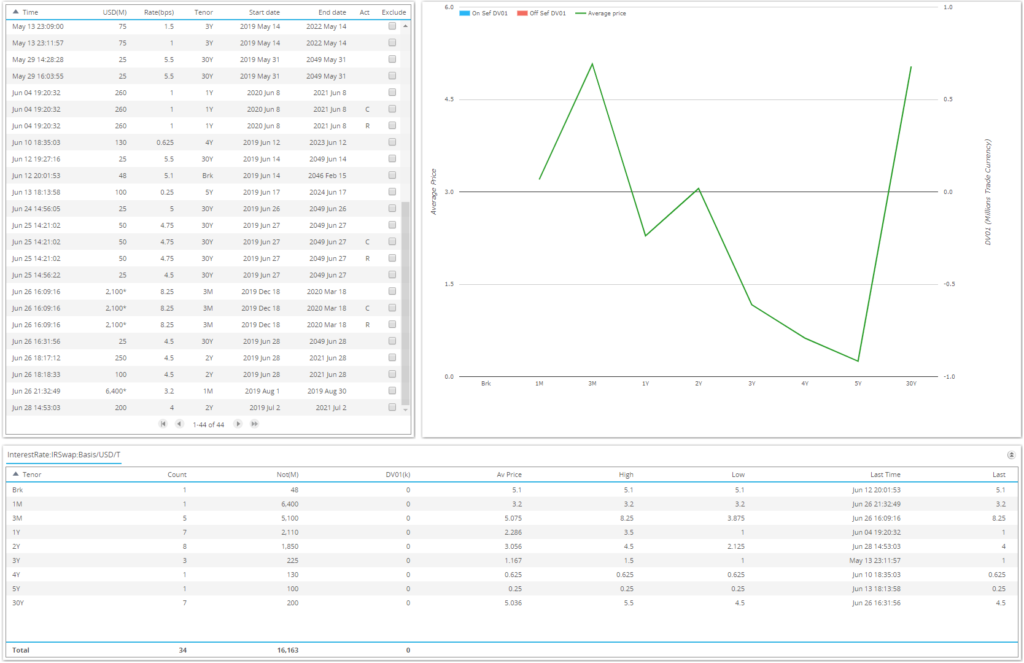
- 34 trades in SOFR Basis.
- Most of the SOFR basis is trading versus Fed Funds, although there have been some trades versus LIBOR as well.
- Activity in tenors from 1 month all the way to 30 years.
- $16bn of notional activity.
- Most noteworthy are seven 30 year trades totaling $200m in notional. Does this signal that basis trades will be more frequent in longer tenors than outrights? I think it is impossible to tell so far.
- The basis rates between SOFR and Fed Funds varied from 8.25 basis points at the very short end to 30 years at 5 basis points.
SDRView Researcher
SDRView Researcher allows us to take a look at longer term trends in activity. Remember from our previous blogs that these include all activity reported to US SDRs, including backloading and compression activity.
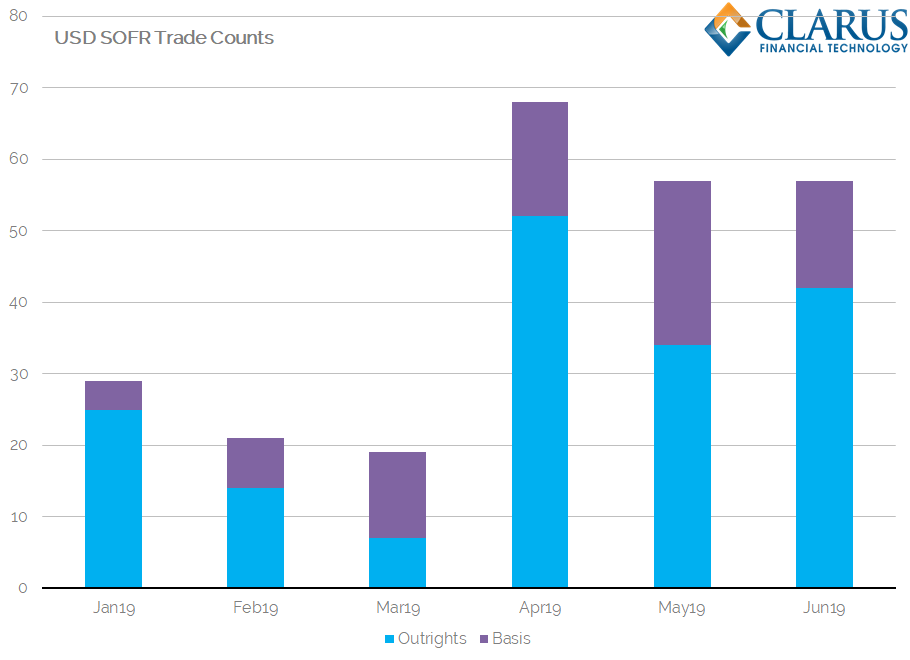
First, SOFR activity by trade count, split by Outright or Basis trade type:

Showing;
- April, May and June have seen sustained levels of activity that have been higher than the previous three months.
- In terms of trade count, April was the most active month with May and June pretty equal.
- Outrights continue to trade more frequently than basis swaps.
- About 30% of trades so far in 2019 have been basis swaps. Almost all of them have been versus Fed Funds.
I realise it is unusual for us to dwell on an analysis by trade count. Why? Well, the story when viewed by notional looks substantially different;
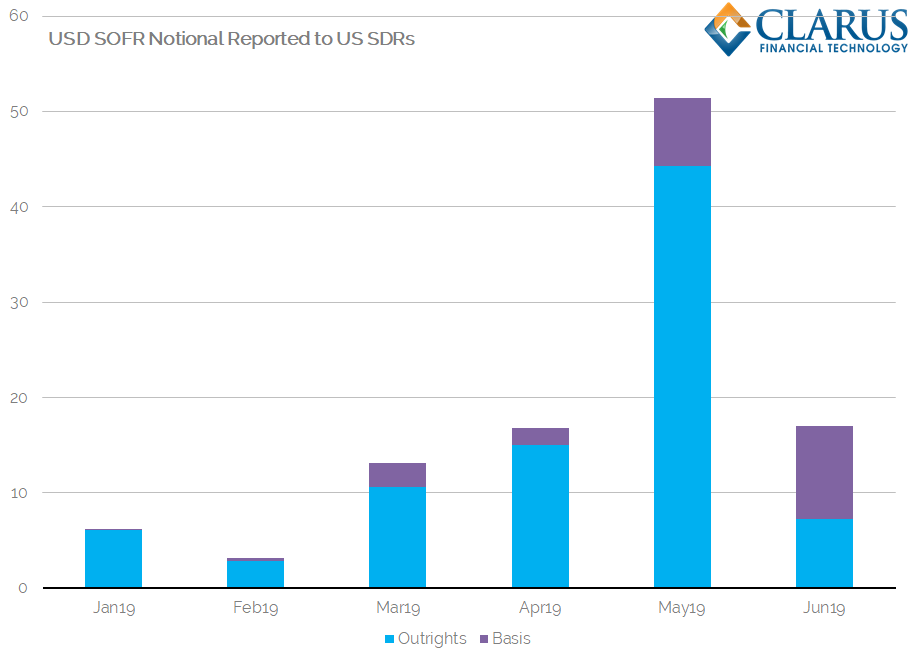
Showing;
- A huge spike in activity during May 2019. Over $50bn of notional was reported to SDRs.
- 86% of the notional reported in May 2019 was in outright SOFR.
- There were 4 block trades executed in May 2019.
- These block trades totaled at least $25bn and were all one month tenors starting on 1st July.
- Even ignoring those short-dated and somewhat unusual SOFR trades, May 2019 would have been a record month for notional traded.
- 57% of SOFR notional was traded as a basis swap during June 2019, which is considerably higher than previous months.
- In fact, June 2019 was the first month with over $10bn of SOFR basis swaps reported to the SDRs.
- We note that two of these basis swaps that were executed in June 2019 were short-dated block trades (less than 3 month maturity) totaling at least $8.5bn.
CCPView
Finally, let’s take a look at the global market. What did LCH report as being cleared in SOFR during the past two months? Seeing as we’ve already looked at trade counts and trade notional, I choose to present the data in DV01 estimates:
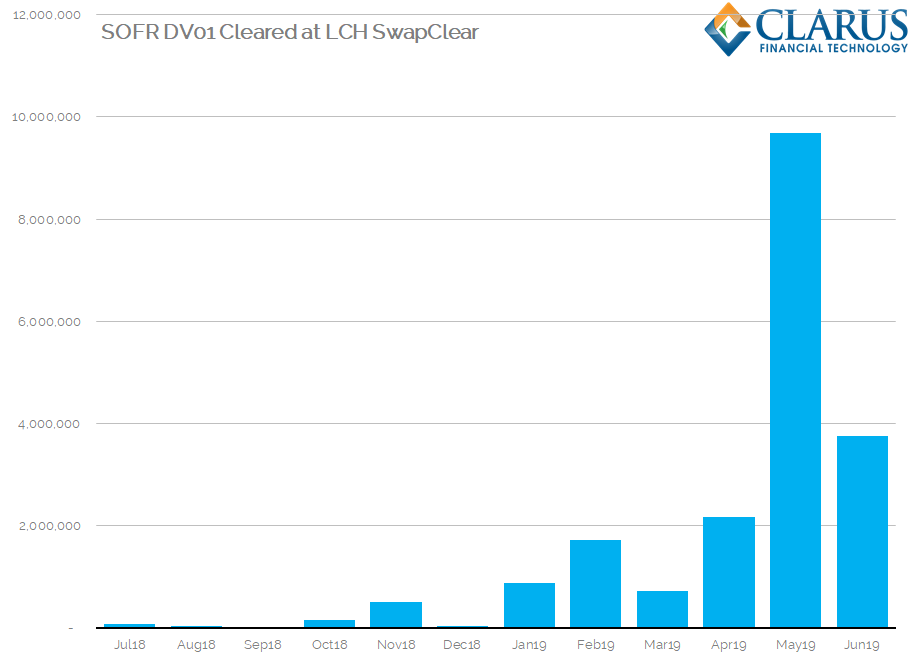
Showing;
- A very similar story to the Notional traded chart from above, with May 2019 comfortably a record month in DV01 terms.
- (Disclaimer: Due to limited data granularity, the block trades that we looked at above are considered as one year tenors in this analysis).
- Even discounting May as an “unusual” month, June 2019 saw 1.7 times the DV01 activity when compared to April (which was our previous record!).
- All measures point towards increased activity and a more healthy market than when we first started writing about these trades all the way back in July 2018 with “SOFR Swaps are Trading!”.
In Summary
- May and June 2019 activity in SOFR was comfortably higher than previous months.
- There have been some very large short-dated block trades reported in SOFR.
- There was also $200m of activity in 30 year SOFR basis swaps.
- Most trades are outrights. About 30% of trades are versus Fed Funds.
- There is now typically at least one SOFR trade per trading day.