Following my recent article, 2018 SEF Market Share Statistics, I wanted to look into the currencies that I did not have time for in that post; specifically Latin American and Asian.
Interest Rate Swaps – LatAm
Lets start with the gross notional traded in LatAm currencies in 2018 on all SEFs.
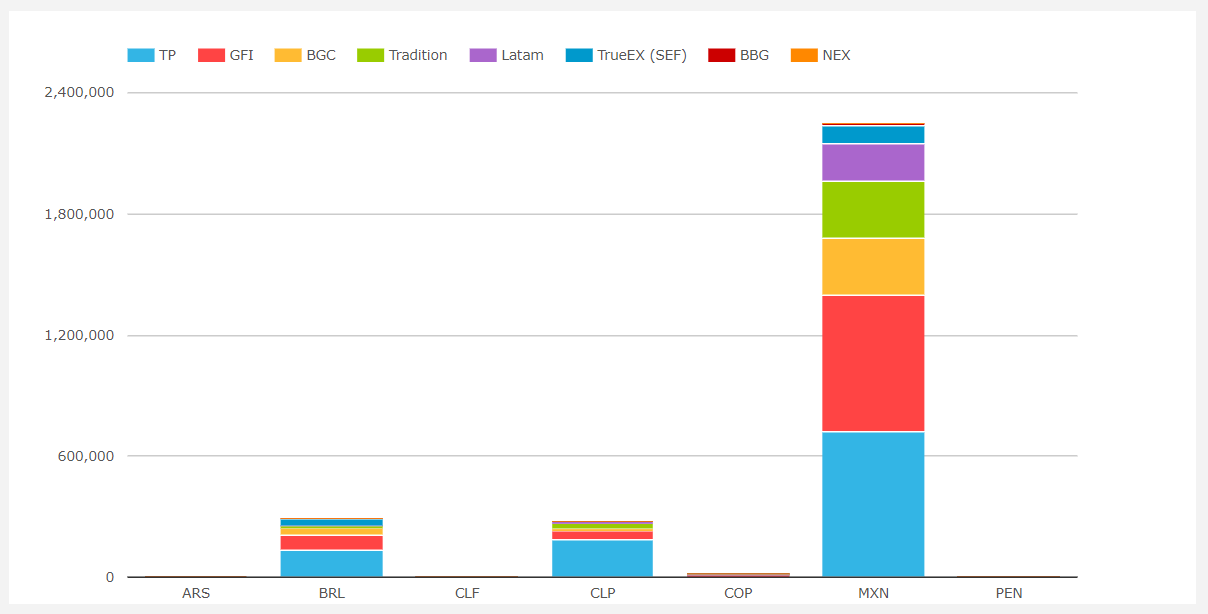
- MXN by far the largest with $2.25 trillion in 2018, up 40% from $1.6 trillion in 2017
- (Note this is similar to the volume of JPY IRS on SEF in 2018!)
- BRL next with $290 billion, up 48% from $196 billion
- CLP with $277 billion, up 8% from $256 billion
- The rest smaller, COP $12 billion, CLF $2.6 billion, PEN $1.5 billion, ARS 35 million
The above as a percent market share chart in dv01 terms.
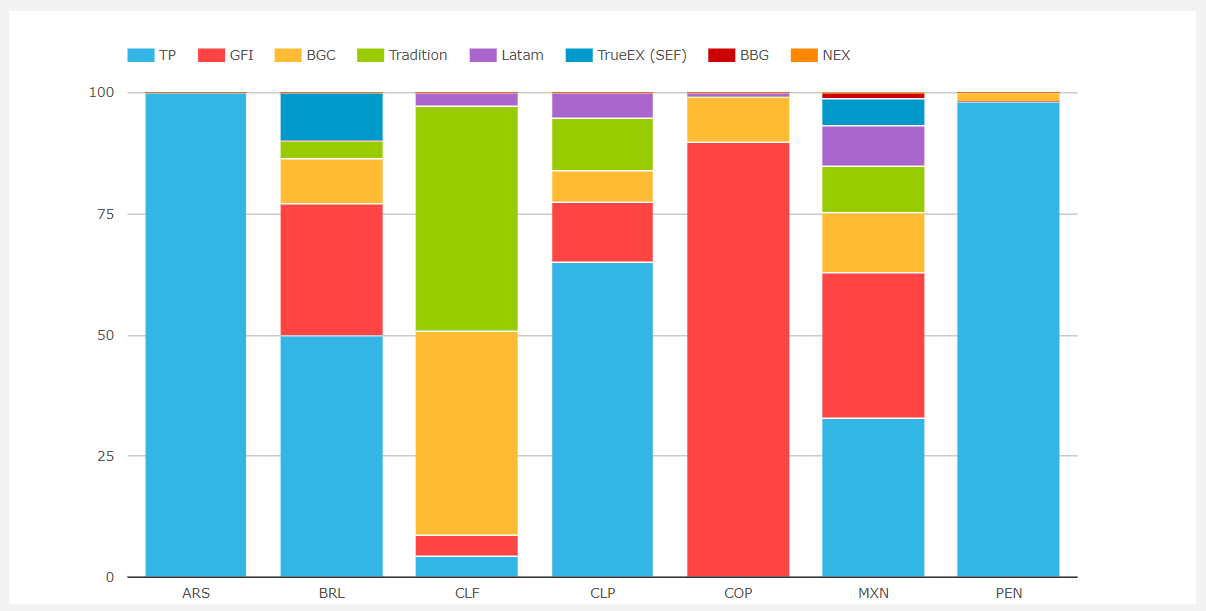
- MXN, very competitive with TP at 32.7%, GFI at 30% and BGC 12.7%
- BRL with TP dominating at 50%, GFI 27.2% and BGC 9.3%
- CLP, TP more dominant at 65%, GFI 12.5% and BGC 6.6%, Tradition 10.6%
- In the smaller currencies, COP is 90% GFI and PEN 99% TP
- Other SEFs showing volume are:
- Latam SEF in MXN, CLP, CLF
- TrueEx in BRL and MXN
- BBG in MXN
Interest Rate Swaps – Asia
Next the gross notional traded in Asian currencies in 2018 on all SEFs.
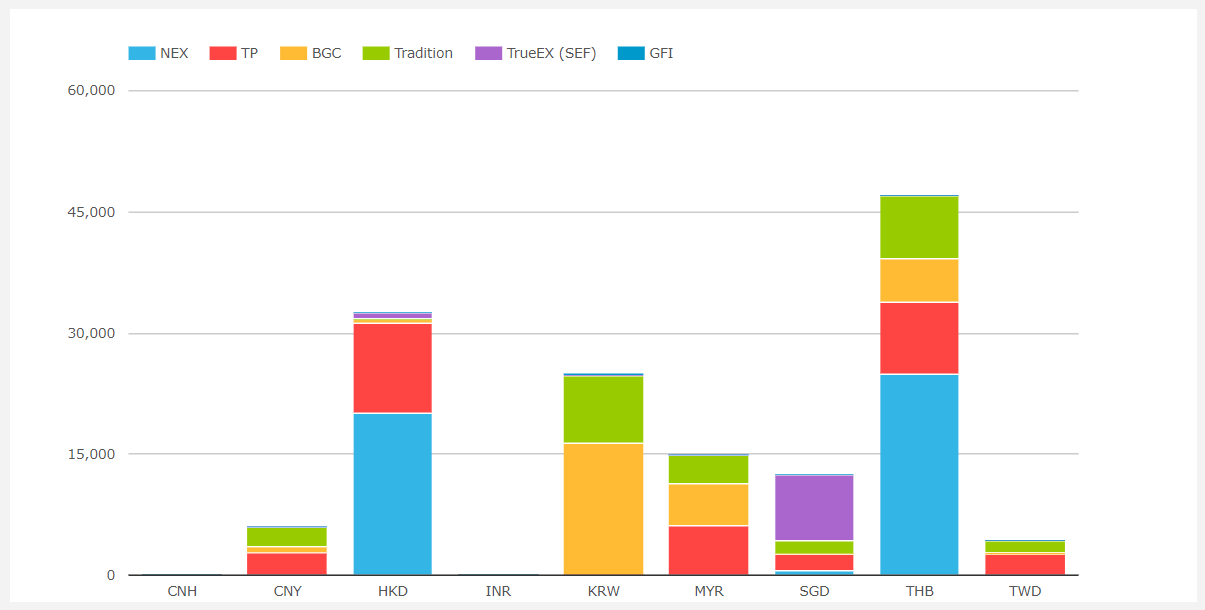
- (Excluding JPY, AUD, NZD volumes, which are $2.2 trillion, $1.1 trillion and $115 billion respectively)
- THB is the largest $47 billion, up 70% from $27.6 billion in 2017
- HKD next with $32.5 billion, massively up from $2.3 billion in 2017
- KRW with $25 billion, up 14% from $22 billion
- MYR with $15 billion, down 60% from $38.6 billion
- SGD with $12.5 billion, up significantly from $3.2 billion
- CNY with $5.9 billion, down 74% from $22.7 billion
- TWD with $4.2 billion, up from $2.3 billion
Presenting the above as a percent market share chart in dv01 terms.
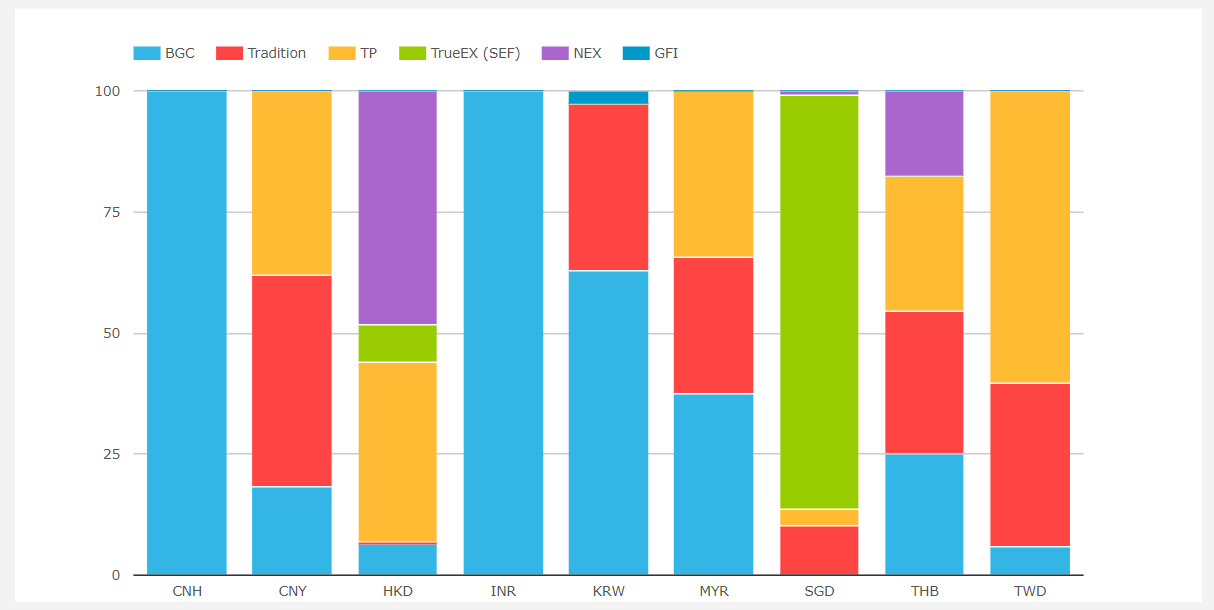
- THB very competitive with Tradition, TP, BGC with 29.5%, 27.8%, 25% respectively
- HKD with NEX dominating with 48.3% and TP with 37%
- KRW with BGC dominating at 63%
- MYR with BGC, TP, Tradition with 37.6%, 34.3%, 28.1%
- SGD with TrueEx at 85.7%
- CNY with Tradition at 43.9% and TP at 38%
- TWD with TP at 60.5%
Non-Deliverable Forwards – LatAm
Now lets switch to Non-Deliverable Forwards in LatAm currency pairs.
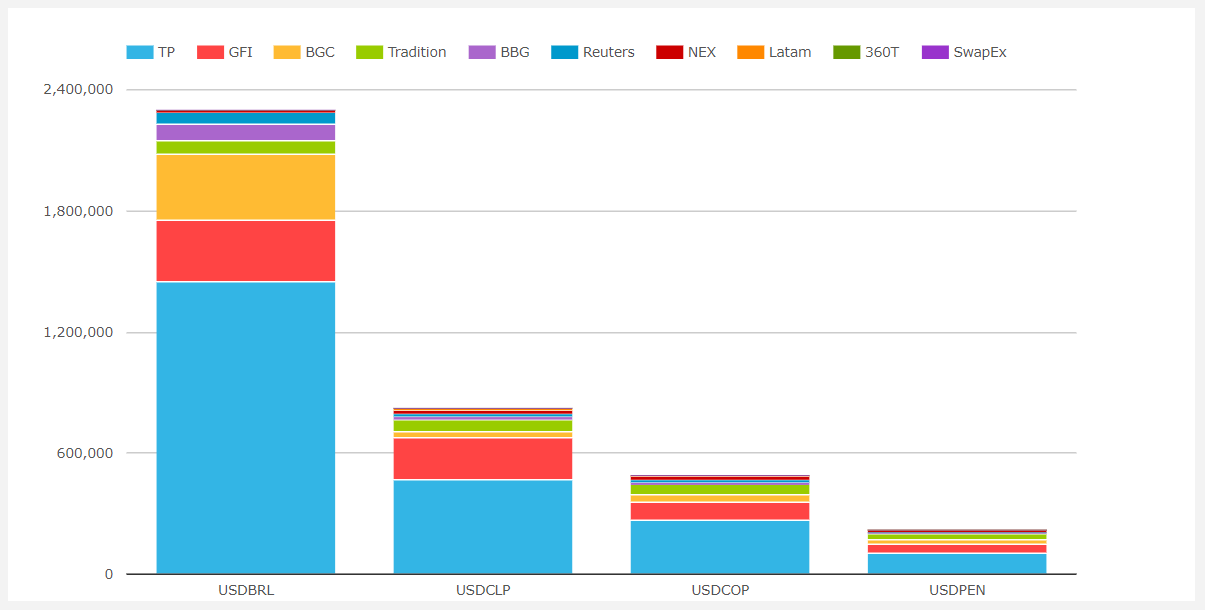
- USDBRL by far the largest with $2.3 trillion, up 15% from $2 trillion in 2017
- USDCLP with $825 billion, up 23% from $672 billion
- USDCOP with $490 billion, up 23% from $400 billion
- USDPEN with $221 billion, down from $231 billion
Next market share for D2D SEFs, which at $3.6 trillion in total are much larger than the $205 billion at D2C SEFs.
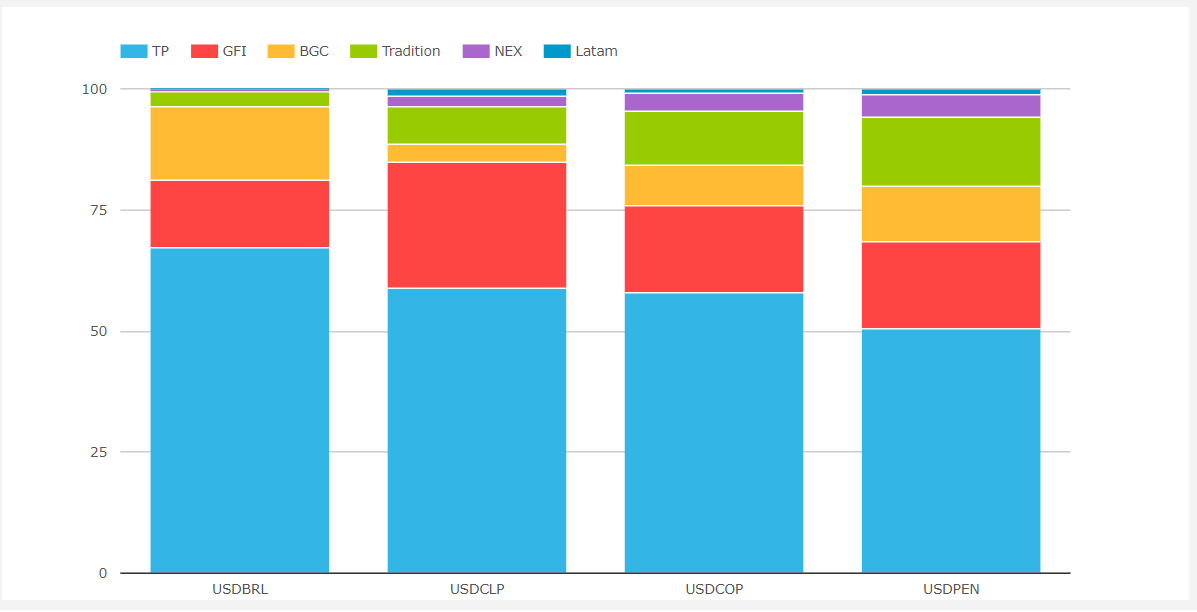
- TP dominating each currency pair
- Ranging from 67% in USDBRL to 50% in USDPEN
- GFI next with 26% in USDCLP and 18% in USDCOP and USDPEN
- Tradition with 14.3 in USDPEN
And market share for D2C SEFs.
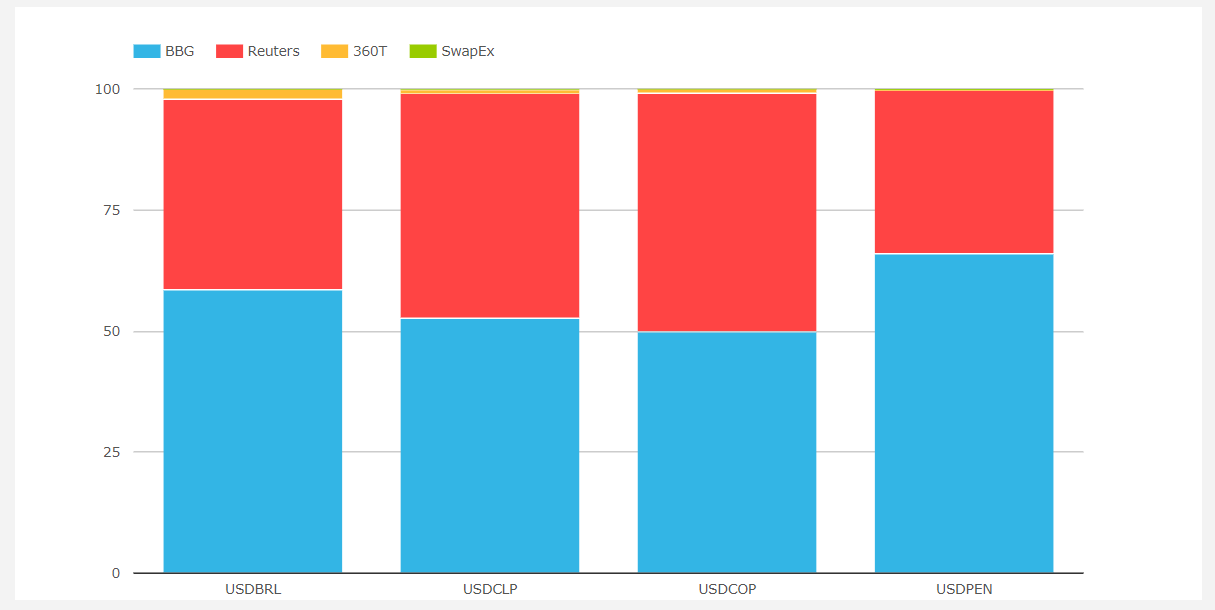
- BBG the largest with 58.5% in USDBRL and 52.6% in USDCLP
- Reuters next with 39.4% in USDBRL and 46.5% in USDCLP
Non-Deliverable Forwards – Asia
Next the gross notional traded in Asian currencies in 2018 on all SEFs.
- USDKRW the largest with $933 billion, up 45% from $642 billion in 2017
- USDINR close behind with $847 billion, up 50% from $565 billion
- USDTWD with $648 billion, up 51% from $430 billion
- USDIDR with $301 billion, up 66% from $181 billion
- USDCNY with $298 billion, up 16% from $256 billion
- USDPHP with $200 billion, up 55% from $129 billion
D2D SEFs much larger than D2C with a cumulative volume in these currency pairs of $2.85 trillion compared to $376 billion.
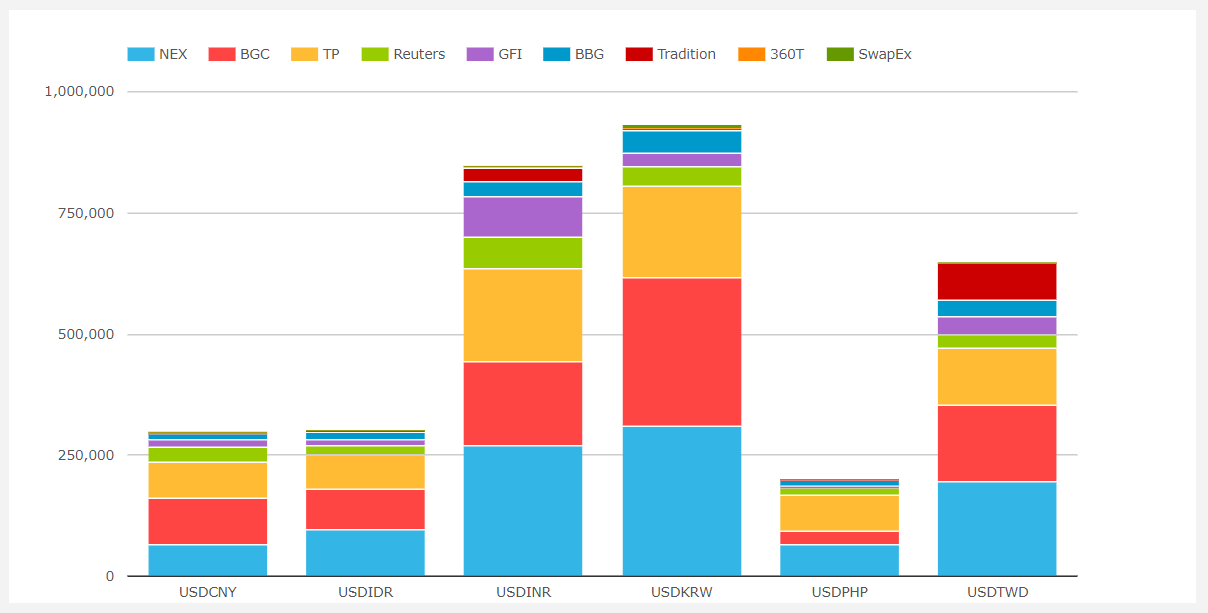
Market share for D2D SEFs.
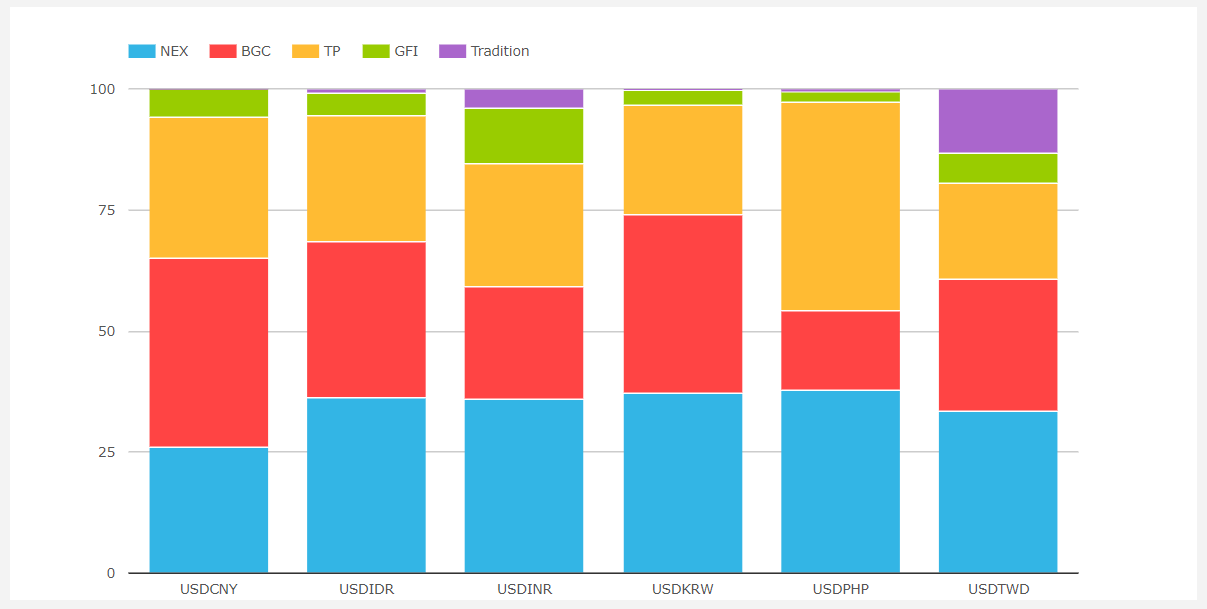
- NEX the largest overall SEF with BGC on second
- USDKRW with NEX and BGC very close at 37.3% to 36.7%
- USDINR with NEX 35.9%, TP 25.4% and BGC 23.3%
- USDTWD with NEX 33.5% and BGC 27.3%
- USDIDR with NEX 36.3% and BGC 32%
- USDCNY with BGC 39% and TP 29.1%
- USDPHP with TP 43% and NEX 37.9%
Market share for D2C SEFs.

- Reuters just ahead of BBG
- SwapEx meaningful in USDKRW
- 360T showing low single-digit share in each
The End
That’s it, 10 charts to summarise IRS and NDF in LatAm and Asian currencies.
There are more I could have created, given the product/ccy/sef dimensions available.
I hope you found ones useful to your interest.
If not, using SEFView you can create your own.
Please contact us for a subscription if you don’t have one.
It will be interesting to see how 2019 market share develops.
We publish regular Swaps Review articles.