- SONIA volumes have hit all-time highs in January 2020.
- The highest volume of SONIA traded on a single day has been £700bn on 15th January.
- Total monthly volumes will be over £4trn for the first time ever.
- The spike in activity is concentrated in short-dated instruments, suggesting it is closely related to the BoE meeting on January 30th 2020.
SONIA Records are Tumbling
This Risk.net article last week drew some attention in these parts:
https://www.risk.net/risk-quantum/7341106/giant-ps174bn-sonia-swaps-trading-day-may-be-biggest-ever
I decided to drill-down into our Clarus trading data to add a bit more meat to that particular SONIA headline.
SDRView
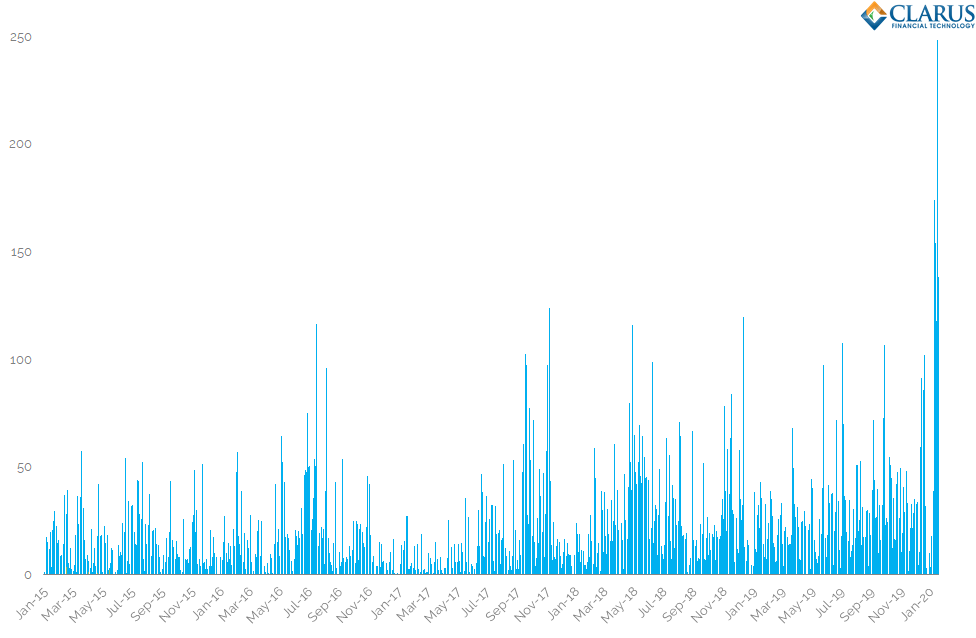
Exactly as the Risk headline stated, we have seen the largest ever daily amounts of outright SONIA reported to US SDRs this year:
Showing;
- Daily outright SONIA volumes (in billions of GBP £) reported to US SDRs in the past five years.
- These look at only SONIA OIS – they exclude basis trades (i.e. SONIA vs LIBOR).
- I didn’t realise, but the size of basis trades (at least in notional terms) are pretty small compared to outrights.
- Our keen-eyed readers will notice that the scale goes up to £250bn.
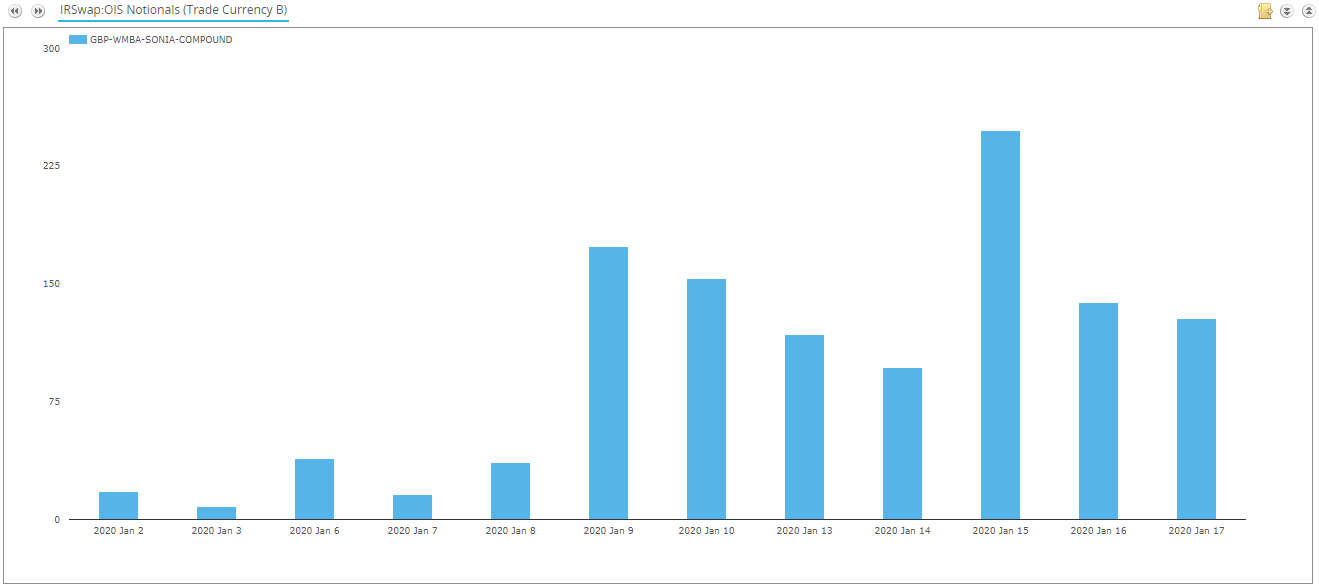
Drilling down into the January 2020 volumes reveals that the previous record of £174bn has already been bettered with £248bn trading on January 15th.
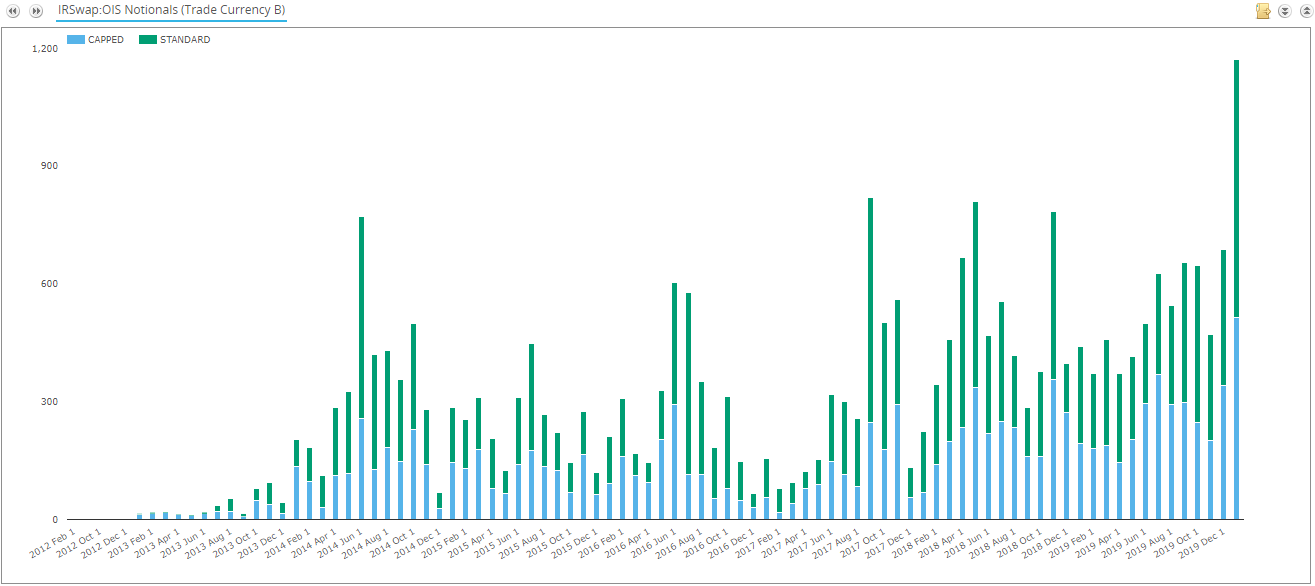
These huge daily amounts therefore mean that January 2020 has already registered record all-time monthly volumes of SONIA reported to US SDRs. And we still have 11 days left at pixel-time:
Showing;
- January 2020 is the first time that reported SONIA US SDR volumes have topped £1trn in a single month.
- The chart above is split into Capped and Standard volumes. This is because we do not see the full volume reported for block trades in SDR data.
- This means that total SONIA volumes are even higher than the chart shows.
- So far in January 2020, 44% of volume (or 17% by trade count) has been reported at the capped notional threshold. This threshold varies with maturity.
Other Clarus data products can provide a more complete picture of total SONIA volumes traded this month.
CCPView
To see total volumes in SONIA, we use CCPView, which shows all cleared volumes globally. Almost all SONIA volumes are now Cleared. For example, US SDR data shows 99.5% of outright SONIA is cleared. Therefore, CCPView gives us a virtually complete view of the volumes traded in the market.
First, daily volumes in January 2020. As per SDR volumes, these are single-counted volumes (see our Data Principles. We only ever refer to single-counted volumes).
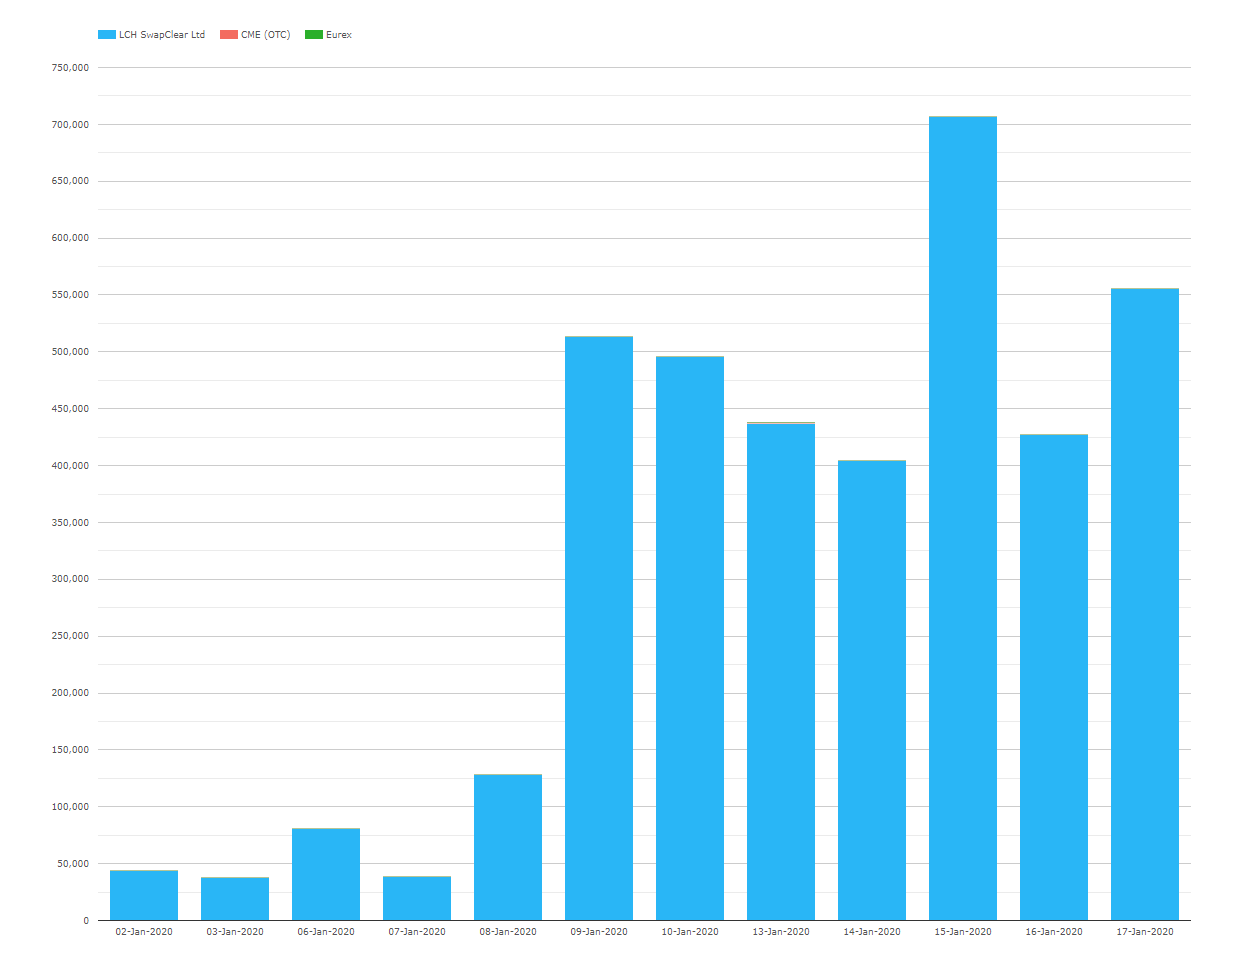
Showing;
- Wow! 15th January 2020 saw over £700bn cleared on a single day.
- That is almost three times greater than the amounts we saw reported to the US SDRs.
- Generally, we find that the SDR data tends to cover about one third of the total in GBP markets (although this does vary so don’t take it as gospel truth!).
- Since the 9th Jan, daily volumes have been over £400bn every single day.
Of course, this means that January 2020 is already a record month for outright SONIA OIS clearing. It’s not a record by as much as you may think though;
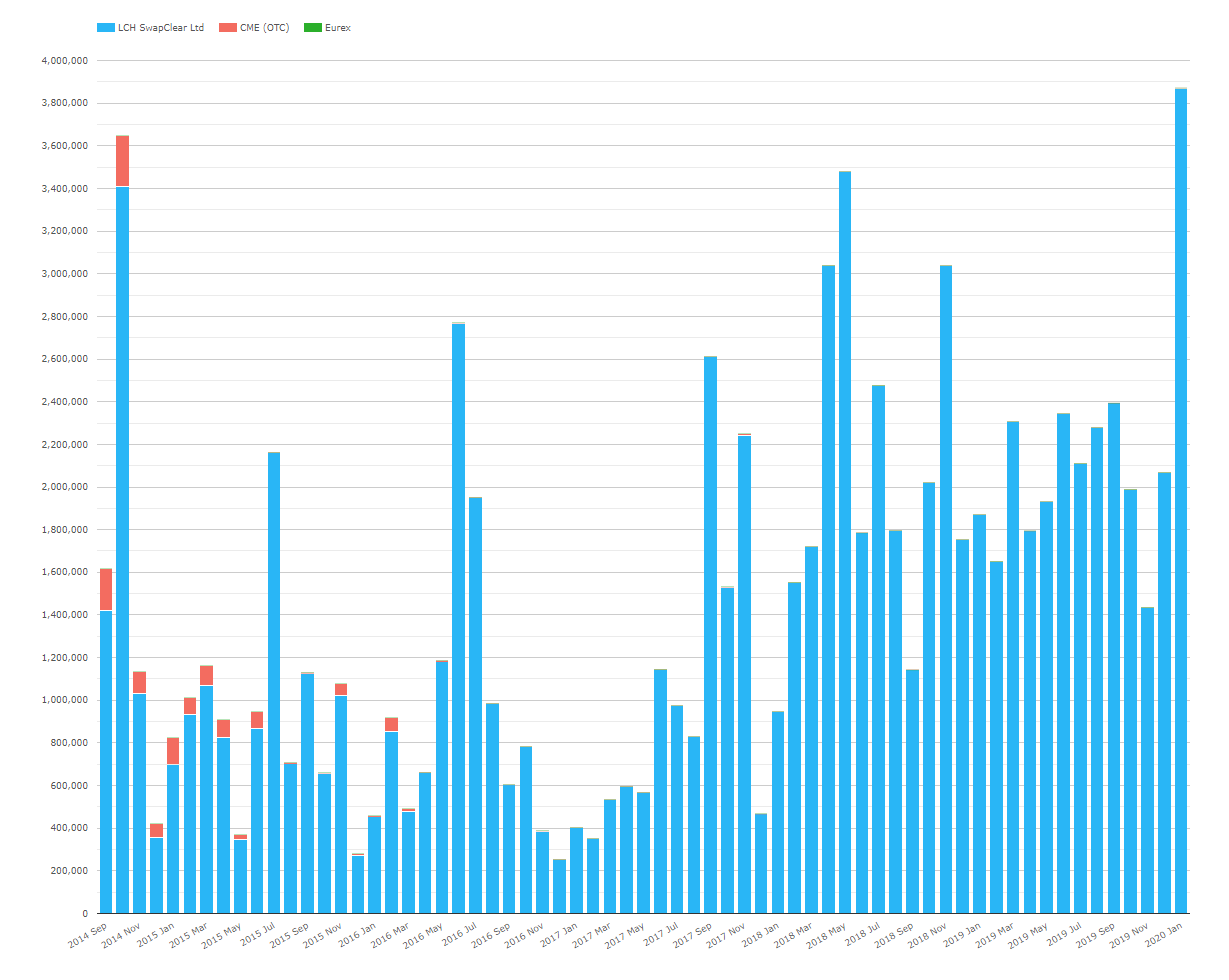
Showing;
- January 2020 SONIA volumes have already topped £3.8trn. Almost all of it has been cleared at LCH SwapClear.
- With ten trading days still to go, and each day recently toppping £400bn, we could be looking at huge volumes this month.
- The previous record month was way back in October 2014. That saw £3.6trn traded in outright SONIA.
- So January 2020 will certainly be a record month. It will be interesting to see how large the volumes end up.
Tenors
Why the elevated volumes in SONIA? Using CCPView, we can break down the activity by tenor at LCH SwapClear.
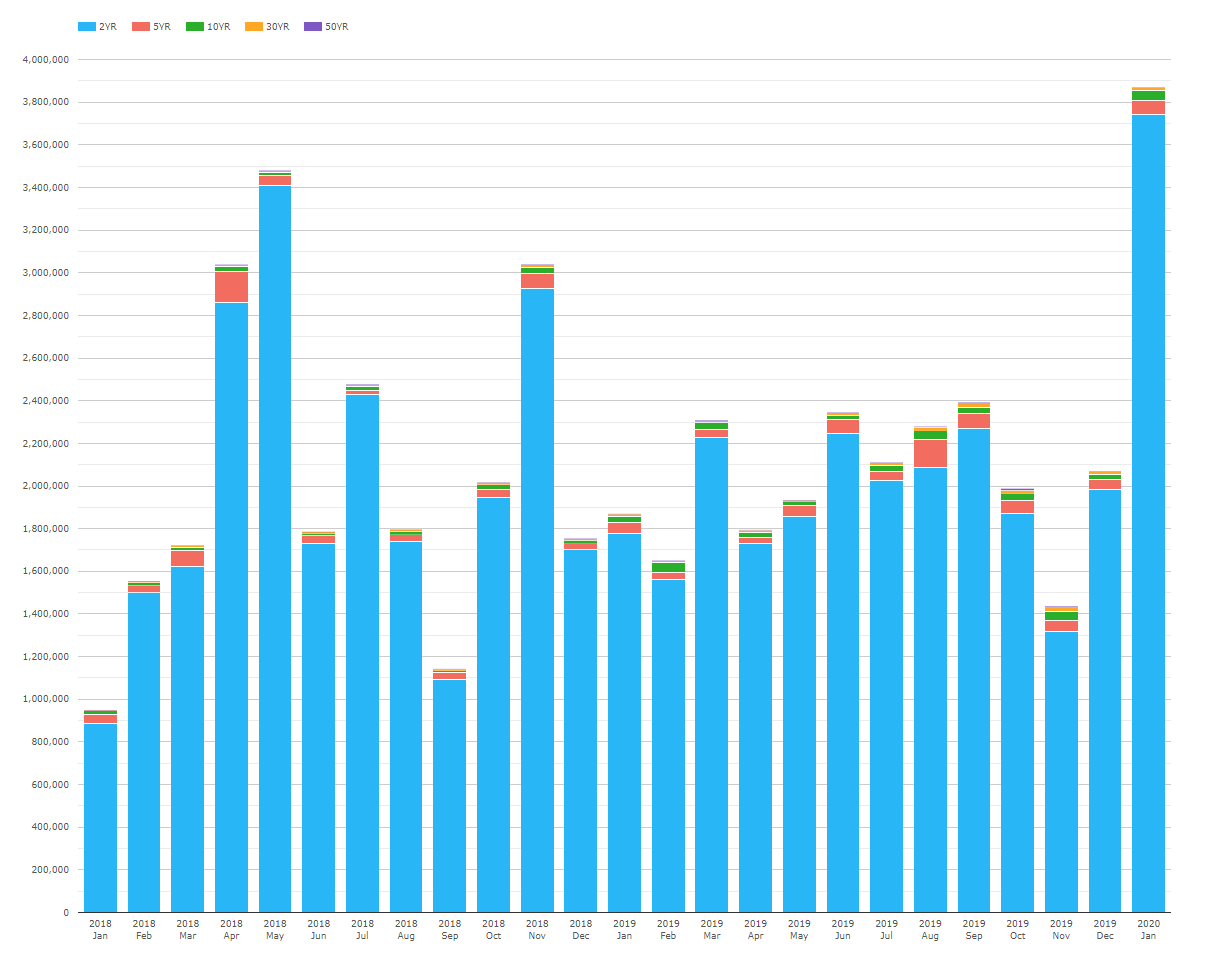
Showing;
- The vast majority of activity remains short-dated, in tenors of 2 years and less.
- This suggests that the spike in activity is strongly related to expected rate action from the Bank of England.
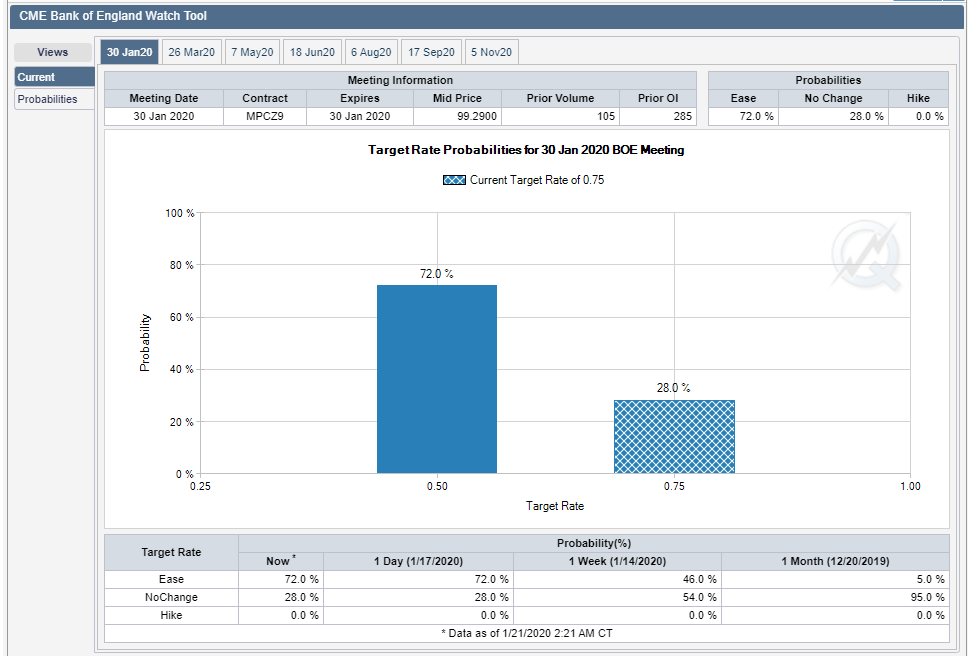
- Cross checking versus the CME BoEWatch page, we indeed see a 72% chance of a cut at the meeting next week (30th January).
The RFR Angle
Are these SONIA volumes also a result of increased activity in RFRs relative to LIBOR?
If more activity is moving towards RFRs, we would expect to see record volumes in longer dated SONIA tenors. I don’t think that the data shows evidence of this move (yet).
The chart below shows only the SONIA volumes longer than 2 years:
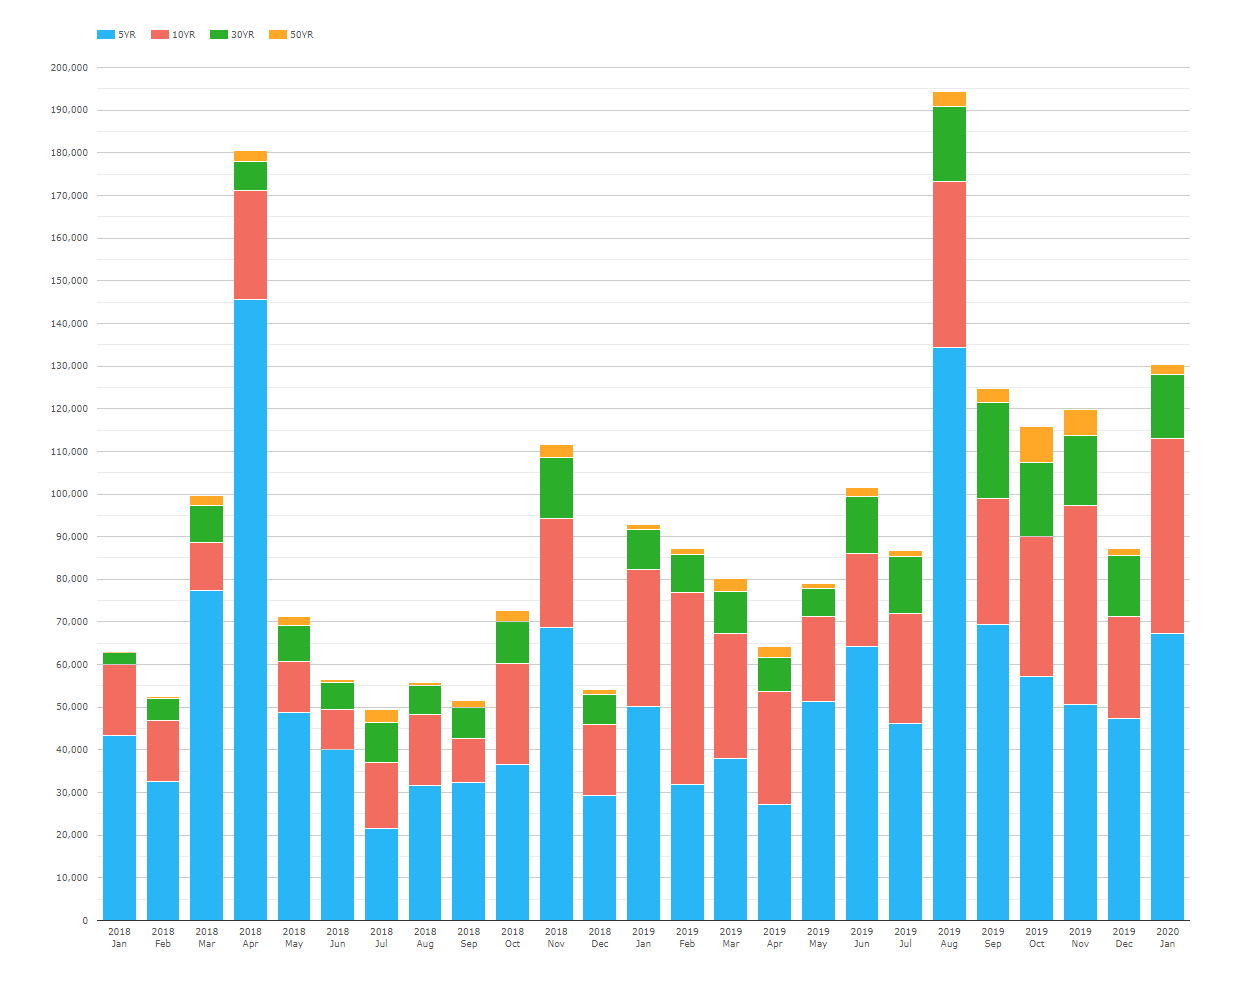
Showing;
- No records have been set in January 2020 so far for long-dated SONIA trading.
- With ten trading days still to go, we are not seeing the huge volumes in 5y + SONIA as we are seeing in the shorter end of the curve.
- August 2019 was the all time record for longer-dated activity. We are still £65bn short in notional terms from that record.
- However, with 2 trading weeks still to go I wouldn’t rule out seeing a record. It just won’t smash the records like we have seen in the short-end.
The data therefore suggests that the elevated volumes in SONIA are due to the market choosing the most appropriate instrument to express a view on central bank rate action (i.e. short-dated SONIA) rather than a structural move toward RFR trading.
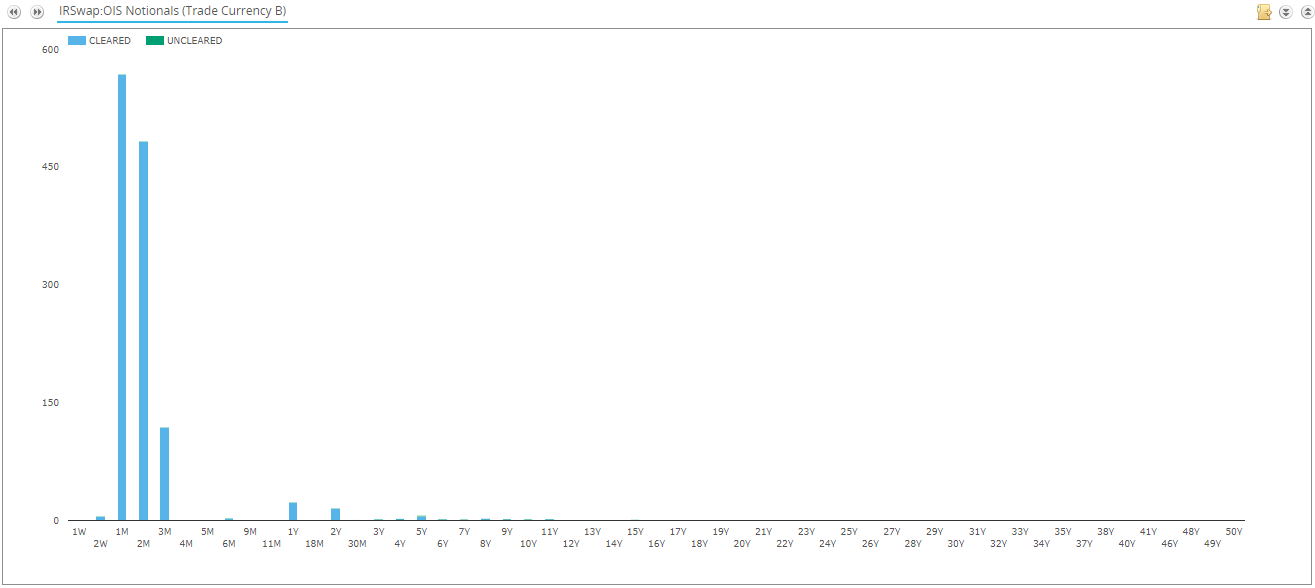
This conclusion is strongly backed up by the tenor data in SDRView. It shows that 95% of SONIA activity in 2020 has been in tenors of 3 months and less:
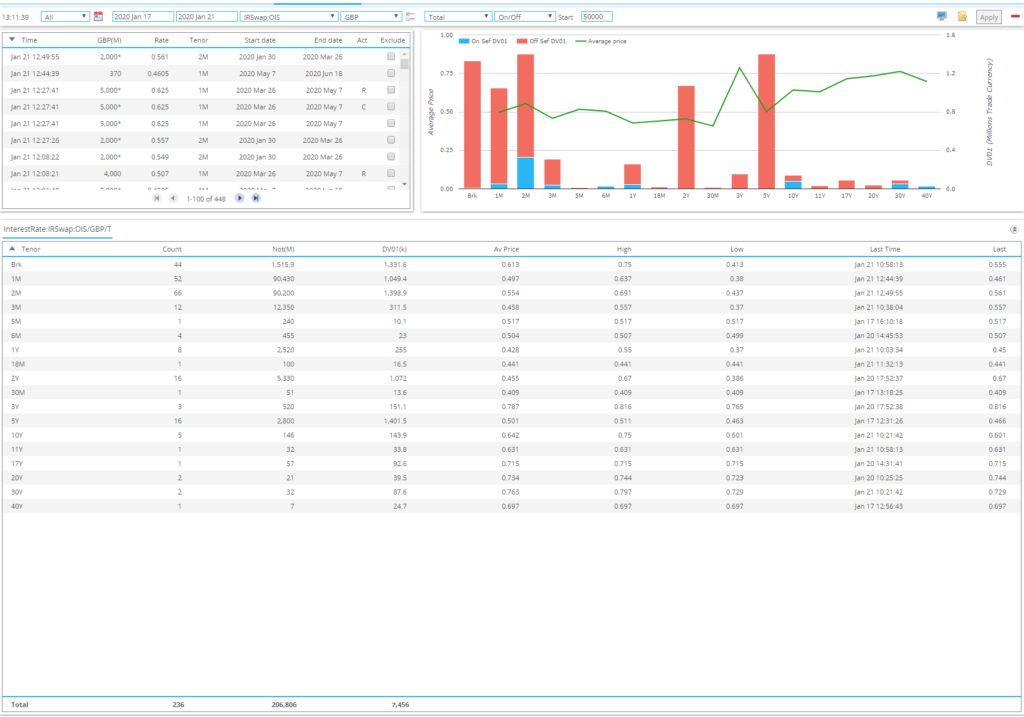
Real-Time Data
Finally, when markets are this active, it is often crucial to see what is trading as soon as it is reported. Therefore, SDRView Professional provides updates on SONIA trading as soon as it is reported:
In Summary
- January 2020 will be a record month for overall SONIA trading, with daily volumes regularly over £400bn.
- January 15th saw over £700bn in notional traded as outright SONIA.
- This activity is concentrated in short-dated instruments, suggesting it is closely related to expected rate moves by the BoE on January 30th.
- From an RFR-perspective, there has been no notable increase in long-dated SONIA activity.