- We present a uniquely Clarus view of the AUD IRS markets
- Our analysis of the regulatory landscape, bond issuance data and swap market flows suggests that many Swap Dealers will end-up in Add-On territory for OTC swaps clearing at CCPs
- This means that swaps become incrementally ever more expensive to trade relative to futures
- From a liquidity point of view, there is little difference between swaps and futures markets…
- …therefore portfolio margining between the two markets is key to reducing liquidity add-on exposures
- This has implications for incumbent banks looking to protect franchises against alternative liquidity providers in a cleared world….
- …and of course raises the question about any emerging CCP basis in AUD
- Our margin analytics software, CHARM, can be used to mitigate these dangers and optimise the opportunities.
Regulatory change is afoot
The central clearing mandate is coming ever closer in Australia. ASIC have a nicely concise website (written in clear, understandable English for once….) that explains the upcoming rules and their implementation.
From my interpretation, we are unlikely to see mandatory electronic trade execution any time soon, but the clearing mandate is about to come into force. ASIC provide the handy timeline below:
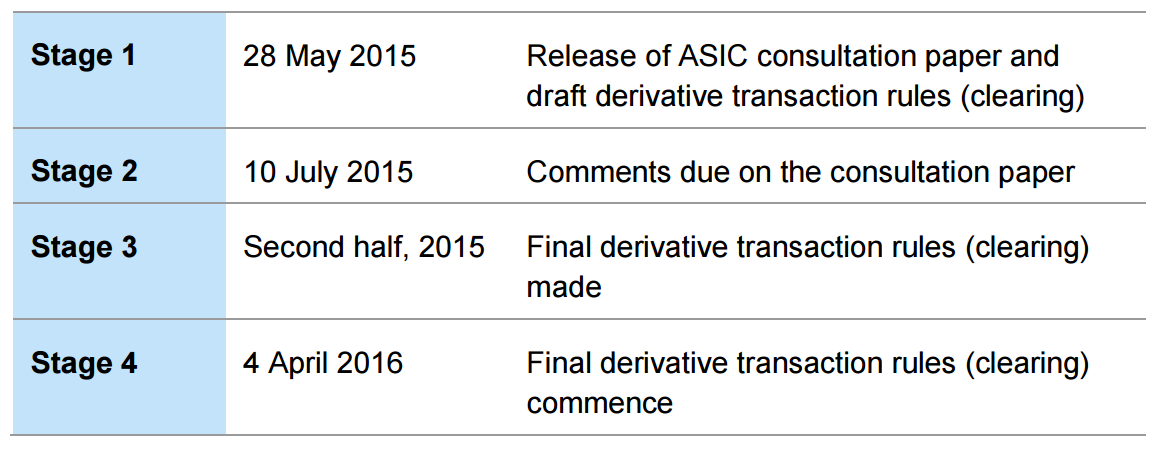
(The full consultation paper is here).
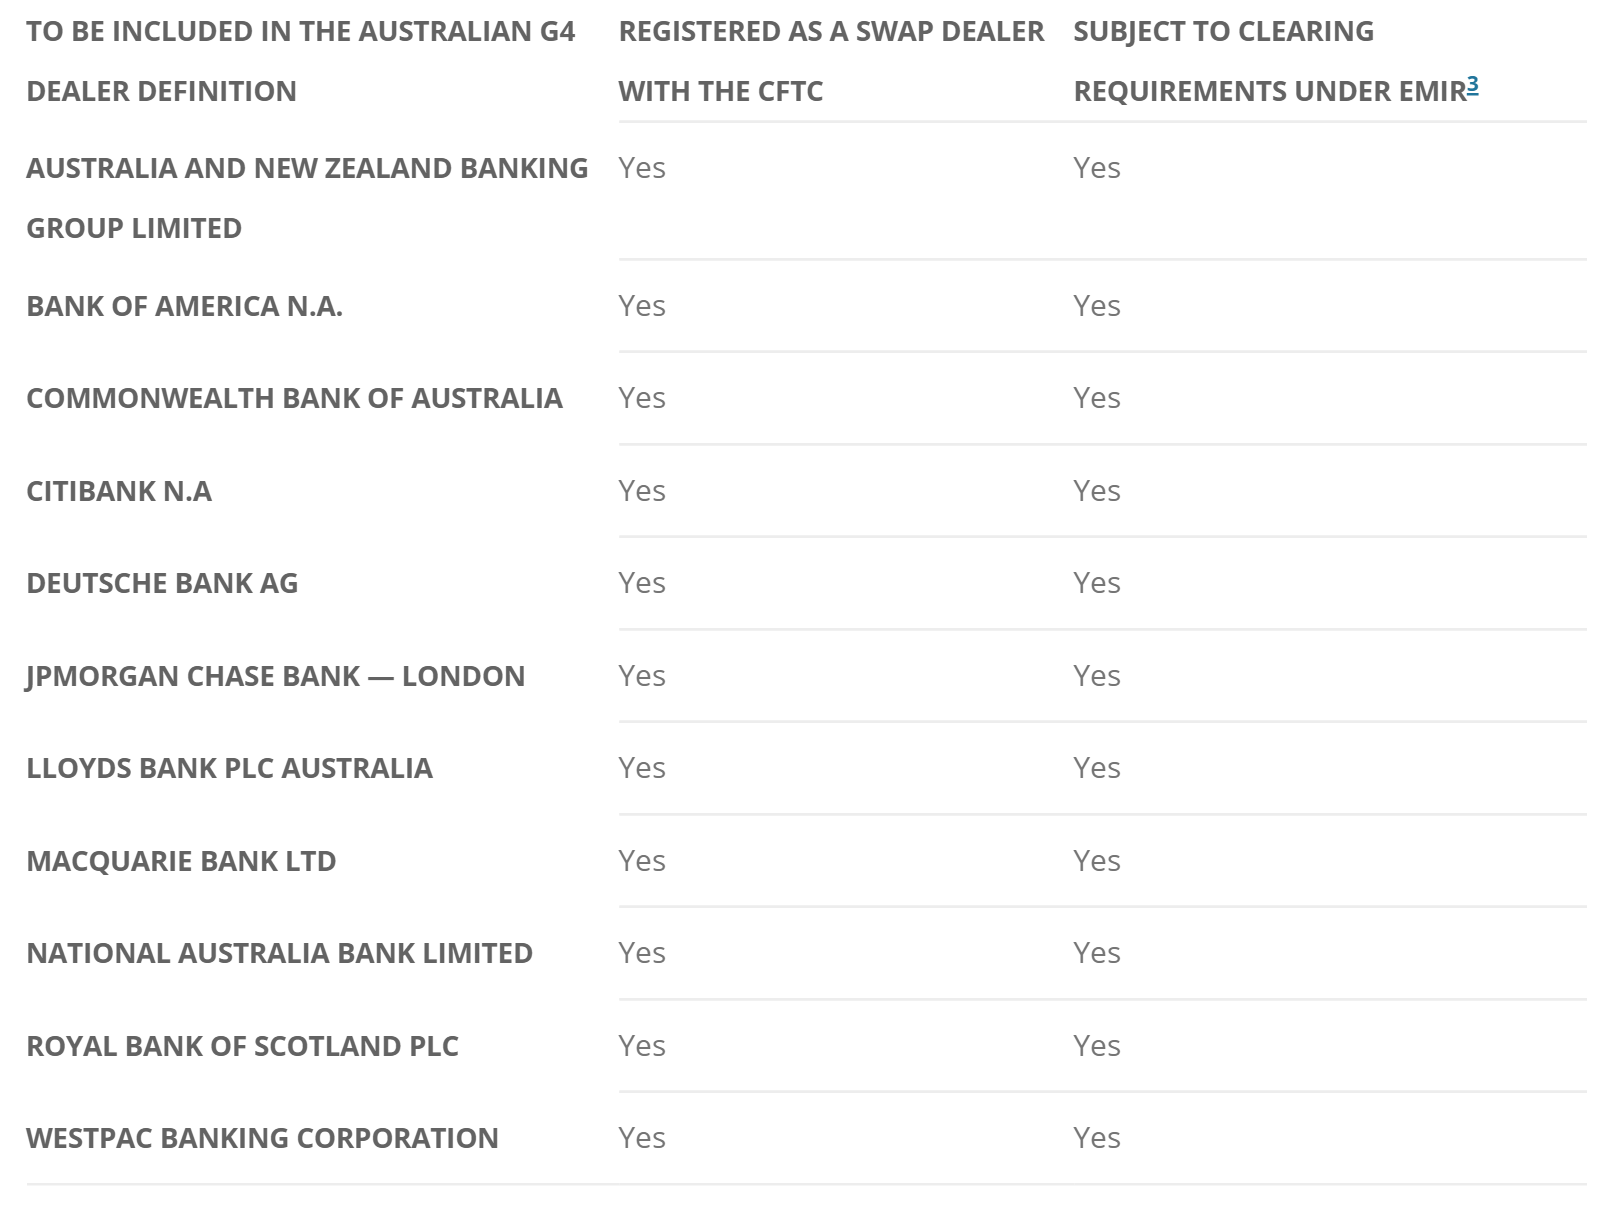
The decision as to whether a firm will be governed by the clearing mandate will be threshold based, depending on the volume of outstanding OTC derivatives. This is proposed to be set at $100bn, and the Australian Treasury expect the following firms (plus two more as-yet-unnamed firms) to be included in the Clearing Mandate. I don’t think there are any big surprises here:
So how big is $100bn?
Let’s assume for a moment that we are just talking Interest Rate Derivatives here. We can use CCPView to give users an idea of how big the AUD IRS market is in terms of both turnover and outstanding notional:
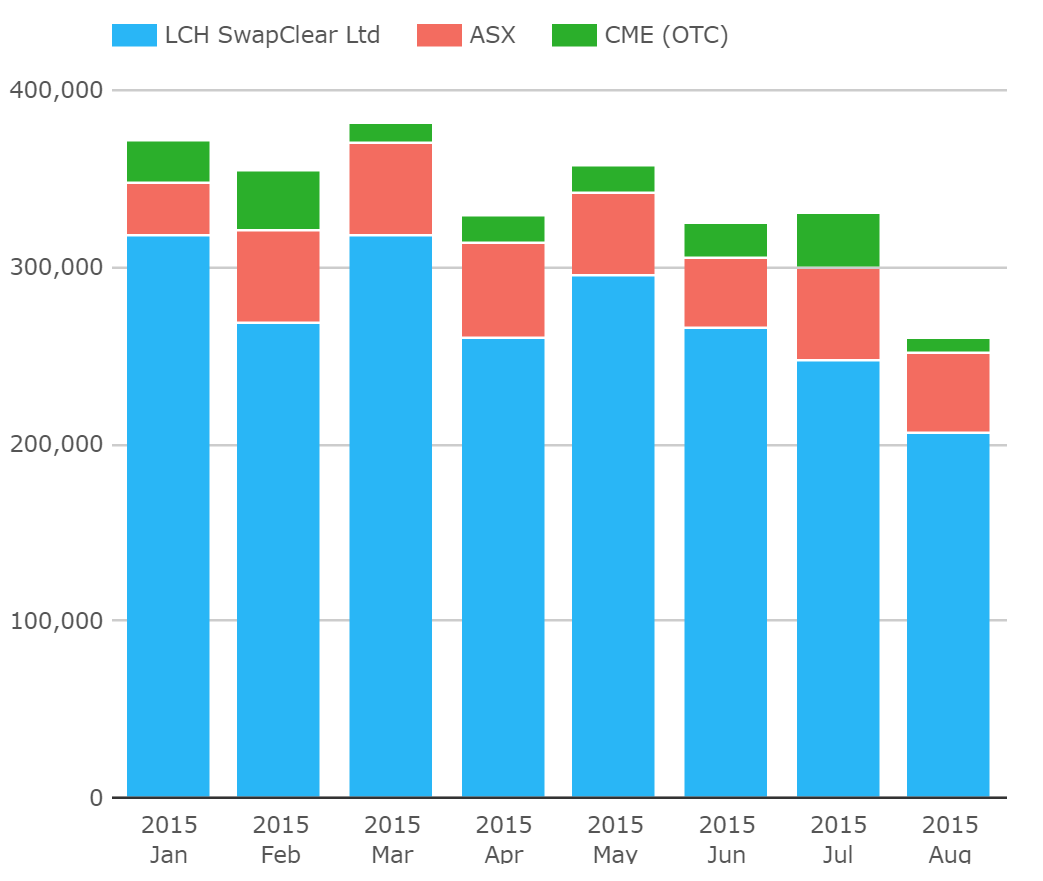
Showing;
- Average monthly turnover of $338bn.
- LCH with an 80% market share
- ASX with a remarkably stable share around 14-15%
- CME in third with 6% of the market.
That is solely looking at turnover data. So if the $338bn per month was equitably split between the 13 dealers, even starting from scratch, a dealer could expect to become subject to the clearing mandate within a paltry 4 months.
When we look at outstanding notional instead, it is an order of magnitude higher, at well over $4trn:
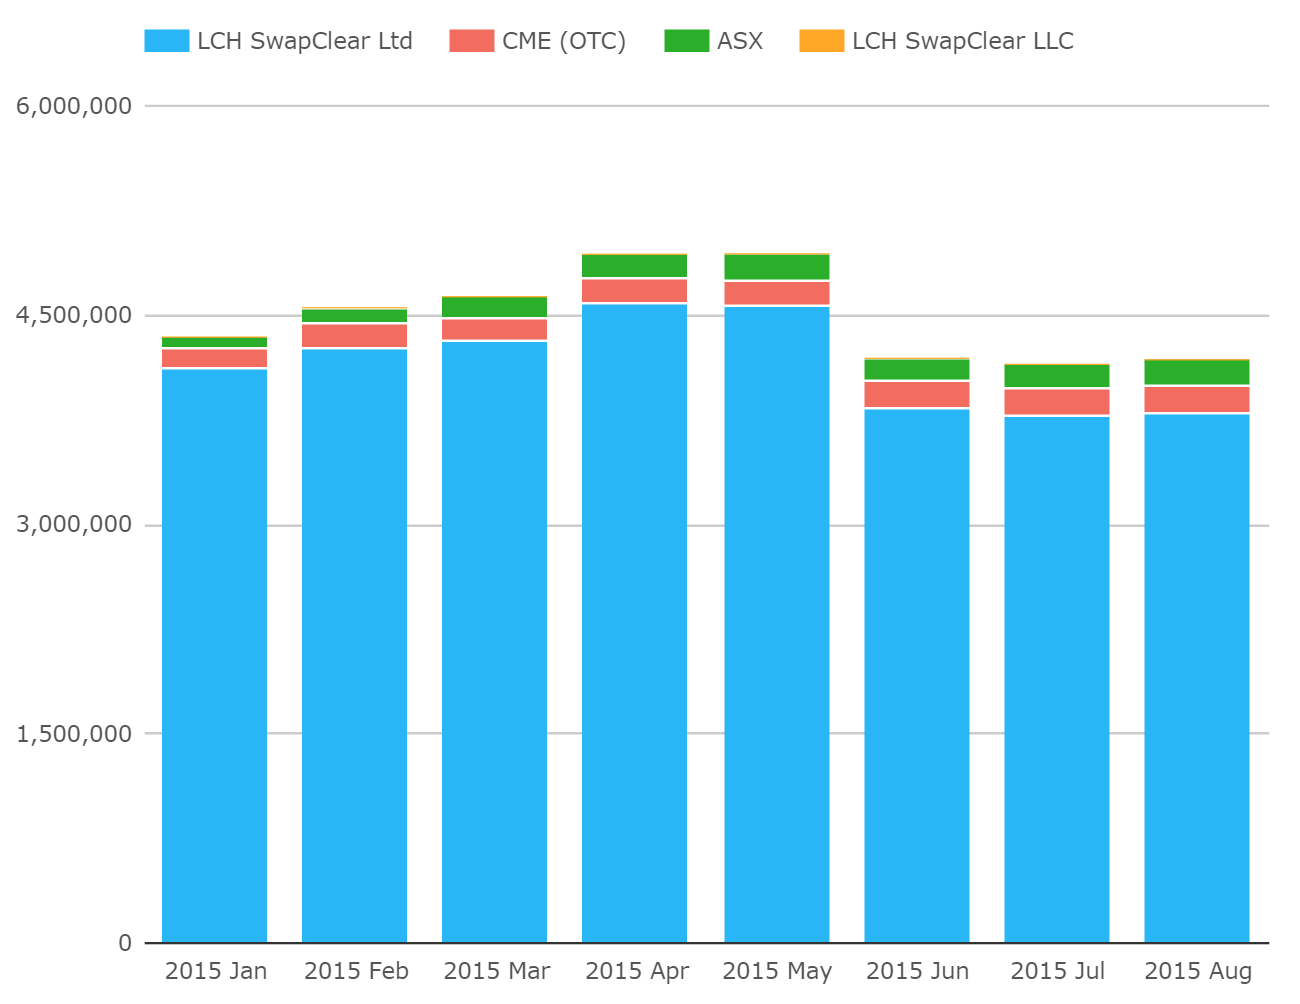
It’s therefore pretty safe to assume, (even with a big compression run in May 2015 at LCH) that those 13 firms won’t be able to compress themselves away from the mandate!
Perspective
The fact that the clearing threshold is relatively low compared to the total notional outstanding got me thinking about how relatively concentrated risk probably is in markets like AUD IRS. And whether this has an impact on Clearing – and hence the price of clearing.
So I’ll be using our margin analysis tool, CHARM, to churn some numbers.
But before I do that, I just want to highlight the Clearing Mandate itself.
The Clearing Mandate
Before we have a look at the swap margins, let’s just take a quick look at the AUD bond market. Kanga News provides issuance tables for AUD bonds, which are a pretty good proxy for AUD swap activity as well. For example, the deals that Commonwealth Bank have been involved with are here – and it is a fair bet they won the swaps with the issuer on most of those deals.
Looking at the names of the issuers (and hence the swap counterparties) is very instructive. Just as in the US, most of those bond issuers will be exempt from the Clearing mandate. Meaning that all of these end-users who want to receive fixed are missing the Clearing party!
In the case of the ASIC Clearing mandate, they are exempt largely because they do not fulfill the requirement to be an “ADI or AFS”:
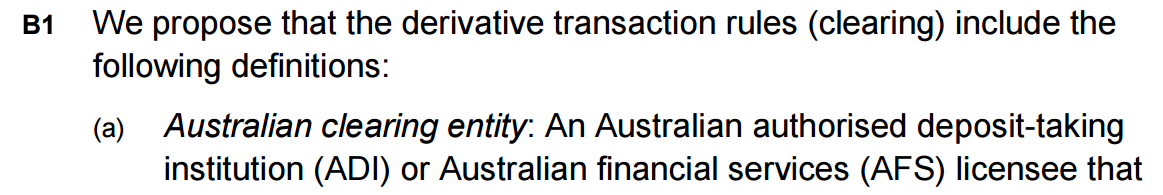
(Full paper here)
Adding fuel to the fire, there are a huge volume of deals from non-Australian entities being issued – according to Kanga, A$ 27.8bn YTD in 2015. Which again represent a pool of issuers who will be largely exempt from the clearing mandate.
To my mind, this risks creating a skewed clearing market place because the natural offset for this bond issuance business would be:
- Mortgage Books. The Australian property market is hot, leading to constant demand for fixed mortgages, and hence a steady supply of end-users looking to pay fixed.
- Asset managers buying kangaroo bonds. The buyers of these bonds are the local pension industry and other financial institutions (such as the big banks), looking for somewhere to invest their AUD banking reserves. They are buyers of these bonds because the issuers allow them to diversify their credit exposures away from a (potentially correlated) domestic pool of limited diversity. Some managers will naturally swap the fixed coupons out to manage their duration exposures – hence paying fixed on the swap as well.
This makes me worried that the natural pool of counterparties that offset the bond-issuance business are domestic, Australian financial institutions who are likely to become subject to the clearing mandate.
Tod wrote about a similar disequilibrium in the US that potentially causes the CME-LCH basis. In his blog he asked why bond-issuers are not taking advantage of the pricing differential.
Is there a possibility that the clearing mandate in Australia risks creating a similar imbalance?
I honestly do not know enough about the intricacies of the Australian swap market to answer that question.
But what I can say is that if it happens, the AUD swap market appears to be MORE susceptible to a pricing jump than USD.
Why?
Because of the relatively small size of concentration thresholds in OTC swap clearing…
Portfolio Costs, not trade-by-trade
I’m going to be dealing with some pretty big numbers here, so please bear in mind that I’m not just talking about the trade-by-trade business. I’m talking about the effect of building up very large positions over time.
Positions that can only be achieved by facilitating some massive trades – such as when you swap Apple’s recently issued, biggest-in-the-history-of-the-market Kangaroo issue!
This is when the power of CHARM is vital. AUD IRS Swap Dealers need to be analysing incremental IM at multiple clearing houses, across multiple products in real-time to ensure accurate swap pricing.
Concentration Limits?
Sadly, our market seems to hate standardisation, and so “Liquidity Add-Ons” are called different things by different clearing houses. What I am referring to is what the CME call “Concentration Margin” within their financial safeguards.
It’s not rocket science – if a clearing member has a position that is substantially larger than the market could absorb (even during normal conditions), then the CCP has a risk that, if this member were to default, they could not unwind the full size of the position. The CCP therefore charges substantially more Initial Margin above this threshold.
In CHARM, we call this a “Liquidity Add-On” – and if we look at the IM for a A$4bn 2 year swap, you can see what a significant component of the Initial Margin it is. From our drill-down screen:
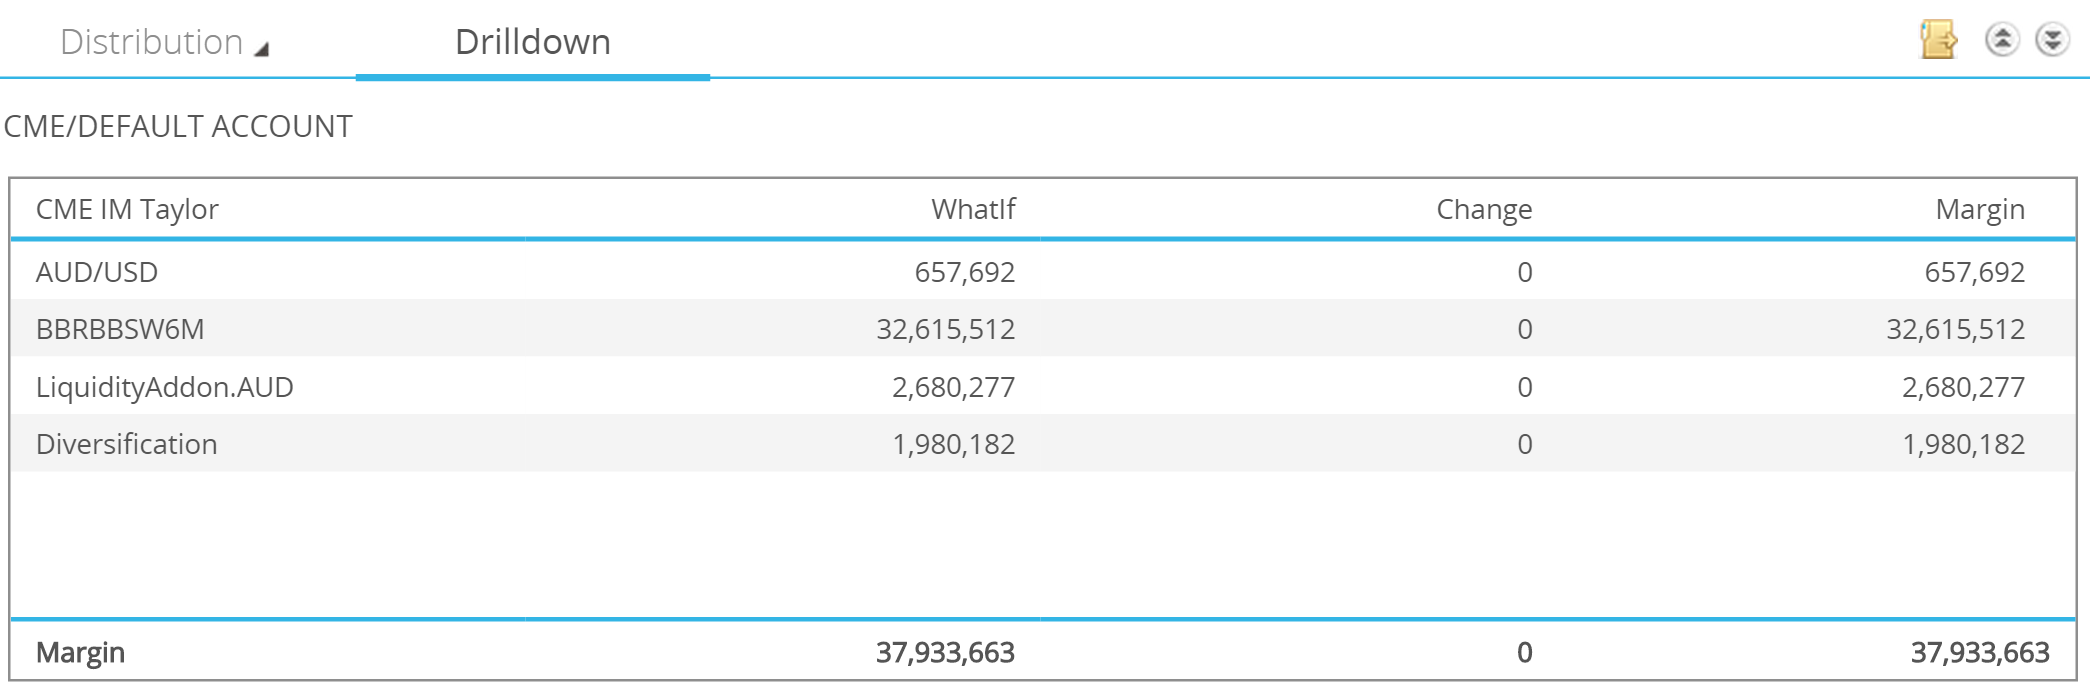
With this Liquidity Add-On making up such a significant component of the total IM, I asked myself: is the clearing world really set-up to accept a clearing mandate that potentially results in directional portfolios? Would this cause even more members to hit the concentration limits and hence suffer these Liquidity Add-Ons to IM – through no fault of their own? After all, they are probably running a largely delta-neutral portfolio if you include their uncleared franchises.
Let’s Look at Some Numbers
Let’s chart the change in IM as the overall portfolio increases in size for a single directional position in 2 year swaps cleared at the CME. The chart shows the change in IM with size:
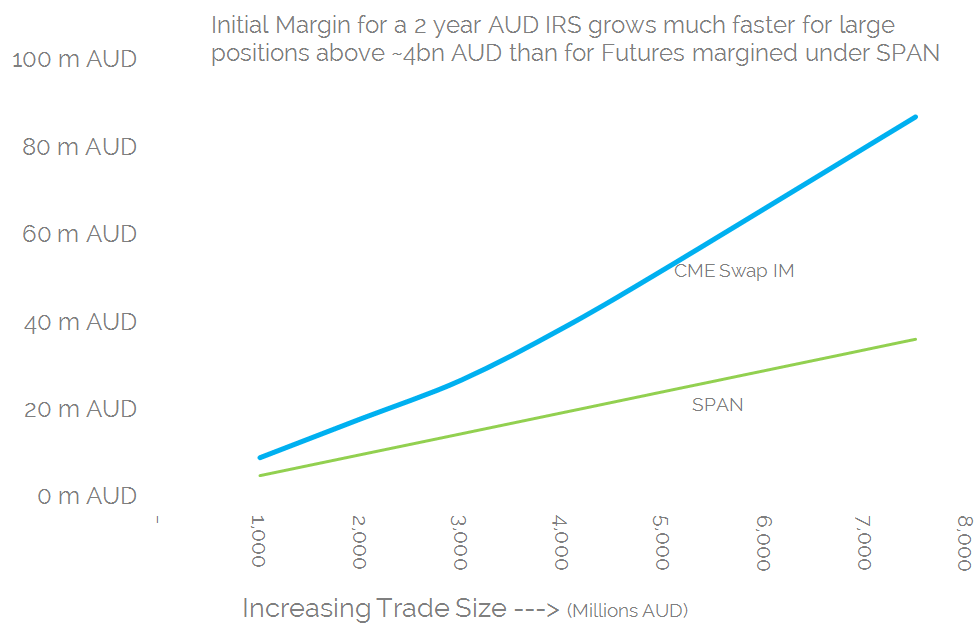
Notice:
- I’ve run the numbers through CHARM for the IM on a 2 year IRS vs 3m BBSW, cleared at CME.
- There is a clear “kink” between a A$3 billion and 4 billion swap, where the liquidity add-on kicks in.
- It seemed an obvious thing to check whether futures also include such a liquidity add-on.
- So I ran the numbers using PC-SPAN and the ASX’s parameter files here
- As you can see, SPAN is a “simple” linear calculation.
(Please note that the add-ons for LCH would chart a different path. Please contact us for details on these, you’ll need a trial to see the data!)
Funding this IM is expensive…..
Going on from here, I’ve therefore looked at the different incremental costs of funding this IM as a member’s portfolio gets larger and larger. Using CHARM, we can project how the Initial Margin will evolve with time, using our Forwards Scenario. For a 2 year AUD IRS, the funding profile looks much as you would expect – dropping to around 50% after one year:
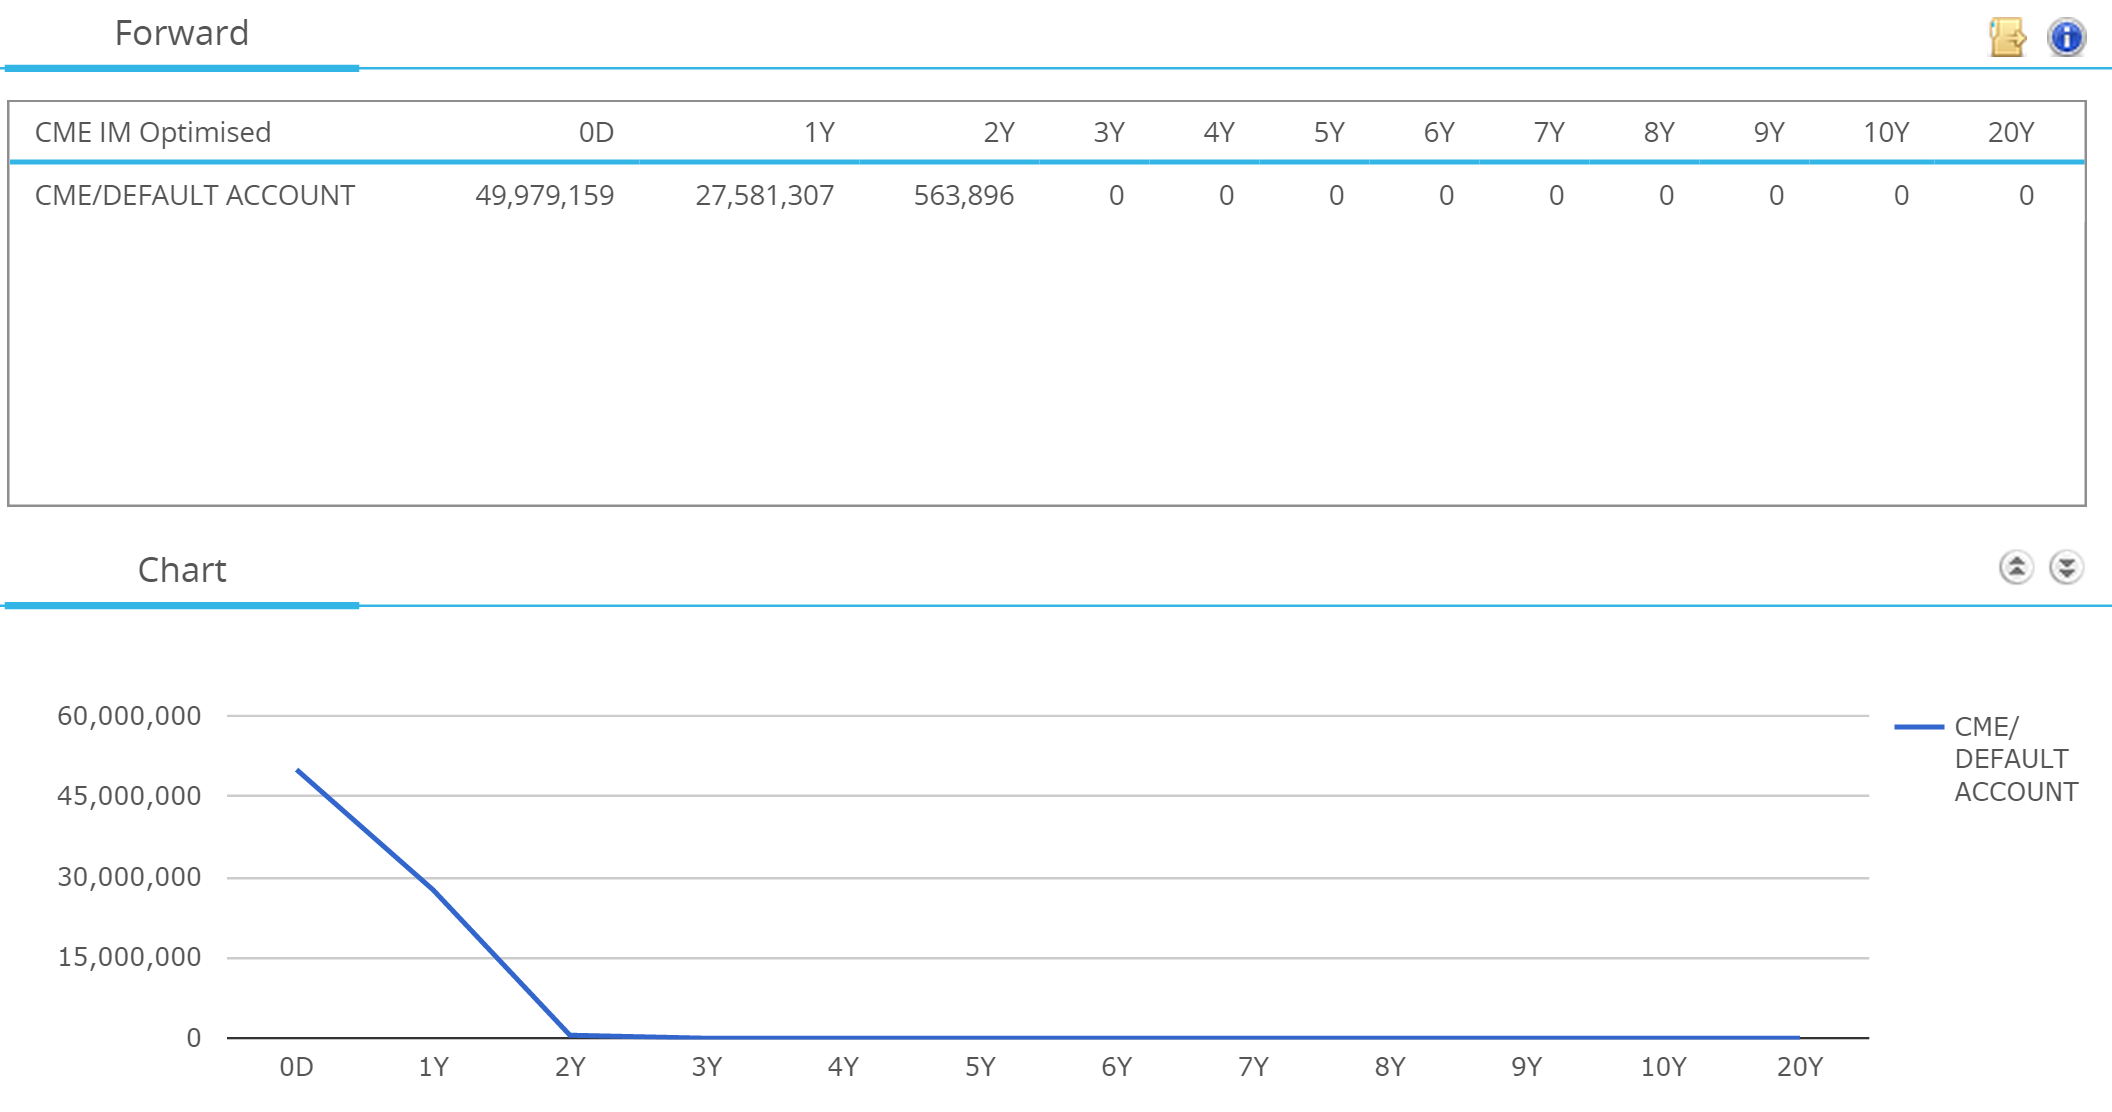
It’s therefore a small matter to add in a couple of funding assumptions – let’s be kind and assume banks can raise funds at a spread of around 50-75bp (broadly in line with the Fitch Financial CDS index).
We can now run a comparison between what it costs a dealer to trade a large portfolio of swaps above a certain threshold – versus doing so in futures.
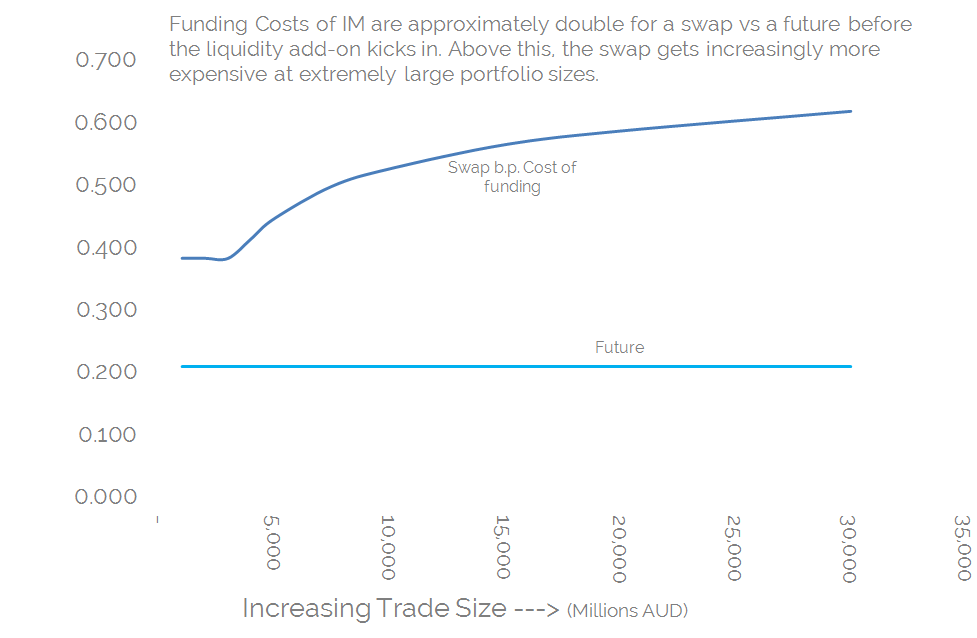
Showing;
- In line with other currencies and markets, Swaps are around 1.8 times as expensive in IM terms as futures for a “normal” portfolio.
- However, when you take into account the liquidity add-ons, swaps can quickly become three times more expensive for extremely large portfolios.
- In a market such as AUD IRS, where there are relatively few liquidity providers, it is very likely that most dealers will be in “add-on” territory at any given CCP – particularly at a CCP enjoying an 80% market share such as LCH.
- This is coupled with the fact that the liquidity threshold for the add-on in AUD IRS is much lower than for more liquid currencies such as EUR or USD.
…and it could prove to be even more expensive to the franchise
This has several commercial implications for the incumbent banks:
- It makes them susceptible to lose market share to alternative liquidity providers who trade only cleared swaps and hence maintain a close-to-neutral net position in swaps. These new participants could, theoretically, provide a tighter bid-offer due to a lower marginal cost of writing new business.
- Cleared swaps could show a natural skew in pricing relative to the futures strip – in the case of this analysis, dealers would be “axed” to pay fixed on a cleared 2-year IRS, therefore yields should be higher on swaps than implied by the futures strip.
- Portfolio margining of futures (STIRs and/or bonds) versus swaps should be an extremely compelling proposition for the market.
Swaps vs Futures
On that last point I thought I’d see if there was a difference in size between the swaps and futures markets.
For Swaps, the DTCC provides amalgamated volume data on a weekly basis for the AUD markets here. Table 2 suggests an average trade size of A$88m. Unfortunately, this is for all IRDs in all currencies, traded by Australian reporting institutions, and hence of limited value.
It’s much better to use SDRView to estimate average trade sizes. From here, we can see that in July the average trade size in 2 year AUD IRS was A$136m. This traded 122 times in the month – so let’s say around 5 times a day – giving us an average daily volume of A$700m. How does this stack-up against the (considerably cheaper) Futures market?
Packs and Bundles
Well the packs and bundles are not recording a whole lot of volume! When I checked the latest volumes today (14th September) they were stuck at zero. But prices are readily available, although in small size.
Some example liquidity is shown on the screenshot below. We are mainly interested in the 2-year bundle to compare to 2-year swaps. That is the fourth line down marked as “SFE RB Dec 15” (RB for Red Bundle):

This screenshot shows that the 2-year bundle is quoted a whopping 3 basis points wide in just 15 lots. This is equivalent to only A$15m for our 2-year swap. (For information, the fills are allocated as an average leg price).
The screenshot above also shows that the rest of the strip (white and red rows above) are quoted just 1 bp wide. This means that most traders would be happy to take the “legging” risk and trade the 8 front contracts individually rather than pay the bid-offer on the 2-year bundle in small size.
With at least 500 lots trading in each of the “red” contract months (A$500m equivalent) we can be fairly confident that actual volumes in STIR futures are almost equivalent to what we see reported to the SDR and DTCC each day in swaps.
So what I am saying?
With the caveat that I may be ignorant of a particular AUD-specific flow in the market, it does appear that the convenience of trading a 2-year swap for end-users may be coming to an end:
- Most AUD swap dealers will be hitting their liquidity add-ons for OTC IRS clearing.
- This is due to the concentrated nature of the market, and potentially, a clearing mandate that once again exempts a key client base from providing much needed off-setting flow.
- Futures markets do not incorporate the same liquidity add-ons.
- The cost of trading a Swap versus a future becomes increasingly prohibitive the further into liquidity add-on territory your OTC portfolio becomes.
- And from a market-liquidity perspective, daily volumes in 2-year STIRs look broadly equivalent to 2-year swaps.
- An Australian swap dealer may look to reduce their exposure to add-ons by paying fixed in swaps at LCH and hedging by buying futures against it.
- This market dynamic also highlights the value behind the ASX portfolio margining of futures versus OTC derivatives. Particularly when it incorporates even longer-dated risk such as 10 year AUD bonds….
- …but there is a risk that ASX will not be able to develop a balanced market – as directional business is transferred away from LCH, allowing swap dealers to duck under the LCH liquidity add-ons.
Whatever the causes, I want to highlight that once a swaps portfolio hits a liquidity add-on, the cost of funding IM becomes a huge hurdle to winning more customer business in a cleared world. And from my trading perspective, if I could save 0.5bp on every swap I traded through efficient margin management, it would mean:
- Winning more client business.
- Removing the costs associated with holding IM and VM balances at multiple clearing houses.
- Reducing the chances of alternative liquidity providers encroaching onto my bread-and-butter flow business.
To be able to do all of this in real-time, across your whole portfolio, and at every market you trade – you need CHARM.