- Our data shows that block trades are 30% larger than the amounts reported to SDRs.
- Block trades and trades capped at a reporting threshold make up just 7% of volume by trade count.
- However, the true size of these trades means they account for 43% of notional volume.
- This varies significantly from currency to currency.
This week, a couple of people have asked us to estimate the true size of trades reported to the SDRs. We take a look at the data.
Block Trading vs Capped Notionals
Whilst colloquially referred to as “block trades”, the following analysis actually looks at “capped notional” trades. There is a subtle difference, which I explored in a 2015 blog, “Identifying Customer Block Trades in the SDR Data“. In summary;
- Only Bloomberg and Tradeweb, the RFQ dealer-to-customer SEFs, actually report trades as “Block”.
- All D2D SEFs report Capped Notional trades, but they do not actually qualify for the “Block” designation.
- This is due to original No-Action Relief letter 14-118, which has since been extended to November 2020.
Anyway, the point of this blog is to look at the data to estimate the “true” size of trades reported to SDRs.
Capped Notionals
Swaps publicly reported to the SDRs have their notional amounts capped at certain thresholds. Page 78 here shows the original rule, with a handy table of sizes:
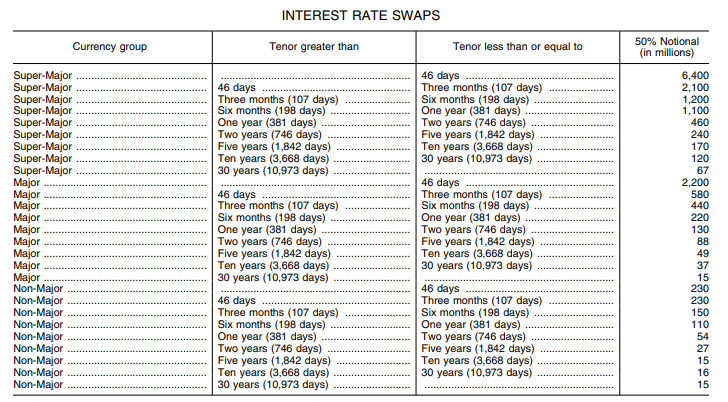
FIA also provide a good overview of the block regime (and “large notional off-facility swaps”) here.
What all this means is that for a five year swap in USD, EUR, JPY or GBP, the maximum size of swap that we see reported to the SDR is $240m-equivalent.
However, the day after that trade occurs, if it is transacted/processed on-SEF, then the full size of the swap is disclosed via SEF reporting (at instrument level, not at transaction level).
Therefore, by comparing SEF volumes to SDR volumes we can estimate the true size of trades that are otherwise reported with a cap at the threshold.
How Many Trades are We Talking About?
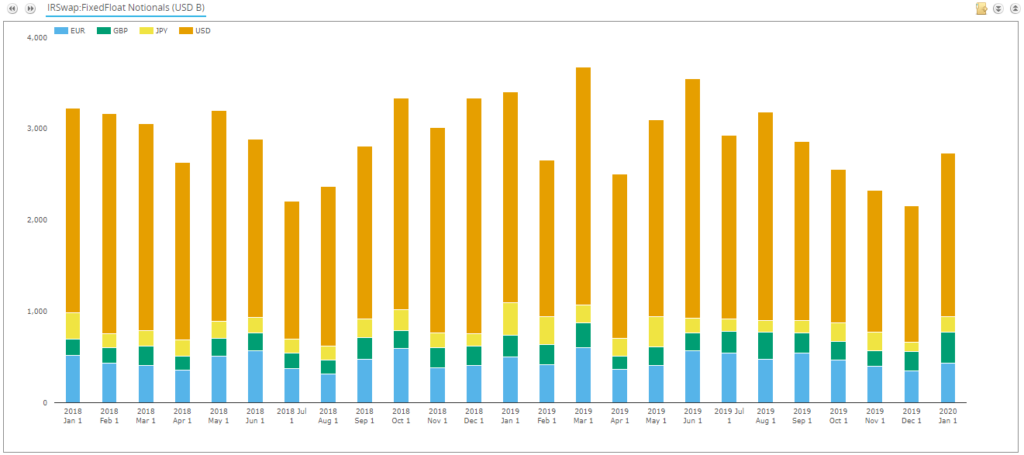
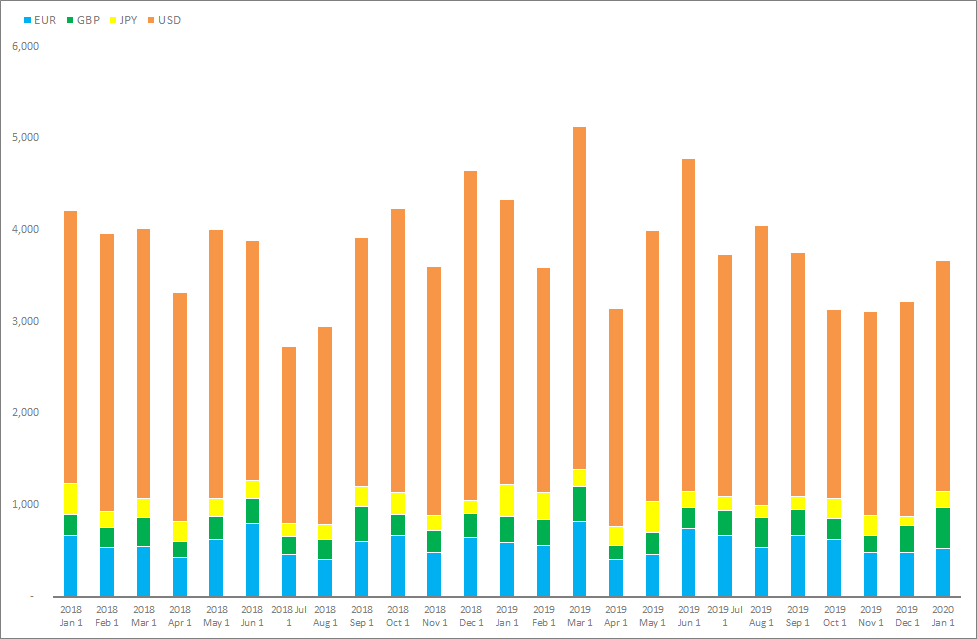
Here are the notional amounts of SEF trades reported to SDRs in the four “Super-Major” currencies over the past two years:
And here is the split by trade count into Capped notionals:
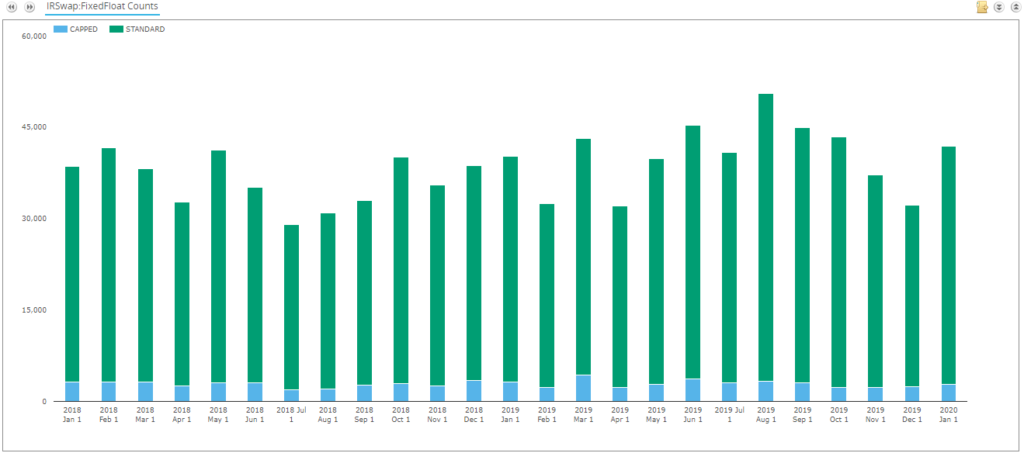
This chart therefore shows that just 7% by trade count (of SEF trades) are reported with notional amounts above the reporting threshold. So why do we care?
The same chart by notional shows a significantly different story:
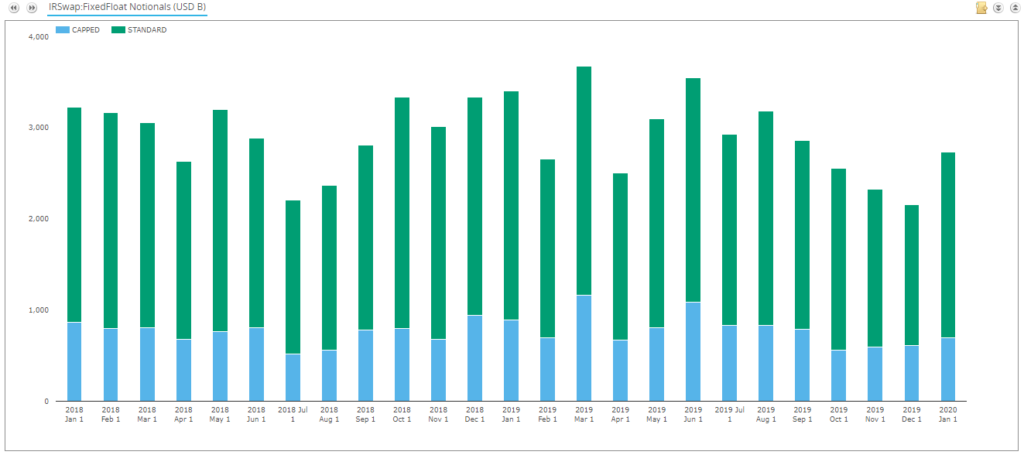
Showing that even at the capped thresholds, these trades account for 26% of notional reported to the SDRs.
So how much larger are the total amounts?
SEFView
SEFView, for the same time period and instruments, shows the following total volumes;
Showing that total notional amounts transacted on-SEF are almost ~$1trn per month higher than the totals we see in the SDR.
Estimating Block Sizes
Tying together the two data-sets, we can therefore engineer the appropriate scalars per currency:
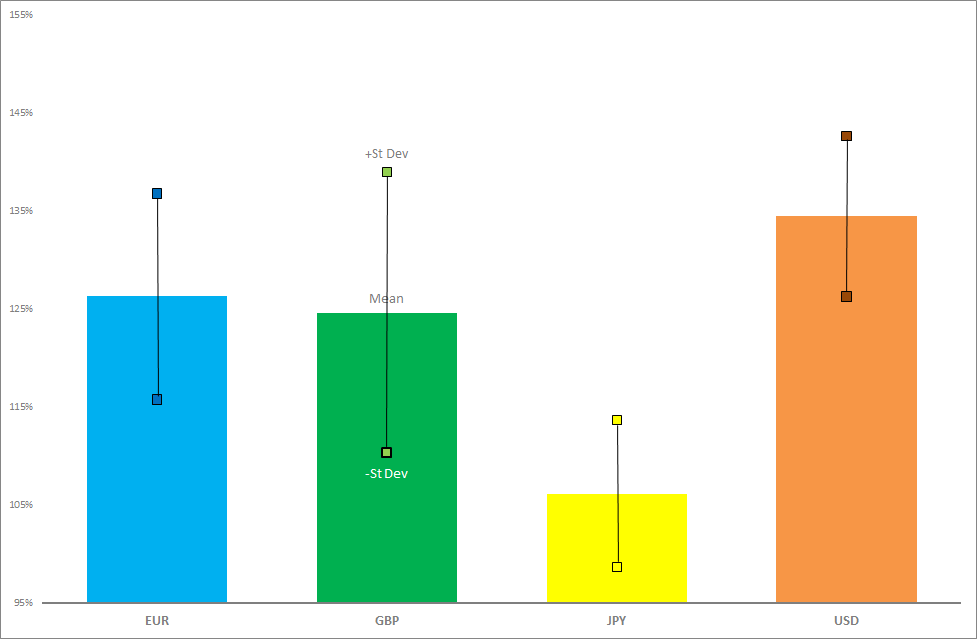
So, to answer the queston, just how large are block trades?
- In EUR, they are 26% larger than the reported amounts.
- In GBP, 25%.
- In JPY, 6%.
- And the most important, in USD 34%. (USD swaps account for the highest proportion of overall SDR volumes).
Please note that these averages vary month-on-month, as shown by the Standard Deviations (think of them as “errors”) marked on the charts. In any given month, total SEF USD volumes have been as much as 57% larger!
Across these super-major currencies, the total amount reported by SEFs has been 30% larger than reported to SDRs. This scalar between SDR and SEF volumes varies significantly from currency to currency.
Total Sizes per Month
If we therefore re-state the previous chart to show exactly how much notional is transacted as a “large” swap, we see the following;
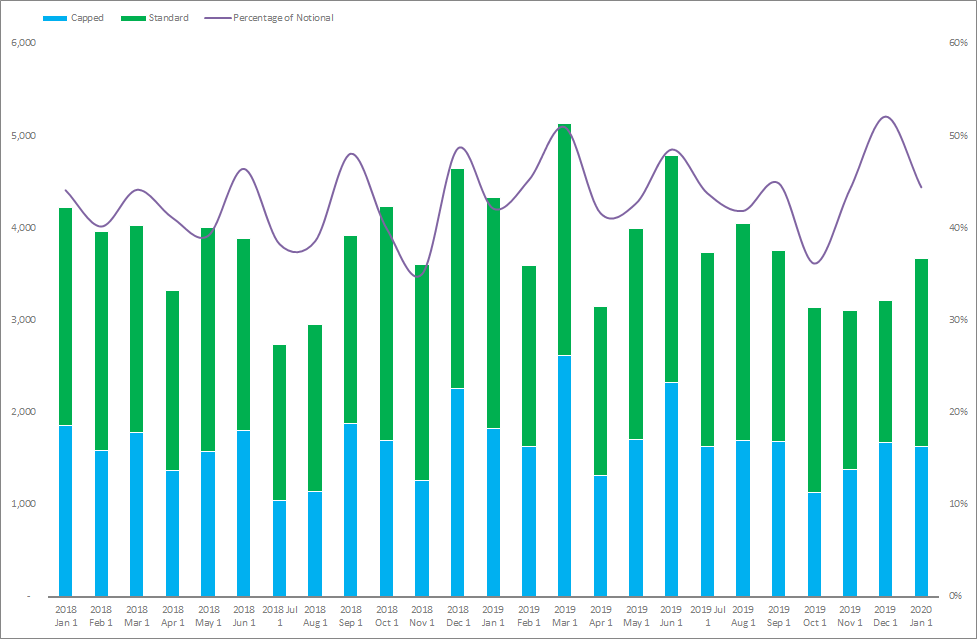
Showing;
- Across the four “Super-Major” currencies, un-capped notional amounts have been over $5trn in certain months.
- 43% of notional transacted on-SEF is as a “large” swap above the notional reporting threshold.
- This split between capped and standard notional amounts is fairly consistent (range: 35-52%, median 44%).
Therefore, to reiterate the point;
- 7% by trade count of swaps are above the block threshold.
- This rises to 43% when measured by notional.
Further Analysis
For those interested, we can analyse this data further, for example by;
- Repeating the analysis by maturity.
- Looking at trades transacted on “SEF-equivalent” platforms such as Yieldbroker for AUD.
- Look at different asset classes. Credit and NDFs are the obvious ones.
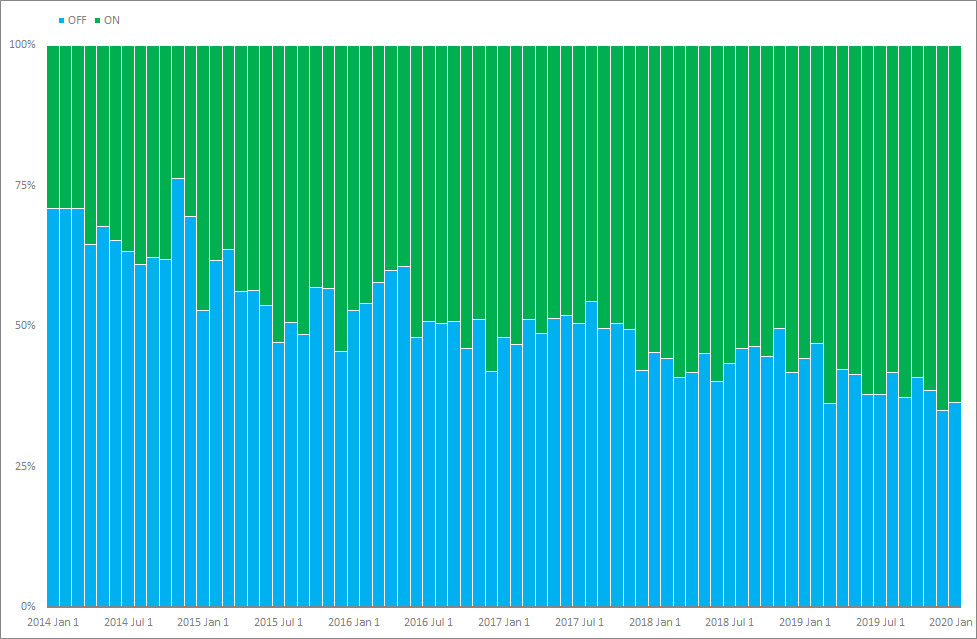
We can (probably) also estimate the proportion of the market that is now transacting as RFQ1. This might explain the trend towards more and more of these capped notional trades being executed on-SEF rather than off-SEF:
If you are interested to find out more, please contact us about a subscription to our data products.
In Summary
- SEF volumes in IRS are ~$1trn higher each month than are reported to SDRs.
- The difference in volume lies with large trades above the block thresholds, which do not report their full volumes.
- Our analysis shows that these trades are typically 30% larger than the capped notional that is reported.
- Overall, these capped trades make up just 7% of trades by trade count.
- But by notional, these capped trades account for 43% of volume.