- We look at the USDBRL market in the latest in a series of NDF blogs
- Clarus data covers over 66% of the market on a trade-by-trade basis
- For the Dealer-to-Dealer market alone, our coverage increases to 73%
- Our data shows that clearing has increased from 6% to 31% of dealer-to-dealer flows.
Bringing Old Blogs Up To Date
Sometimes an old blog can come back and surprise you. This happened recently when a client called and quoted a blog I wrote back in April 2016 – What’s Going On – NDF Trading 2016. In hindsight, I really wish that I had called that “What I think is Going On”!
With the publication of the BIS Data for April 2016, we now know more about the state of NDF Trading in 2016 than when I wrote that blog. Therefore, it is worth noting the following:
- From our most recent blog, our SDRView data generally covers anything from 30-60% of the whole market as measured by BIS data.
- For April 2016, we can make direct comparisons with the BIS data at a currency level.
- The USDBRL market shows the following Average Daily Volumes:
- BIS report an ADV of $18.7bn for April 2016
- SDRView has an ADV of $12.3bn for April 2016
SDRView therefore covers over 66% of the USDBRL market, which is higher than we see for some of the other NDFs.
The USDBRL NDF market is therefore one of the most transparent NDF markets out there.
Why the differences in Data?
Regular readers of our blogs will know all about our careful consideration of data sources. But for those of you in the FX world, you may not be so familiar with our Rates blogs. Therefore, let’s briefly recap where our data comes from:
- CCPView. Global Cleared Derivatives volumes, currency and product level.
- SDRView. Trade level, US-Named activity. (CFTC Part 43 data)
- SEFView. SEF-executed activity. (CFTC Part 16 data)
The granularity of the data sources also differs. For example, SDRView provides a trade-by-trade record of intraday activity with timestamps. That means we can look at how active the market is at certain times of the day:
Showing;
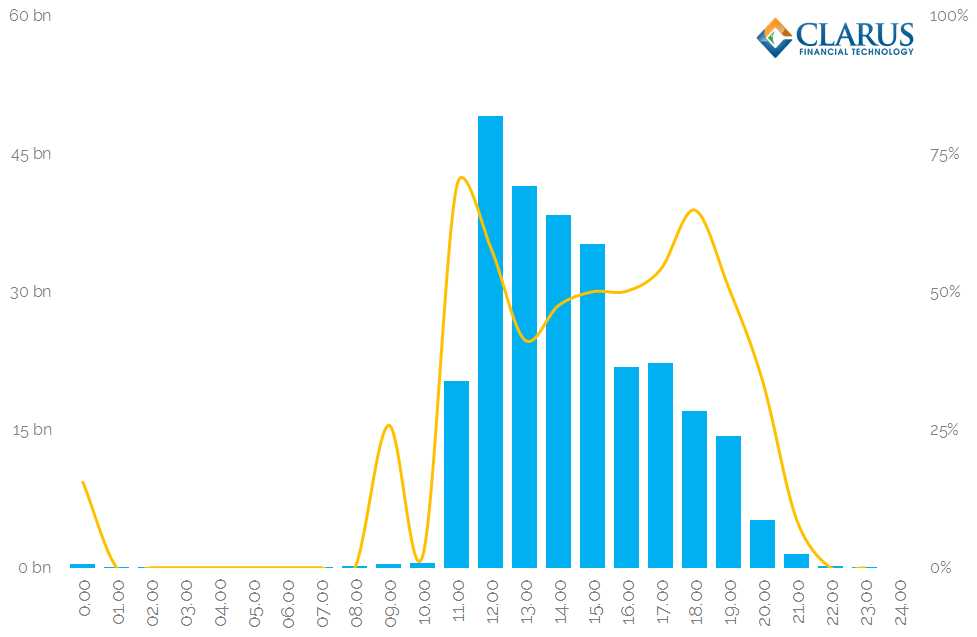
- For the month of October 2016, the total volume of USDBRL NDFs traded per hour of the day.
- Times are in UTC, which means New York Time plus 5 hours.
- USDBRL does not really trade outside of 6am until 2pm New York. This seems like a very short trading day to me?
- There is a clear “Market Open” at Midday UTC/7am New York which sees by far the largest volumes traded.
- Volumes drop off every single hour subsequent to this.
- There is no evidence of trading at the “close”, which is very different behaviour to that seen in Rates markets.
- I believe that this liquidity window is driven by the onshore spot market.
Half of the US Market Trades on-SEF
The orange line on the above chart shows the percentage of the market reported to the SDR that is transacted on-SEF during each hour. We can see that this peaks at nearly 75% at two points in the day – just before the “Open” at 11am UTC, and towards the London close at 18:00. For the rest of the day the percentage trading on-SEF is around 50%.
This is an interesting data point to dwell on. Our SEFView product, for example, shows that almost all volumes traded on-SEF are D2D volumes:
Showing;
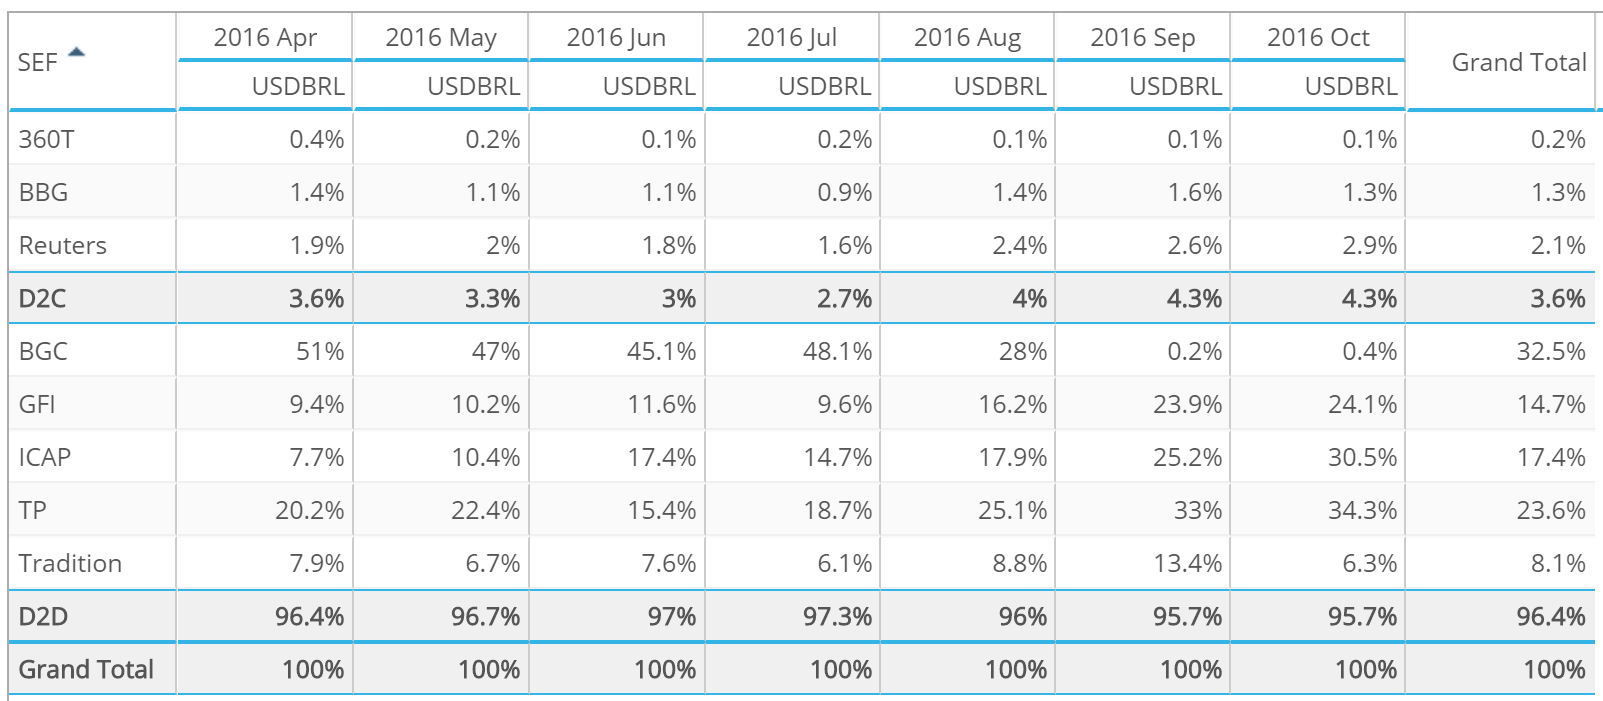
- Monthly volumes of USDBRL since April 2016 per SEF.
- The three SEFs that we recognise as D2C venues – 360T, Bloomberg and Reuters – make up just 3.6% of volumes year to date.
- SEF Volumes are hence dominated by Dealer-to-Dealer venues.
- There is some interesting market share data here – such as BGC dropping off a cliff since July, which I assume shows a transition to the GFI SEF handling the NDF business?
In summary, our data points to the following:
- All SEF volume is Dealer to Dealer.
- In April 2016, the Average Daily Volume traded on-SEF in USDBRL was $6.9bn.
- BIS figures suggest that the total market has an ADV in April 2016 of $18.653bn.
- BIS do not split out NDF volumes as D2D or D2C. However, they do so for other FX Forwards and this market has a 50/50 split.
- We also see a 50/50 split for On SEF (D2D) versus Off SEF (D2C) NDF trading in SDRView.
- Let’s therefore assume all NDF markets see a 50/50 split of volumes D2D vs D2C.
- That leads us to a D2D ADV in April 2016 of $9.46bn.
- This implies that our on-SEF data (in both SEFView and SDRView) covers 73% of the Dealer-to-Dealer market.
- Recall from the start of this blog that we have a 66% coverage of the overall market in SDRView (which includes both on-SEF and off-SEF volumes).
Triangulating Our Data Shows that 30% of the D2D Market is now Cleared
If we now combine our SEF traded data with the Cleared data that we collect in CCPView, we can see that:
- SEF markets are predominantly D2D (over 96% of volumes occur on IDB platforms).
- LCH’s ForexClear is clearing all of the USDBRL NDF volume.
- We assume that all ForexClear volumes are house clearing (the data is not split by house/client, so we assume 100% is house clearing).
Let’s look at the data for the past three months:
Showing;
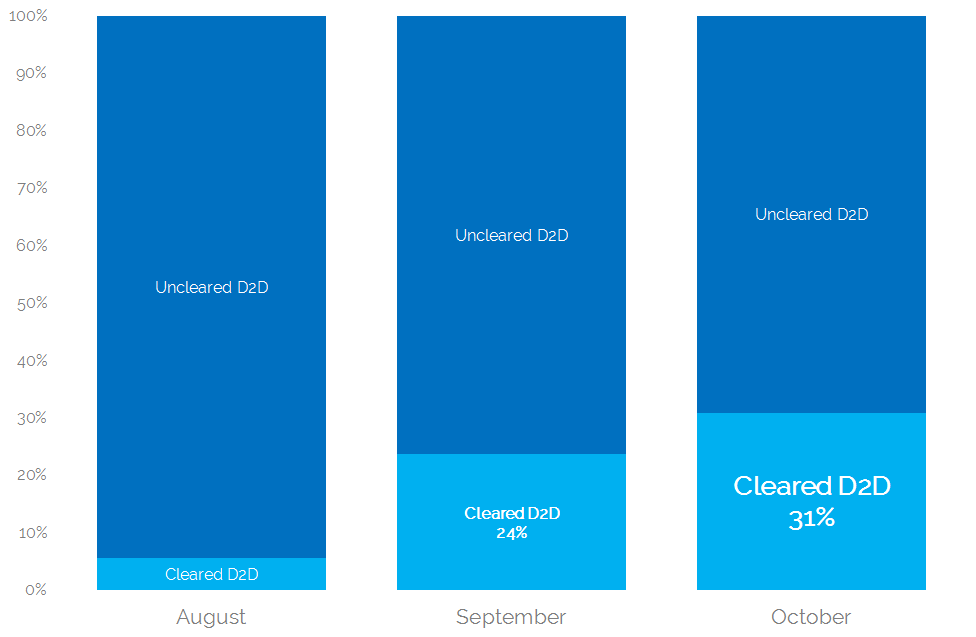
- Percentage of the D2D SEF Market that is calculated as Cleared by combining CCPView, SEFView and SDRView data sources together.
- We exclude all volumes reported to D2C SEFs (BBG, Reuters and 360T).
- We see that Clearing has really taken off in the dealer-to-dealer market.
- 31% of the D2D market executed on-SEF is now being Cleared, from just 6% back in August.
Data Analysis Suggest Trades are Cleared on a T+1 Basis
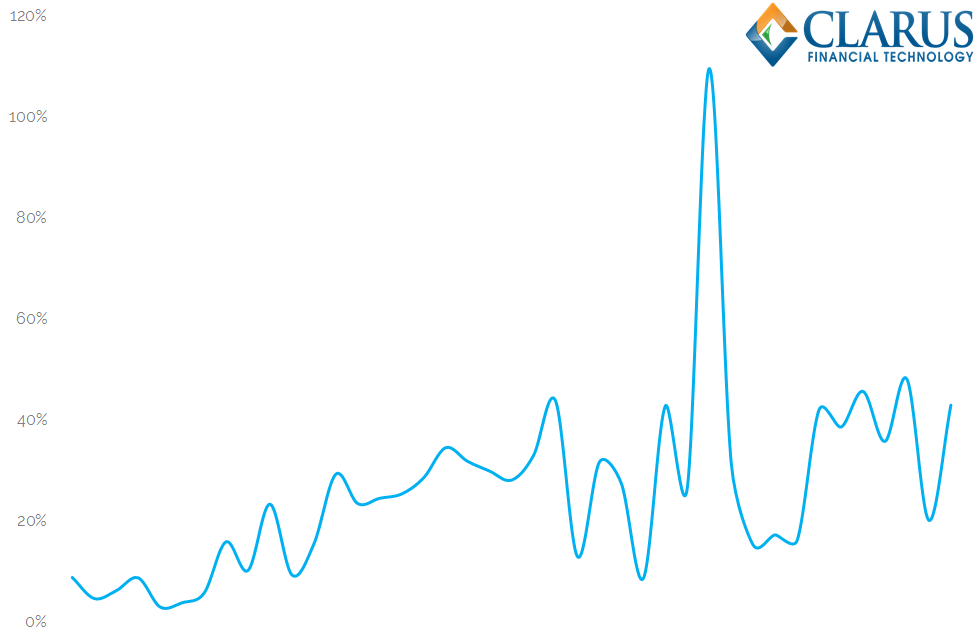
We can also infer how trades are cleared from the data. For example, on some days the volume of Cleared trades reported by the CCPs far exceeds the volume traded either on-SEF or across the whole market as reported in SDRView. There are two particular days that jump out – September 7th (Brazil Independence Day) and October 12th (Lady of Aparecida). Both were Brazilian holidays and hence USDBRL hardly traded at all. It therefore appears as if clearing is happening on a T+1 basis.
Therefore, let’s look at the percentage of the market that is cleared on a T+1 basis:
Showing;
- Volume of Clearing reported by ForexClear on day T divided by Volume reported by D2D SEFs on day T-1. (i.e. Clearing is assumed to occur the day after trading).
- From the beginning of September to the end of October, the uptake of Clearing in the D2D community has continued to increase according to this measure.
- On average, 31% of D2D volumes during October were cleared.
- 39% of D2D volumes were cleared during the last week of October.
In Summary
- The shift towards clearing in NDF markets has been very quick.
- We reported last time that over 10% of the global NDF markets were Cleared.
- This time, we refine that estimate by taking an in-depth look at the interdealer USDBRL market.
- We conclude that over 30% of the D2D market that is executed on-SEF is now being cleared.
- The availability of this public data has greatly increased the level of transparency in the NDF markets, allowing us to make sense of shifting market trends.