- We update our periodic look at NDF markets for 2016.
- Over $1.1 trn in NDFs are regularly reported each month to SDRs.
- With up to 50% of the market traded on-SEF.
- March 2016 saw record volumes transacted on-SEF with over $500bn trading for the first time.
- Global cleared volumes have increased to nearly $75bn per month in the past year.
- With this growth mainly coming from non-US Persons.
- We wonder if the September 2016 implementation of margin for uncleared derivatives will move this SEF-executed business into Clearing?
One of Those Days
Not quite one of Those Days, but I doubt Candide trades FX. Below is a fairly typical day for NDF trading from SDRView:
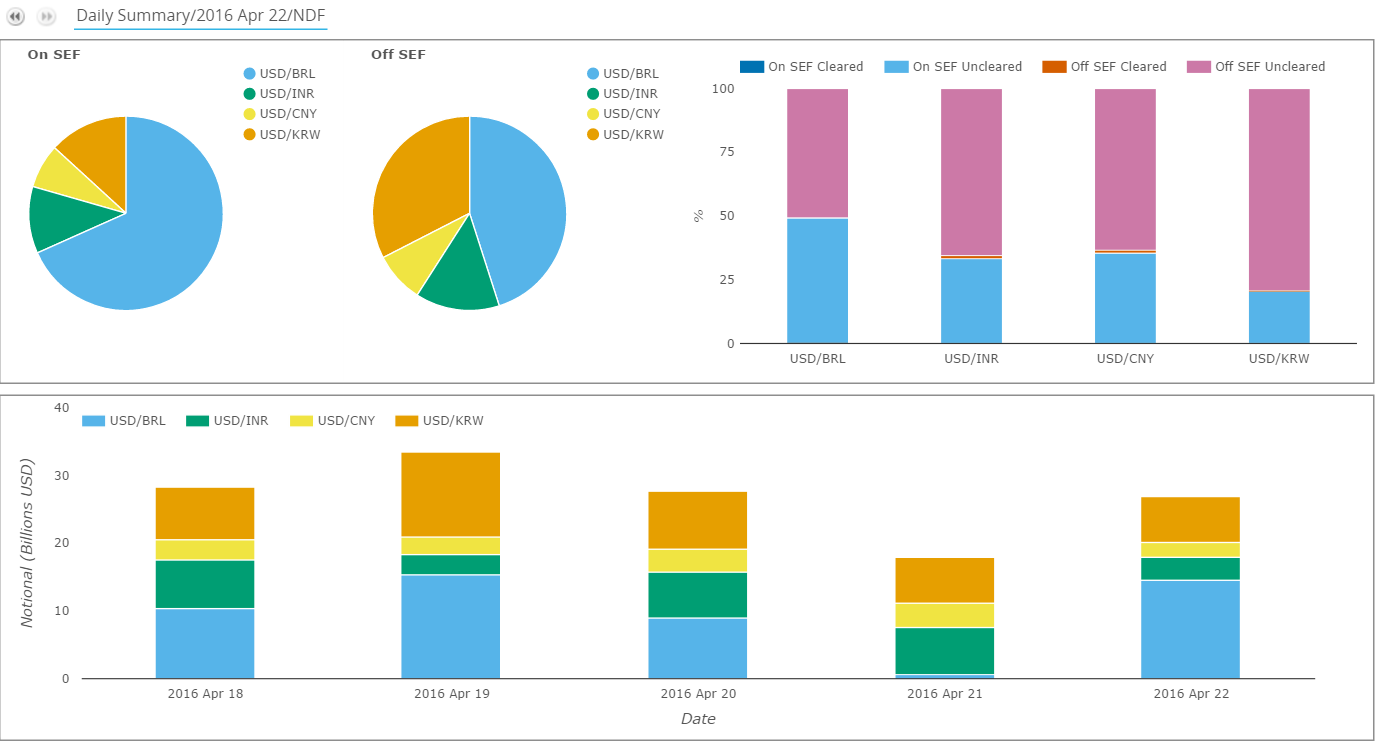
Showing;
- USD/BRL is consistently the largest traded pair in notional terms. This applies to both On and Off SEF trading.
- USD/BRL sees around 50% of volumes traded off-SEF, larger than the other 3 pairs.
- Of these 4 pairs, USD/KRW has the lowest percentage of notional traded on-SEF, at 20%.
- The vast majority of volumes are uncleared across all currency pairs.
- 1% of both USD/INR and USD/CNY volumes are cleared.
2016 Versus 2014 & 2015
How does this compare to our previous look at NDFs? You can quickly take a look at the blog we wrote last year (and in 2014) to remind yourself. But we can also use our Year-On-Year comparison tool in SDRView Res to quickly compare volumes side-by-side.
First, total volumes for the first four months of 2015 vs 2016 for the four largest currency pairs:
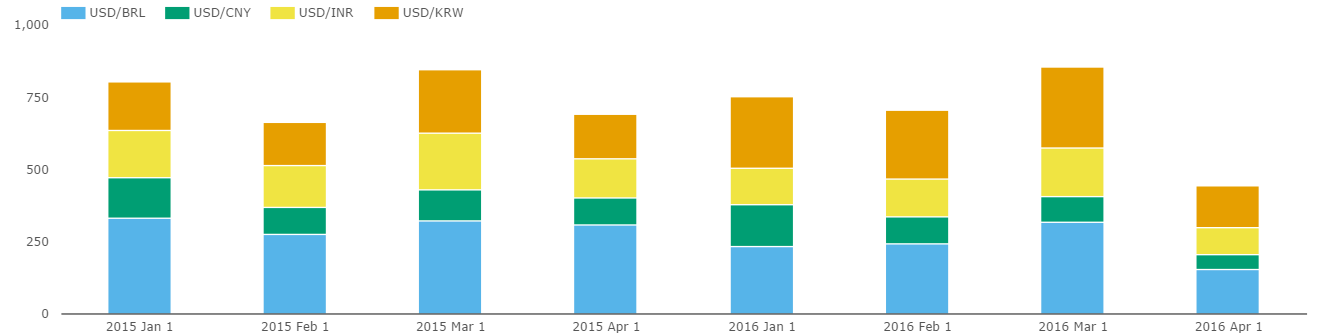
Showing;
- The first four months of 2015 as the 4 bars on the left, with the 2016 figures on the right
- Volumes are remarkably similar for the two years
- The average monthly volume in Q1 2015 was $772bn vs $770bn in Q1 2016
- The currency split has, however, changed.
- In 2015, USD/BRL accounted for 41% of trading, and USD/KRW was second at 23%.
- In 2016, the USD/BRL share of the market has fallen to 35%, with USD/KRW picking up the slack. USD/KRW now accounts for almost as much trading as USD/BRL at 33% of volumes.
And next the percentages traded on and off SEF:
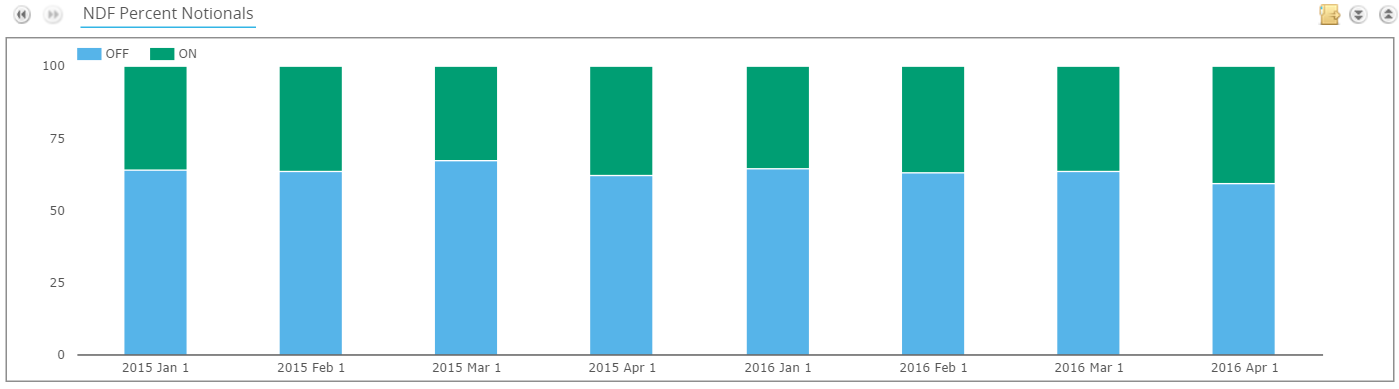
Showing;
- The choice of execution venue has been consistent.
- In Q1 2015, on-SEF execution accounted for 36% of volumes.
- In Q1 2016, this was up slightly to 37%.
And what about Cleared volumes? I was a little surprised by this chart:
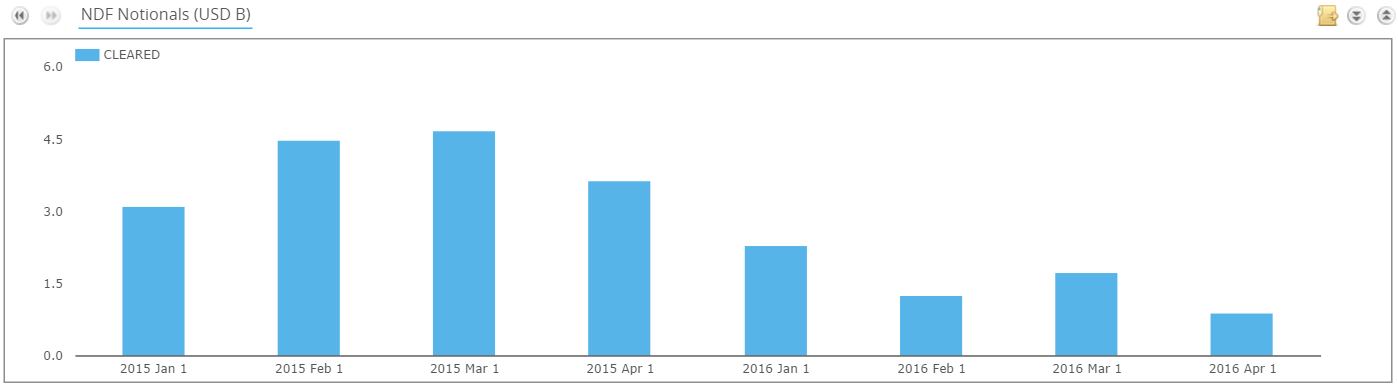
Showing;
- Volumes reported to the SDRs as “Cleared” have decreased since last year.
- Q1 2015 saw a monthly average cleared volume of $4bn.
- This decreased in Q1 2016 to $1.77bn.
- That is a bit surprising given that overall volumes have otherwise been static.
To my mind, it is even more surprising given the upcoming rules on margin for uncleared derivatives, that will encompass NDF trades. So let’s use CCPView to drill down into these volumes for the broader market – not just US Persons.
CCPView and NDFs
First, let’s look at 2015 through to 2016 for all NDF volumes in CCPView:
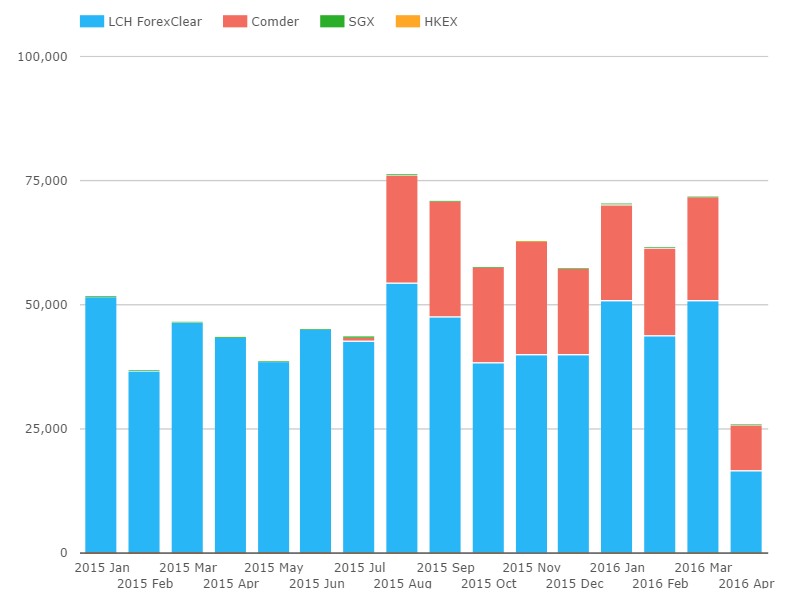
Showing;
- LCH ForexClear volumes in blue, Comder in red, with SGX and HKEX having occasional volumes.
- LCH volumes in 2016 have actually been higher than the equivalent time period in 2015.
- LCH ForexClear saw record volumes in August 2015, and volumes have been running close to these levels in both January and March of 2016, at over $50bn per month.
- LCH ForexClear saw average monthly volumes of $45bn in Q1 2015.
- This has risen to $48.5bn in Q1 2016, an 8% rise.
- It is important to note that the amounts cleared at ForexClear are much higher than we see reported by US Persons to the SDRs.
- This tells us that the wider market saw a contrary trend to the US portion of the market.
- It’s fair to say that this ForexClear growth is therefore coming from the non-US Persons part of the market.
- We first started collecting data for Comder in August of 2015.
- Comder volumes are exclusively in USD/CLP NDF’s and the CLF/CLP rate.
Overall, CCPView paints a far rosier picture for NDF clearing than we see from SDRView. A lesson in why it’s important to understand the data sources being used.
With the uncleared margin rules beginning to kick-in as of September 2016 for the largest entities, we have to think that the multi-lateral netting benefits of Clearing alone will be enough to see more and more banks (and clients) beginning to clear NDFs. It feels like one to watch.
SEF Market Share
Finally, it would be amiss not to do a quick fact-check on the market share for SEF-trading in NDFs.
Whilst doing so, it is worth noting that over $400bn per month regularly trades, and yet most of it is uncleared. Given this portion of the market are already happy with transparency and (we assume) the benefits of electronic execution, surely they are a prime portion of the market to transition to clearing?
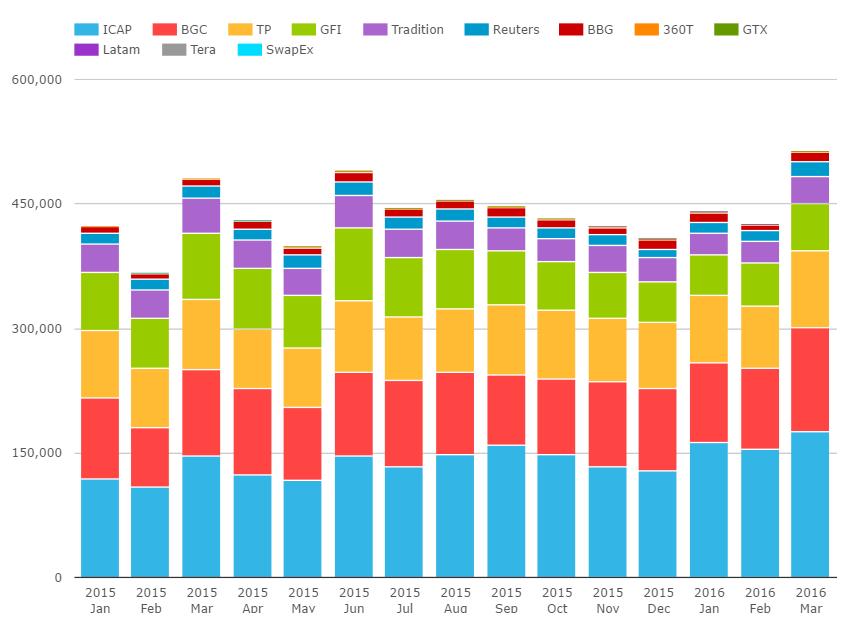
Showing;
- March 2016 as the record ever month for NDFs executed on-SEF. That’s quite timely!
- ICAP out front, with market share recently surpassing 35% and seemingly growing.
- BGC consistently in second place, with market share around 20-24%
- 3rd and 4th places have also been consistently awarded to TP and then GFI.
- Trads are the “best of the rest” in 5th place with a market share hovering around 6-8%.
- Of the remaining platforms, we classify them all as “Dealer to Client” venues, but their volumes are considerably smaller than for the dealer community.
- Again, this is broadly consistent with our look at the market back in 2015.
In Summary
- SEF’s have recently seen their biggest ever volumes in NDF trading
- Clearing of NDF’s has increased in the past year, despite static overall volumes
- Despite a large portion of the market being comfortable with electronic execution on-SEF and the benefits of transparency, Clearing is still only a small portion of the market.
- With the margin for uncleared derivatives rules coming into play in September 2016, we expect to see Cleared volumes increasing throughout the rest of this year.
- We need to closely monitor the data to see if we are correct!