- Credit Derivative volumes have been huge in 2022.
- YTD volume data shows that 2022 will likely see all-time record volumes.
- Volumes are already $6.6Trn larger than at the same point in 2021.
- We analyse the Cleared market in Index and Single Name CDS.
- SBSDRView reveals the most active names across uncleared and cleared CDS.
We’ve written frequently about Credit markets this year. The topics are diverse, covering:
- Quarterly CRD review of volumes – Q1 and Q2.
- Novel SBSDR data and most actively traded single name CDS.
- Russian CDS and derivative volumes.
A healthy presence for CDS on this blog means that there is something going on in the underlying markets. With central banks shifting (shifted?) to a hawkish policy stance and increasingly restrictive interest rates, one of the big questions for markets is whether central banks can engineer a “soft landing” and avoid deep recessions. Nowhere is this more pertinent than credit markets. No matter where the eventual neutral monetary stance lies, the number and magnitude of credit events will be defined by the depth of any upcoming recession. What will default rates (and recovery rates) be like on the far side of a recession? It is a big unknown, and has seemingly led to a huge amount of trading in Credit derivatives this year.
65% More Trading Anyone?
CCPView analyses global cleared volumes. We can use the data to run Year to Date (YTD) volumes in all Credit Derivatives up to the end of August each year. 2022 is a stand-out year:
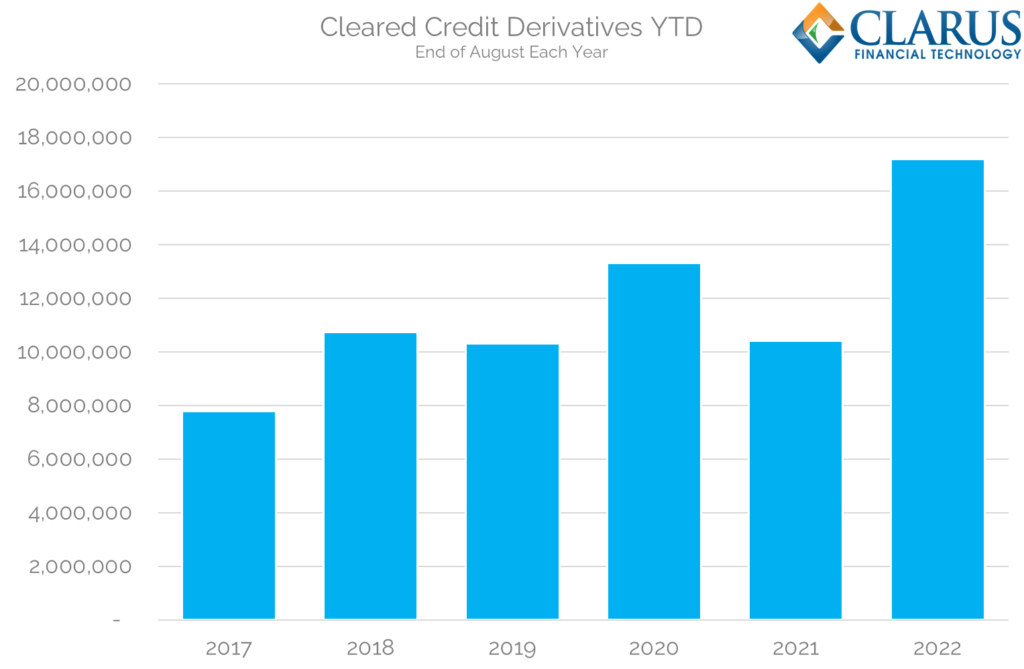
Showing;
- Notional volumes in millions of USD of all Credit Derivatives cleared at CCPs. This is across the global market, but excludes any uncleared volumes (which are typically <5% of the largest market, CDS Index).
- 2022 sees volumes 29% higher than any other January-August period.
- This snapshot of YTD volumes is before the semi-annual spike of volumes each September, therefore is likely representative of price-forming trading.
- Volumes were remarkably stable in 2018, 2019 and 2021, with the pandemic-fueled trading during 2020 really standing out.
- However, 2022 is looking to set all-time records for CRD volumes.
- Volumes are 65% higher so far this year compared to January-August 2021.
How Have CDS Indices Performed?
Most of the volume growth has occurred in the Index products, as these dominate trading in overall cleared Credit Derivatives:
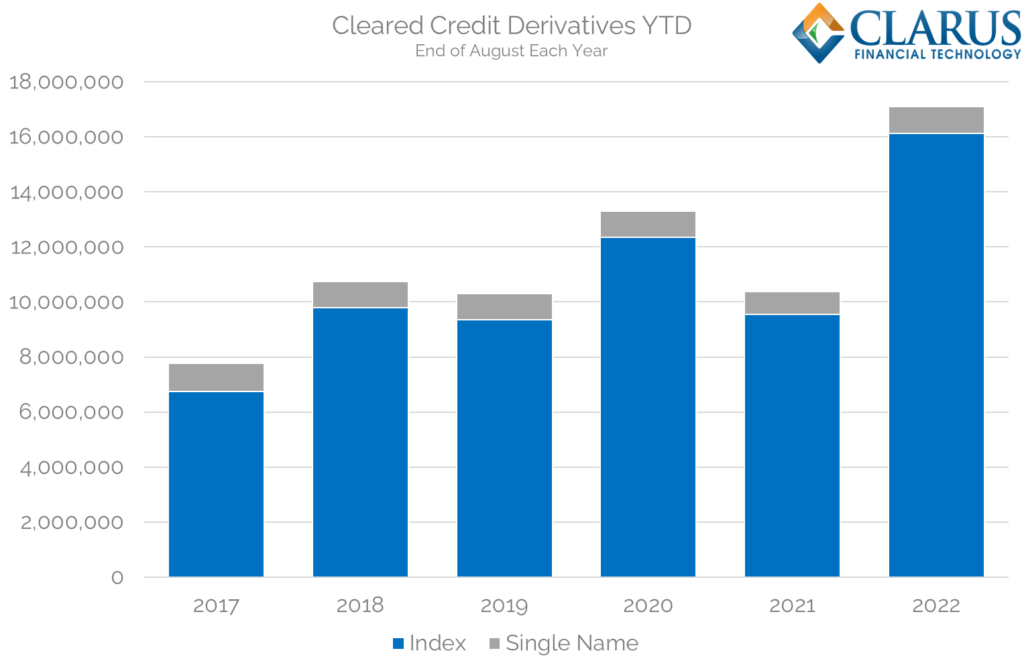
Showing;
- Index trading has powered the growth.
- Volumes are 69% higher to the 19th August 2022 compared to end of August 2021.
- These are 31% higher than the previous record, set in 2020.
- In nominal terms, Indices have traded some $6.6Trn more than last year!
- In fact, volumes so far in 2022 are within 5% of the total that traded during the whole year of 2021.
Which Indices have powered the growth?
An extra $6.6Trn in notional has to be traded in something….which precise indices have powered the growth?
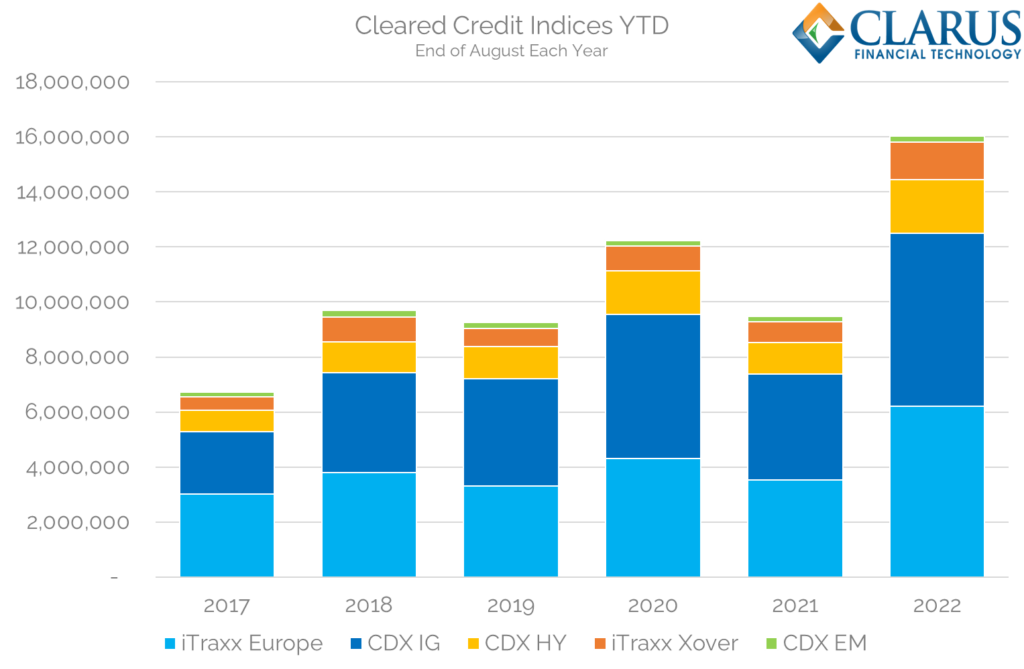
Showing;
- Volumes in iTraxx Europe have grown by $2.7Trn, or 76%, since 2021.
- Volumes in CDX Investment Grade have grown by $2.4Trn, or 63%.
- CDX EM is the “laggard” with only 10% growth, and already started at a low base compared to the other indices.
- Another $1.4Trn in trading activity was added across CDX High Yield and iTraxx XOver indices.
To reiterate, compared to 2021, volumes are up by 69% in CRD Index trading, and are up 31% compared to 2020 (the previous record year).
And in Single Names?
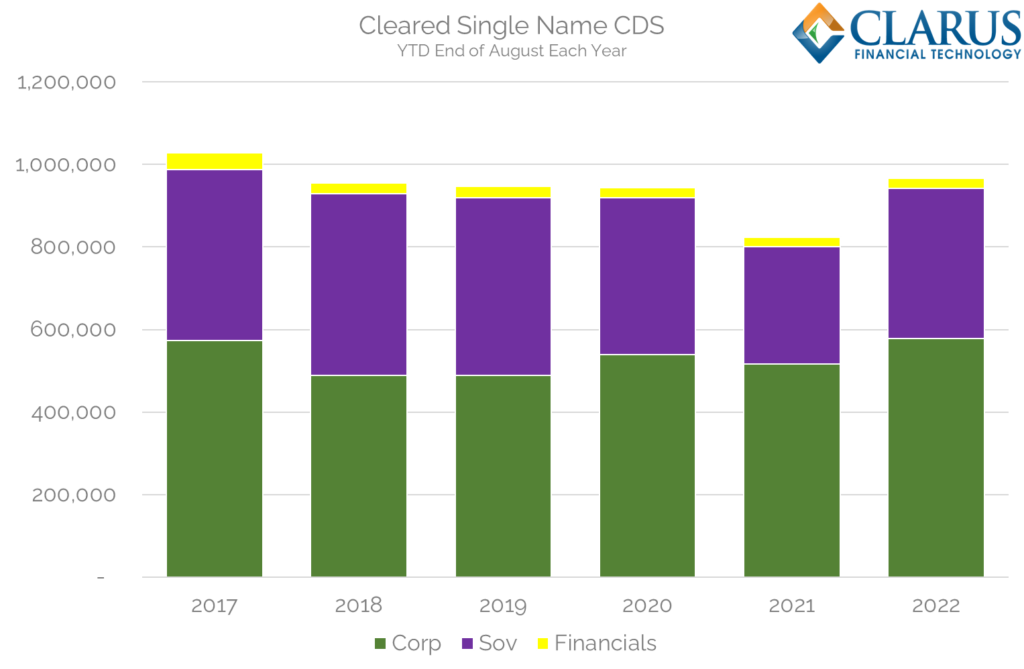
Showing;
- Volumes in Single Name CDS are higher than last year
- But are pretty much in line with 2018-2020…
- Volumes YTD are actually slightly below a similar period in 2017 (January-August).
I find this surprising given the large amounts of activity seen in CDS Index trading? I guess we know the Index volumes are not being driven by basis trading (packages that trade single names vs the index).
We now have considerable insight into US persons single name CDS trading via SBSDR, so let’s take a look.
What Does US Data Show?
Our latest data product, SBSDRView, reveals the most actively traded CDS Single Names each month. The data was first made available in February 2022.
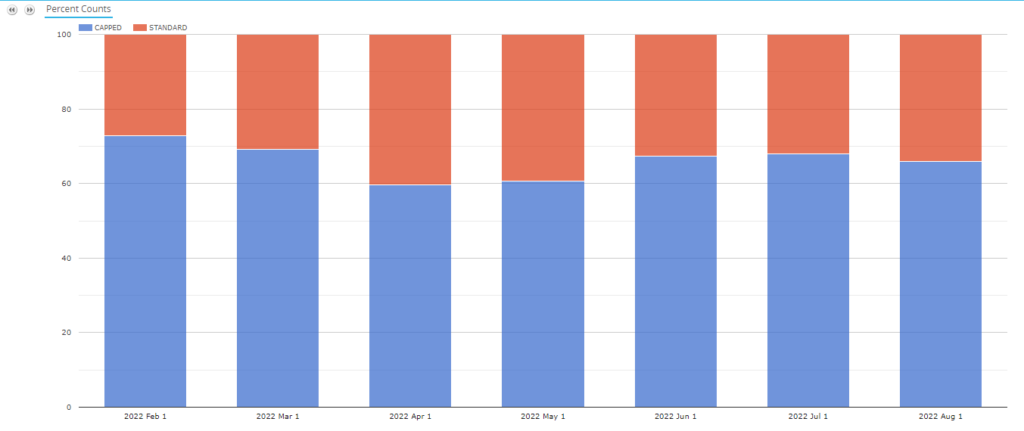
In Single Name CDS, we see over 12,500 trades reported to SBSDRs each month. Unfortunately, around 40% are reported at the capped threshold of $5m, which we really hope to see revised upward in due course. However, we can still judge trends over time. We see that:
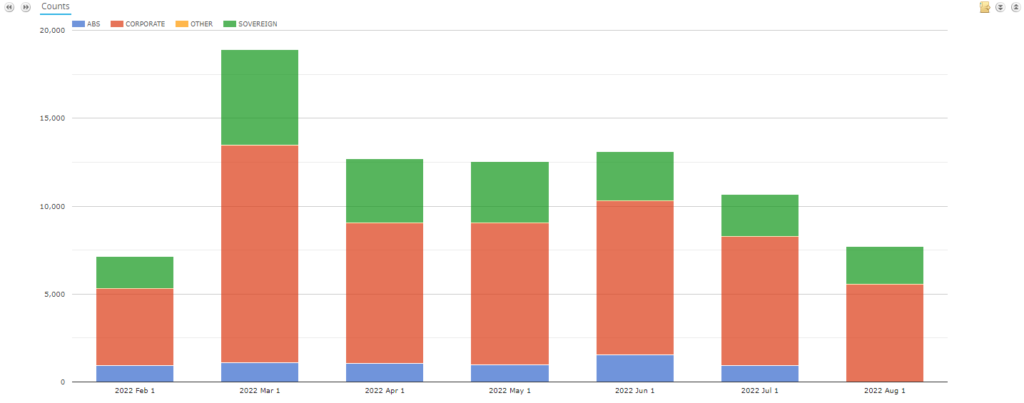
- Corporates make up the largest portion of trading each month, accounting for about 66% of all trades.
- Sovereigns are next up. These trade in larger notional sizes, so over 65% of trades are above the $5m trade cap for these single name sovereigns:
And a reminder (for myself as well as you readers) that Single Name CDS remains a largely uncleared market. Only about 13% of volumes (by notional) are reported as cleared:
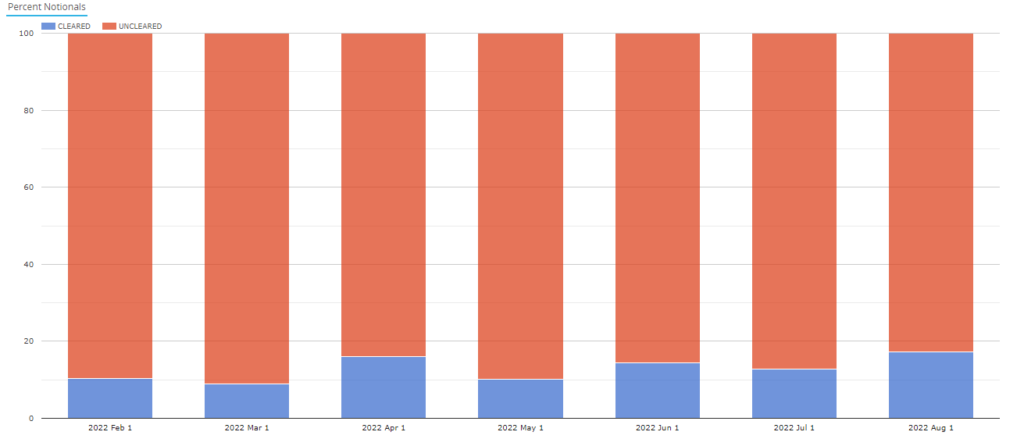
This varies between Sovereigns and Corporates, with April a particular high point for clearing, seeing 26% of single name corporate CDS reported as cleared (by trade number).
Our Most Active view in SBSDRView reveals which names are most popular. Looking at the most recent complete month (July 2022):
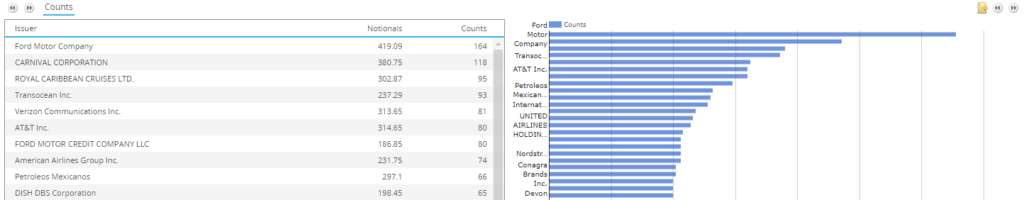
Across both Cleared and Uncleared markets:
- Ford was the most traded single name corporate CDS, trading 164 times.
- It holds quite a lead over Carnival at number 2, which traded 118 times.
We can look at just the Cleared volumes, which reveals:
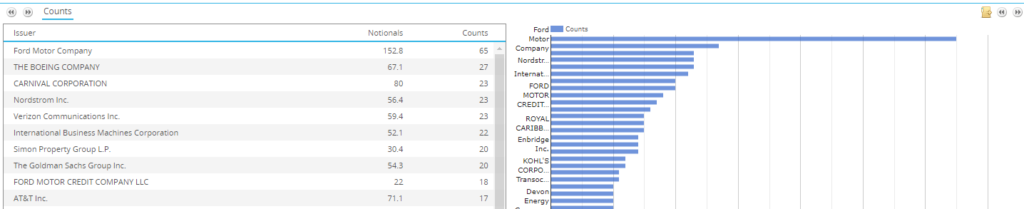
- Ford is also the most traded name in clearing. 40% of trades (65 out of 164) were cleared.
- Carnival drops to 3, and only sees 20% of trades cleared.
- Goldmans, with 20 cleared trades, saw 50% of trades cleared (40 trades in total means it scrapes into the top 50 most active names overall).
I find it surprising that the clearing rates vary so much from name to name. What is it exactly that is motivating the two counterparties to clear? Is it only D2D activity and much of the reported trades are D2C? One to ponder in future blogs, including looking at the clearing rate of clearable names only.
In Summary
- Credit Derivatives have been exceptionally busy in 2022.
- Index CDS have added over $6.6Trn in traded notional compared to the same time last year.
- Certain Index products have seen volumes increase by 70%+ compared to 2021.
- The large volumes in Index CDS have not been replicated in Single Name CDS, which is seeing similar volumes to last year.