- CCPView data shows that Open Interest in Russia CDS has decreased 13% from $9.4bn to $8.1bn.
- Over the same time period, average trade size in Russia CDS has decreased from $8.5m to below $5m.
- More trades are happening than we have seen previously, with February seeing nearly 1,000 trades.
- There was a single trade at the end of October of $150m which really stands out in the data.
- Elsewhere, SBSDR data provides insight into the prices paid on these CDS contracts.
Drawing from our two most recent blogs here on Clarus:
It doesn’t take a huge leap to work out that we now have (some) data on CDS trading versus sovereign bonds in Russia. It is not the most important thing in the world to look into market structure and transparency whilst these events unfold. Trading is continuing in RUB derivatives, therefore exposures continue to generate hedging needs and have to be managed appropriately. As Bloomberg’s Matt Levine wrote:

Clearing
First up, I had to educate myself whether any Clearing House a) offered clearing versus single name sovereigns and b) whether that list included Russia.
Handily, ICE Clear Credit are very transparent about these types of things. From the ICE website:
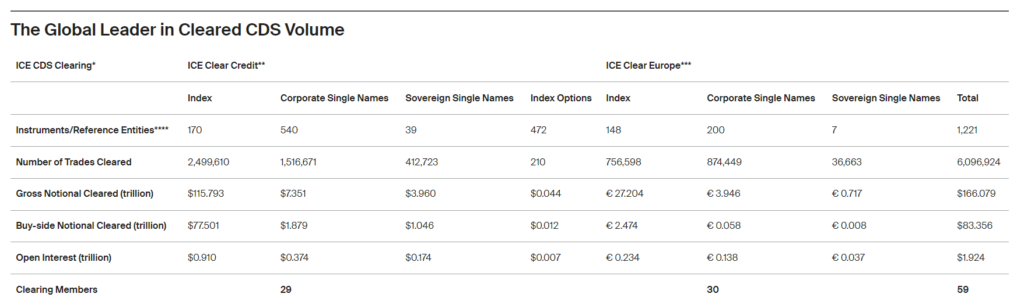
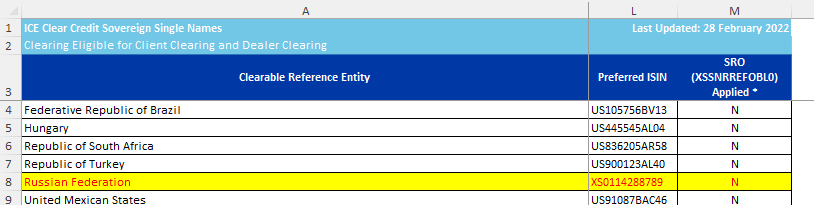
Amongst those 39+ Sovereign Single Names is indeed the Russian Federation:
What does this mean for our Clarus data? Two things:
- We will have some insight into the overall Cleared volumes for Sovereign CDS from CCPView. This will allow us to benchmark point 2.
- We will have some data from the new SBSDRs on both Cleared and Uncleared Sovereign CDS. Let’s see what those trades show us and what kind of portion of the market it might cover.
Russia CDS
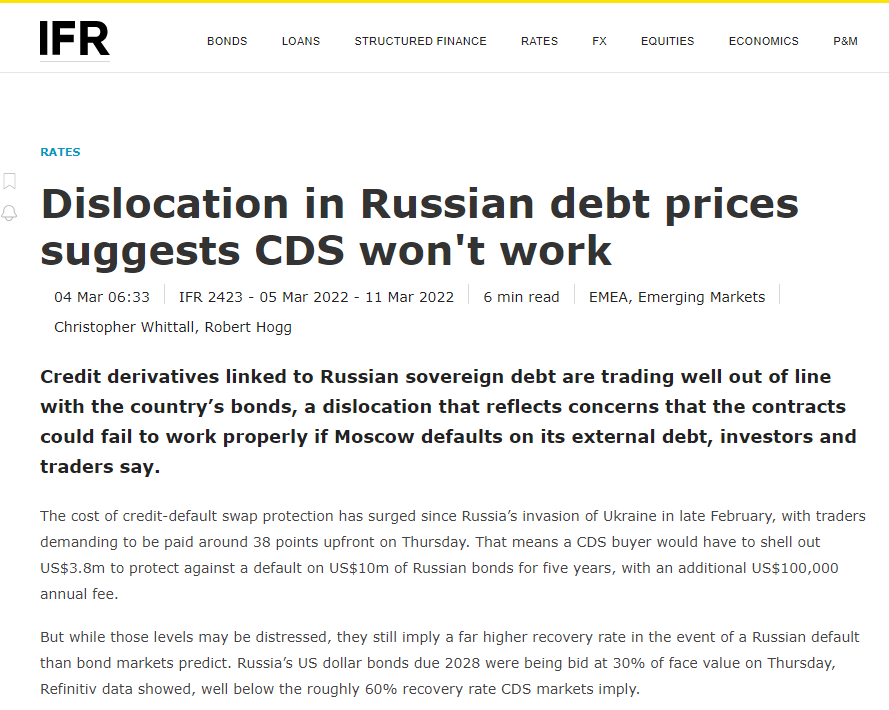
There was a (potentially important) announcement over the weekend which could have knock-on effects for CDS written against the Russian Federation. IFR and Bloomberg have covered it really well so far:
And the explicit announcement from Russia on Bloomberg:
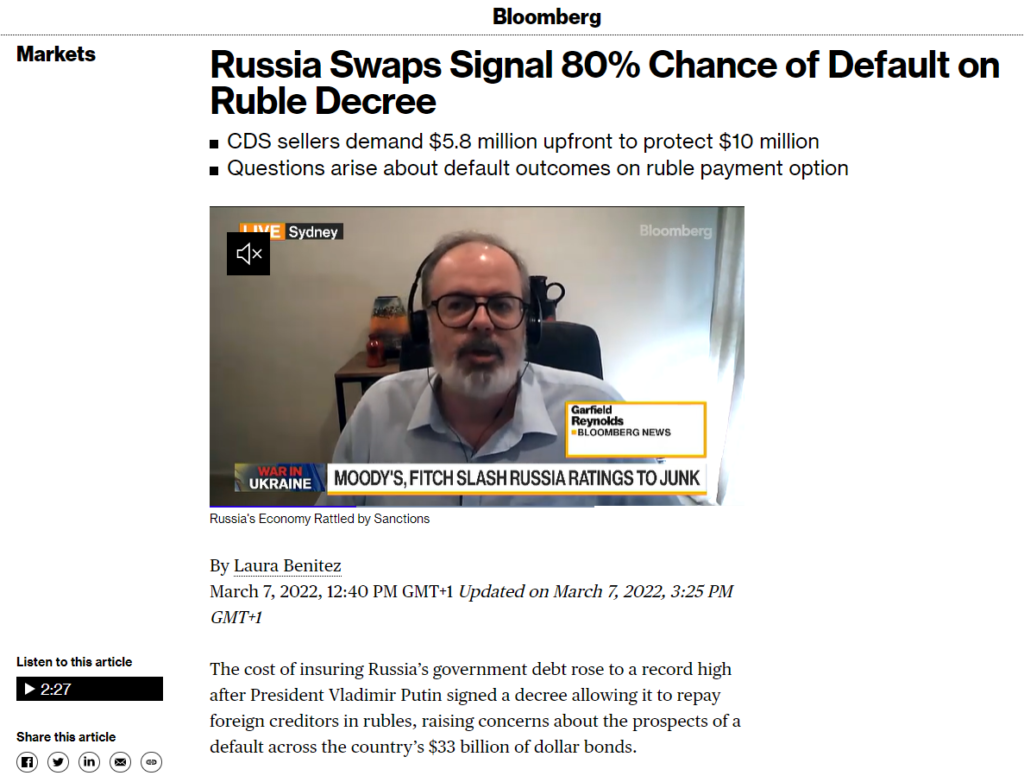
If you are not familiar with the background, I highly recommend checking out both of the stories before looking at our data below. In essence, does a CDS contract pay-out if coupons or notional repayments are made in a different currency to the underlying bond? I’m not a lawyer and I don’t have any experience with potential precedents (such as Venezuala as mentioned in this FT article).
CDX Trading
The final bit of background here is that Markit have consulted over the past five days regarding whether CDS on the Russian Federation should be included in the next series of the CDX Emerging Markets index. The consultation results were posted on Monday:
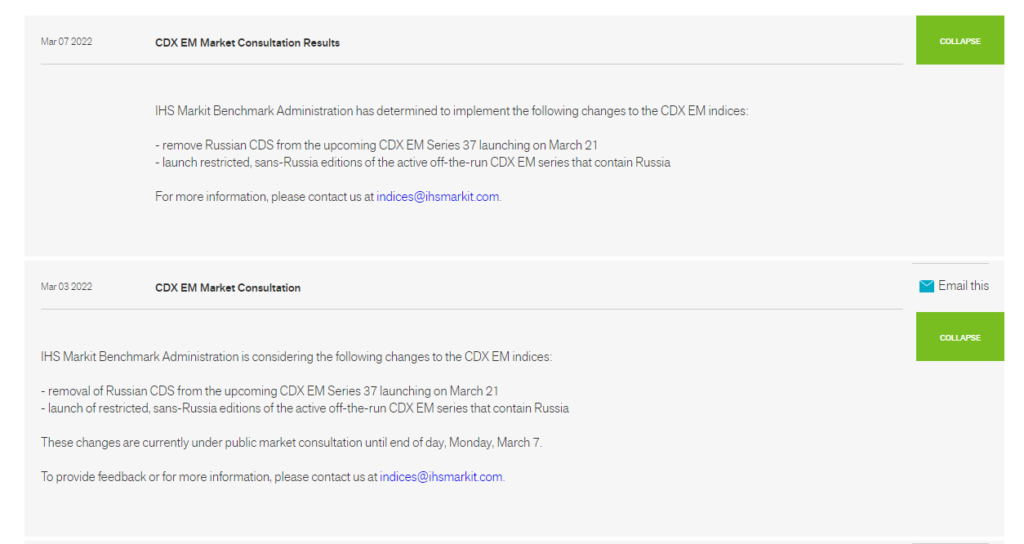
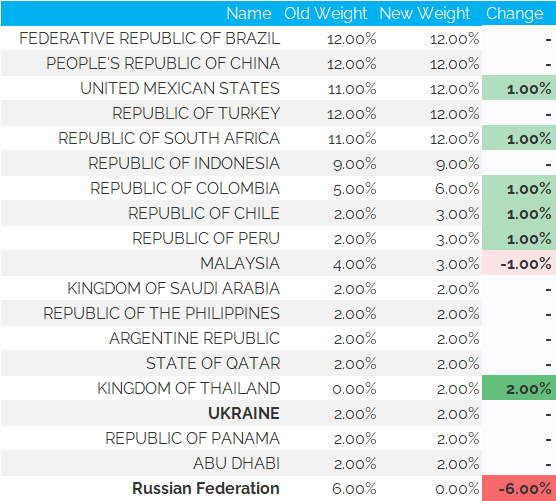
And the new Index elements were posted yesterday (Tuesday 8th March). Russia, which had a 6% weighting is out, Ukraine stays in at a 2% weighting, and the following countries have seen their weightings increase:
- Mexico
- South Africa
- Colombia
- Chile
- Peru
- Thailand
Summarised below:
It will therefore be interesting to monitor roll activity over the coming trading sessions to see what this means for CDX.EM activity. You know where to look –> SDRView Pro.
Cleared Activity
With that background in place, let’s check-out activity in CDS vs Sovereigns as a whole. What do the latest market conditions mean for activity here?
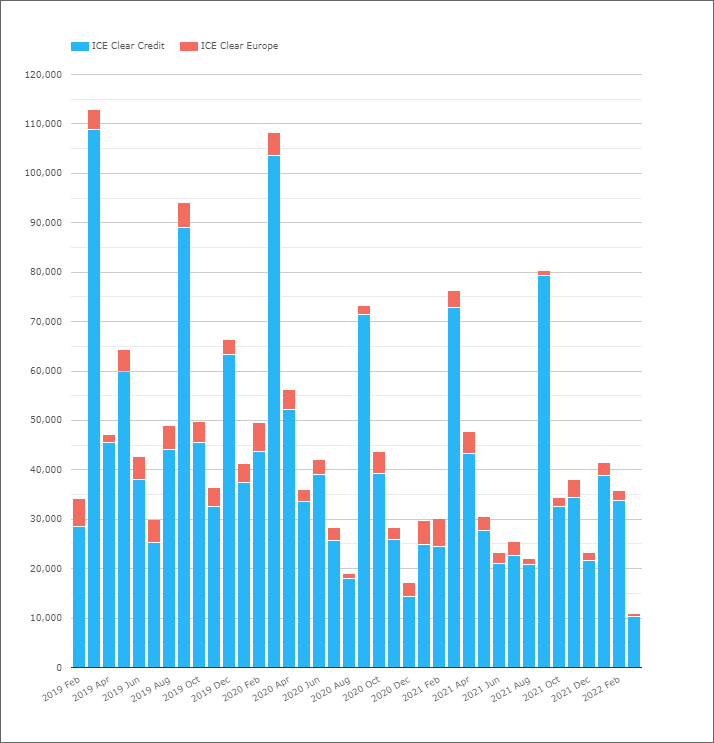
It’s important to explain what this CCPView chart shows!
- This is the total notional volume of all CDS cleared at ICE versus all sovereign names! It is not just the Russia volumes!
- It gives us an idea of the overall market size for single name sovereign CDS.
- We have no immediate data on what size the uncleared market might be.
- But the Cleared market has averaged $39bn each month in activity for the past three years (taking half of the activity in each March and September roll month).
- For comparison, February 2022 saw $36bn trade, with ~$11bn trading so far in March 2022.
- It’s fair to say that we haven’t seen an elevated amount of activity yet.
More Transparency
However, if we drill-down into the details in CCPView, ICE provide both daily trade counts and notional amounts by SECURITY. This means we know exactly how much Russian Federation CDS is being cleared each day (at ICE):
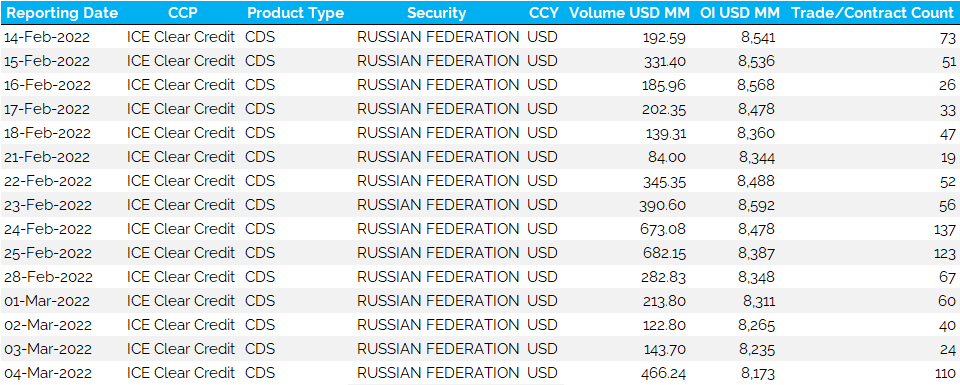
There has been an Average Daily Volume of nearly $300m (single counted) for the past few trading sessions, across 60 trades per day. This implies an average trade size of just under $5m. Which is handy given that is the exact capped notional threshold for CDS trade reporting at the new SBSDRs.
This recent trade activity has reduced the Open Interest in Russian CDS:
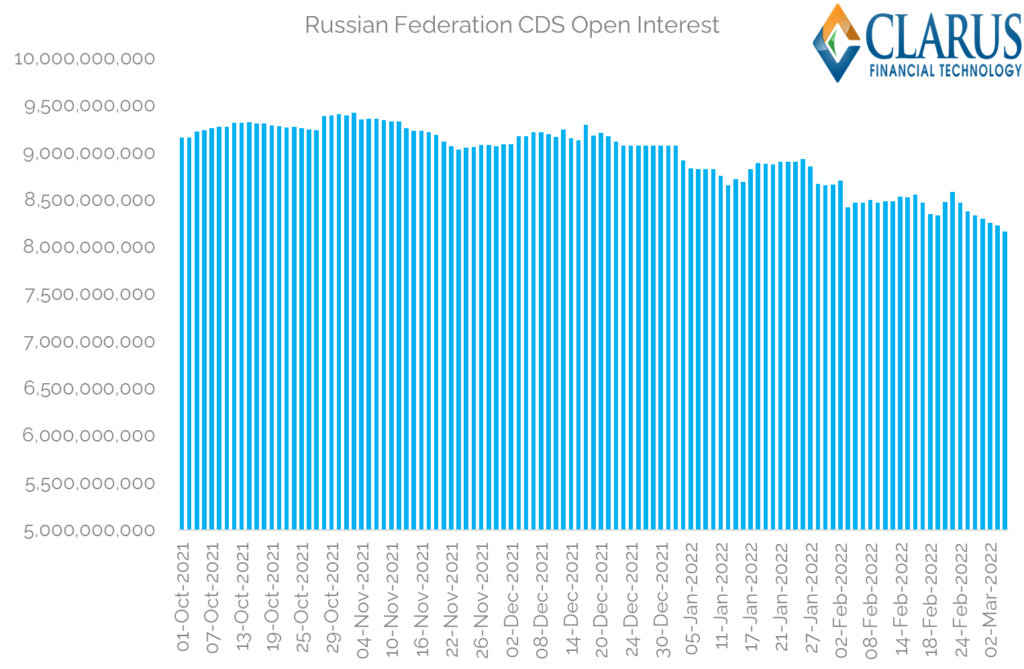
Showing;
- Since the last roll date, the maximum Open Interest in Russian CDS was $9.43bn.
- This has reduced substantially, to now stand at $8.17bn.
- A healthy 13.4% reduction.
- But clearly still plenty of risk out there.
- Of course we don’t know how much of this CDS is “hedging” underlying bond exposures. Or what the basis is truly like between those hedges and the specifics of the bond vs CDS payout.
And what has daily and monthly activity been like in order to reduce the Open Interest by 13%?
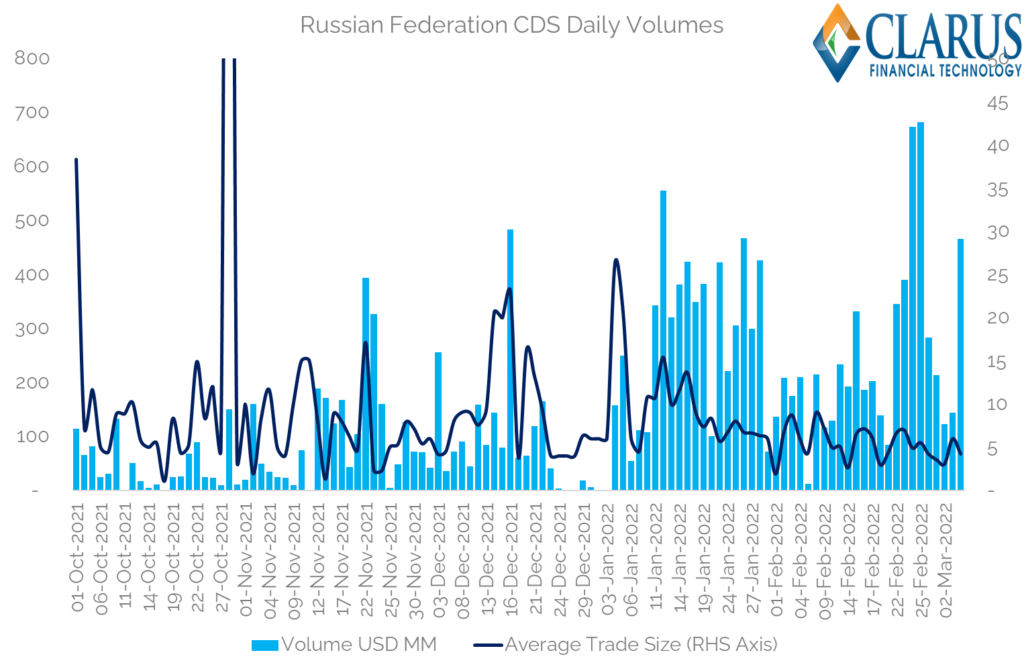
This is an interesting chart! Let’s dig into some details:
- Average Daily Volumes in cleared Russia CDS in October 2021 were $46m.
- In November they doubled (!) to $106m.
- December they stayed elevated at $89m.
- January 2022 ADVs $274m.
- February 2022 ADV $247m.
- And March 2022 so far at $237m.
- A five fold increase in activity.
- Maybe not surprising given external events.
- But bear in mind that average trade size over this time has decreased significantly. From the monthly totals, average trade size in 2021 was around $8.5m and it now sits at less than $5m based on the past month’s activity.
- October 2021 saw 96 trades in total.
- February 2022 saw 957 trades! February 24th saw 137 trades alone. To paraphrase, “when months happen in days”.
- Traders are undoubtedly being kept busier than ever, trading more size in smaller clips.
Interestingly there is one trade that really stands out in the data. 28th October saw a single trade of $150m notional. It increased Open Interest by the same amount and was therefore risk additive (not compression related). This is far far larger than anything we’ve seen otherwise……
Trade Level Transparency
Finally for today, SBSDR data is now coming on line. We are working to consolidate both the DTCC and ICE feeds into something meaningful. So far, I have been able to cast my eye over some preliminary trade data for the past 15 trading sessions from DTCC. We can see that:
- A portion of the Sovereign CDS market is reported to DTCC.
- The flags of Cleared or Uncleared may be unreliable at first glance. Only 152 trades out of ~2,500 have the clearing field set to “Cleared”. Hmmmm….seems highly unlikely for standardised products such as CDS (even single name).
- This means we will likely need to combine SBSDR data with CCPView data to calculate how much of a given market is cleared for single name CDS. An interesting upcoming project.
- We’ve seen 400 CDS trades versus the Russian Federation reported so far in the DTCC SBSDR – there have been 918 trades in Russia CDS at ICE in the same time period. That’s a pretty good benchmark to run with I guess.
- I hoped to present a single chart of prices for Russia CDS….and we can certainly see them.
- The prices range from 240 basis points running as of 14th February….
- To 46 UPFRONT POINTS on March 5th.
This serves to highlight the significant move in prices. As default risk becomes so high, the premium now needs to be paid upfront (which I believe reduces “jump to default” risk).
For the purposes of this blog, I haven’t had time to implement the ISDA CDS standard model to convert from basis points to Upfront Points. Needless to say, we are working on it!
In Summary
- CCPView data shows that Open Interest in Russia CDS has decreased 13% from $9.4bn to $8.1bn.
- Over the same time period, average trade size in Russia CDS has decreased from $8.5m to below $5m.
- More trades are happening than we have seen previously, with February seeing nearly 1,000 trades.
- There was a single trade at the end of October of $150m which really stands out in the data.
- Elsewhere, SBSDR data provides insight into the prices paid on these CDS contracts.