Compression List Trading volumes have continued on their upward trend this year and in this article I will look into the what the data shows both in terms of volumes and also SEF market share.
On SEF Compression Lists By Month
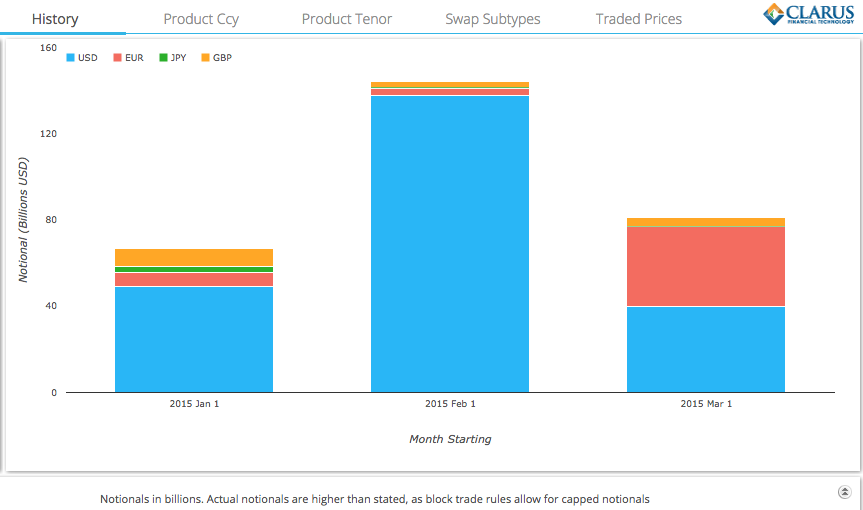
Lets start with an SDRView Res chart of monthly gross notionals in G4 currencies (5 Jan to 20 Mar).
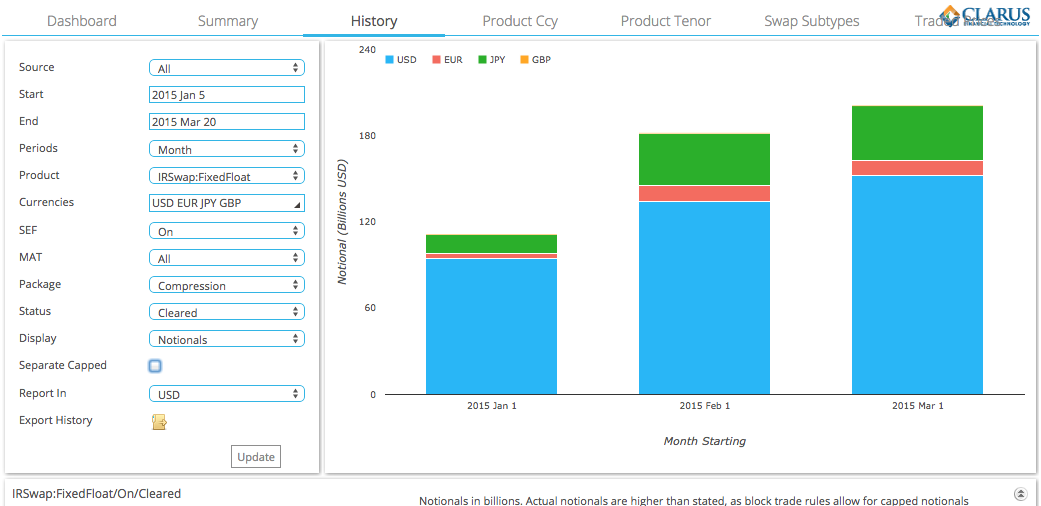
Which shows:
- A rising trend, with each month higher than the last
- February was $180 billion
- March with a week left to report, is > $200 billion
- Of which USD is 75%, JPY 20%, EUR 5% and GBP < 0.1%
Two caveats, firstly our identification of Compression packages from the SDR trades requires a number of assumptions, so is not 100% accurate and secondly block trade rules means that notionals are caped for these to below their actual size. This means the actual volumes for USD will be higher, but the trend holds true.
Update: For JPY, drill-down into the trades shows that these are single period with future dates executed at the same time, so rather than Swaps, look like FRAs perhaps executed as part of an FRA reset/match exercise but reported in-correctly as Swaps. (More on this later).
Looking at trade counts, we see:
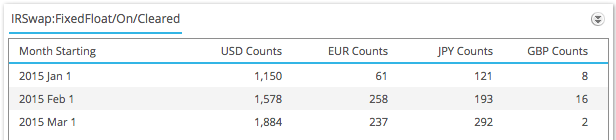
So a substantial number of trades, meaning a good number of compression lists are being traded, each with between 2 to 90 trades. See my earlier blog Swap Compression and Compaction on TrueEx and Tradeweb SEFs for the rational for these.
Interestingly if we now show volumes excluding Compression for the same period, we see:
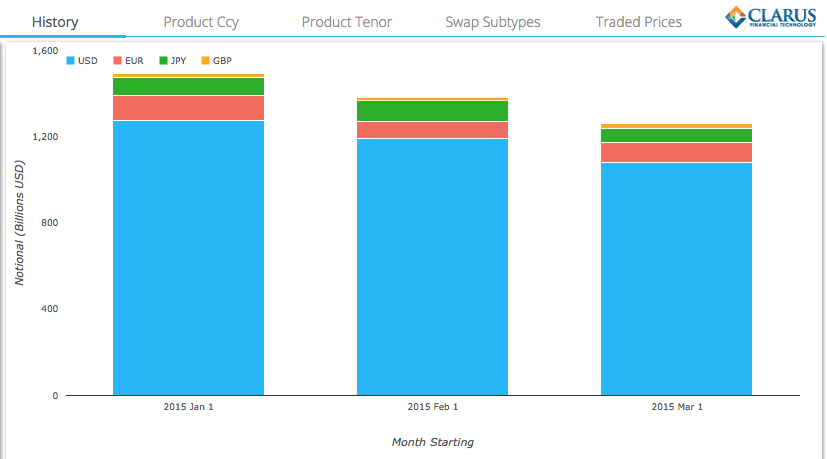
From which it is obvious that Compression Lists represent a growing share of On SEF trading activity.
- In Jan this was 7% of USD On SEF Cleared Swaps
- In Feb it was 10%
- In Mar it is 12% (up to Mar 20).
It will be interesting to see the final percentage for March.
Off SEF Compression Lists By Month
Lets now look at the same analysis for Off SEF, first for Cleared Swaps.
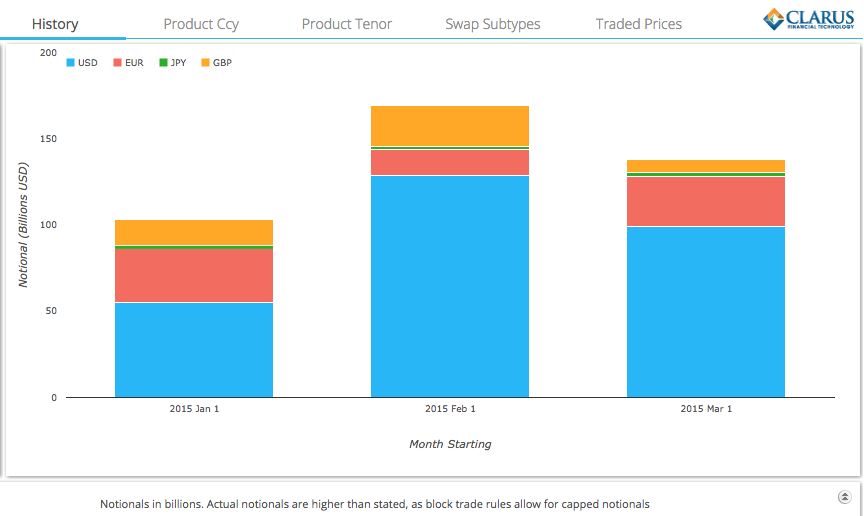
Which shows that similar amounts of these compression lists are being traded Off SEF, perhaps not surprising as their is no mandatory reason for compressions to be On SEF. So we assume these are being transaction directly between clients and dealers or dealer to dealer or brokered Off SEF by IDBs.
Second if we just select Uncleared or Bi-lateral Swaps, we see:
Also substantial volumes but the assumption these are actually compressions lists and not some other activity like backloading is a weak one, as the whole point of compression lists is for CCPs to net opposite cleared deals, a rational that does not exist for bi-lateral deals.
In general we can say that as much compression list activity is Off SEF as is On SEF, which is surprising as we would expect that the superior automation of On SEF should make it much more compelling than Off SEF.
Time will tell and we will keep an eye on the Off SEF activity.
On SEF by Week
A chart of weekly On SEF volumes shows very clearly the positive upward trend.
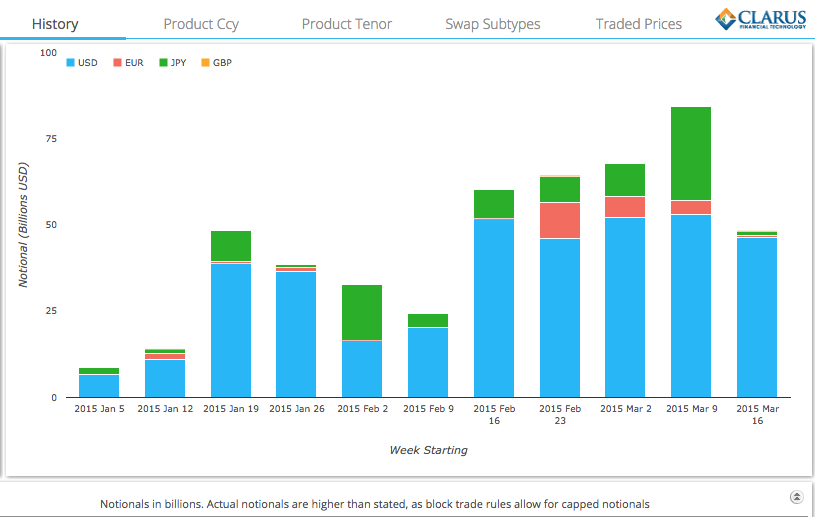
With USD showing steady high volumes in each of the past 5 weeks, while JPY and EUR show more up and down volumes.
We know that these On SEF compression lists are traded on Tradeweb, TrueEx and BSEF.
So lets look at each of these in turn.
Bloomberg SEF
For BSEF, as we know that only BSEF reports to BSDR, so we can just use SDRView to look only at compression trade activity on BSDR.
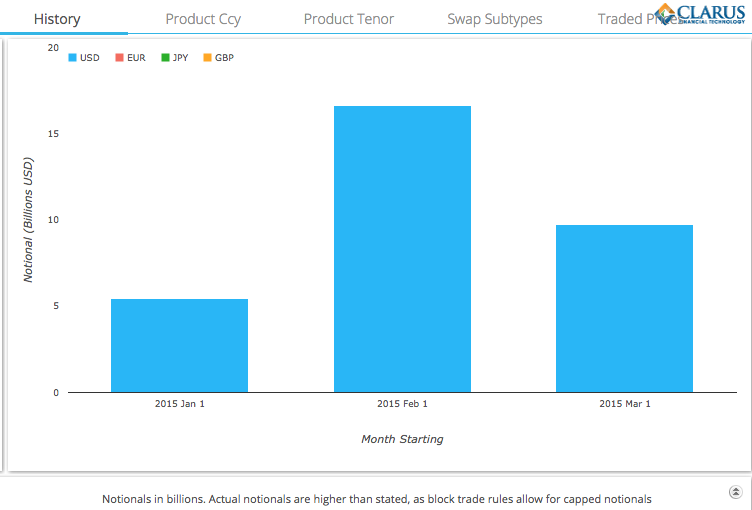
Which shows:
- Only USD is traded on BSEF, with
- $5.5b in Jan
- $17b in Feb
- $10b in Mar (up to 20 Mar)
The USD $10b in March can be compared to the $150b of USD (75% of $200b) we see from the first chart in this article. Meaning that $10b out of $150b or 7% of USD compression trading in March so far that we see on SDR is on BSEF.
However before sticking with the $10b, can we estimate how much larger the real number is if we did not have the capped rule for block trades? Luckily in this case we can exactly quantify this as BSEF separates out its compression trade activity in its daily SEF Reports.
Using SEFView we can drill-down to that daily data in March and sort the list to get Compression trades:
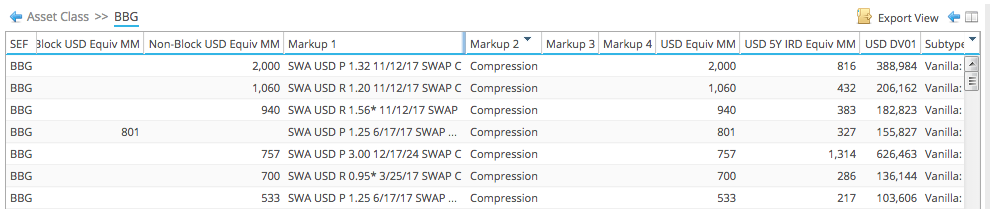
Summing these we get a gross notional of $21.4 billion. So our actual figure is twice the SDR figure. We will need to use this rule of thumb when we look at the next two SEFs.
TrueEX
Now both TrueEx and Tradeweb compression lists are reported to the DTCC SDR, so we have no obvious way to separate out which comes from which. However TrueEx does report its PCT volumes and using SEFView we can see the daily reported figures between 1-20 March.
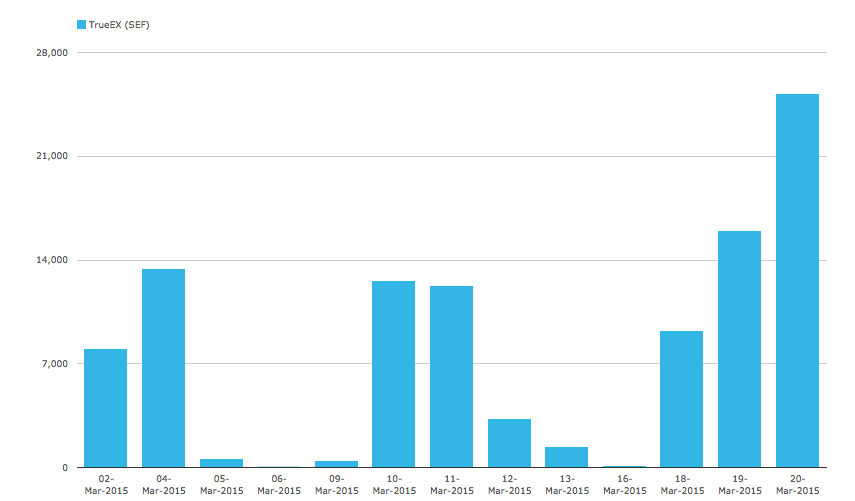
And the same but by Currency.
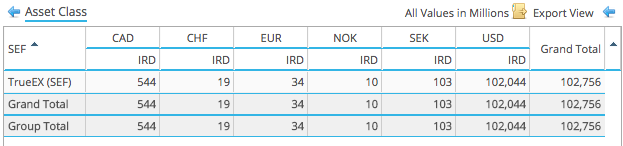
Showing that:
- In USD TrueEx has $102 billion
- Interestingly CAD is $544 million
- And CHF, EUR, NOK, SEK have small amounts
- Nothing in JPY or GBP
Comparing the $102 billion in USD on trueEx with the $21 billion on BSEF, we can say that trueEx has almost five times the volume of BSEF in the period 1-20 March.
Tradeweb
Tradeweb does not break out its compression volumes in its daily SEF reports, so we cannot use SEFView to get a figure for these.
This leaves us with SDRView and the problem of capped trades.
First lets start with EUR, JPY, GBP, where SDR has $11b, $38b and $240m respectively in the 1-20 March period. As there is nothing in BSEF in these currencies and just $34m in EUR on TrueEx, we can say that all of the volume in EUR, JPY & GBP is on Tradeweb.
Update: However looking at TW SEF volume by Currency we see that only $350m is reported in JPY. This confirms our earlier conjecture that the $38b of JPY is not compression activity.
Second lets look at USD. What information do we have?
- $150 billion is reported to SDR
- But we know this is under-stated due to capped notionals
- $10billion of this is from BSEF
- $21 billion is the actual (un-capped) BSEF figure
- $102 billion is the actual (un-capped) TrueEx figure
- We do not know what the capped TrueEx figure is
- We not know the capped or actual Tradeweb figures
So we need to make an informed guess-estimate.
Lets assume the BSEF 1:2 ratio of capped to un-capped holds for TrueEx and Tradeweb, we would then estimate that TrueEx is $51b of the $150b in SDR. Which leaves $89 billion of the $150 in SDR as attributable to Tradeweb. Making the actual Tradeweb amount $178 billion.
Given that TW reported $422 billion in the period 1-20 March, this makes compression trading 42% of their volume, which strikes me as a little higher than the 30% we have observed in the past. If we instead used a 1.75 multiplier instead of 2 for TrueEx and Tradeweb, we would get Tradeweb volume as $143b and a 34% compression to trades volume ratio for Tradeweb.
So we can guess-estimate current market share in USD compression list trading as:
- Tradeweb with 54% to 59%
- TrueEx with 34% to 38%
- BSEF with 7% to 8%
Summary
On SEF Compression list trading has increased month on month in 2015.
USD represents the majority of this activity.
Compression list trading is also an increasing percentage of USD On SEF Swap trading (increasing from 7% to 12%).
Off SEF Compression list trading is as large if not larger than On SEF.
Weekly volumes show a strong pick from Feb 16 onwards.
Bloomberg reported $21b in USD between 1-20 March, making its USD share 7% to 8%.
TrueEx has some CAD, CHF, EUR, NOK, SEK, but USD is the main, with $102b in USD between 1-20 March, a share of 34% to 38%.
Tradeweb has significant volume in USD, JPY, EUR & GBP, with $143b-$178b in USD between 1-20 March, a share of 54% to 59%.