Following-on in our monthly review series, let’s take a look at how volumes developed during the month of December. The results are quite surprising in the end.
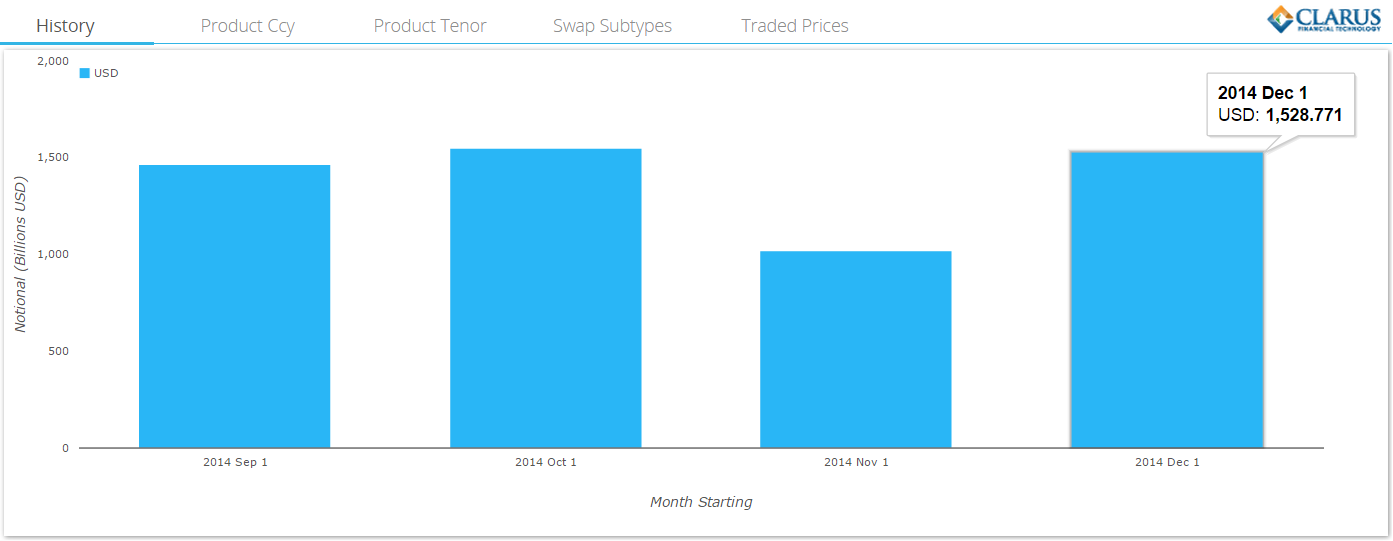
From our October review, we know that October 2014 was a record month for SEF trades, mainly down to such extreme market volatility. What we see for December, a holiday-shortened month, is therefore somewhat surprising. Volumes amounted to over 99% of October’s record – an incredible achievement on the face of it, when trading activity is so subdued after the 20th of the month. Indeed, if we look at the same period on a week-by-week basis, we can see how active the first three weeks of December were:
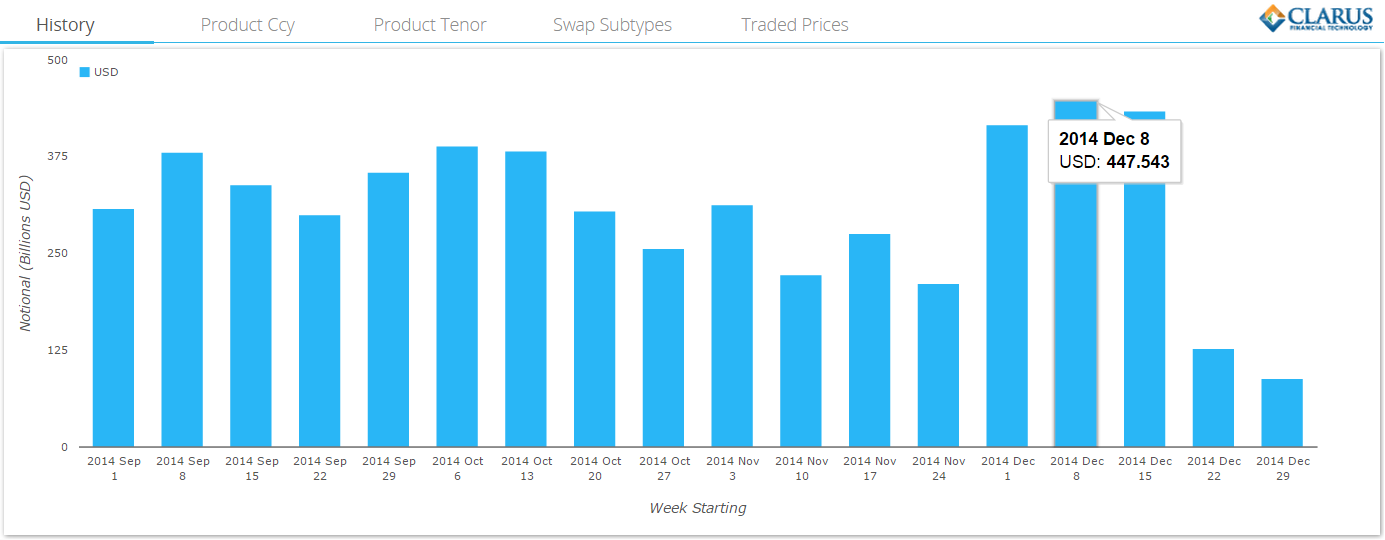
So, the last three trading weeks of 2014 were the only ones in our sample period that saw over $400bn trade. Everyone at this point is hollering “IMM Roll”.
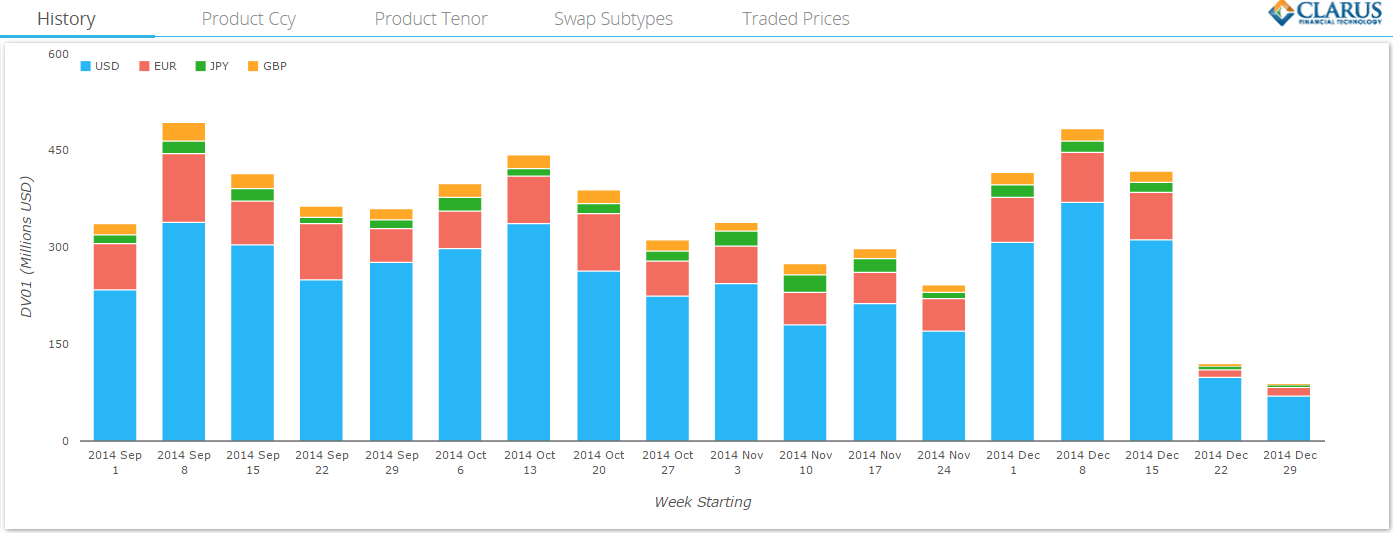
Before we look at the IMM Roll, I’m pleased to announce that we now have DV01 metrics for all of the major currencies, going back to 1st September. We can therefore see how significant the first three weeks of December trading were. Below are the weekly DV01 volumes for the major currencies since September – including only Cleared volumes (see below for why):
Did I hear you mention the roll?
Of course, some volumes during the month are linked to rolling positions from expiring December IMM contracts – which on the whole are close-to-risk neutral operations.
Fortunately, I think we can have at least a decent stab at estimating the roll volumes. Using SDRView Pro, we can look at all on-SEF USD Swaps starting on IMM dates that were traded before the contract roll (let’s take the biggest window possible and include Wednesday 17th Dec, even though the last trading day should have been the Monday):
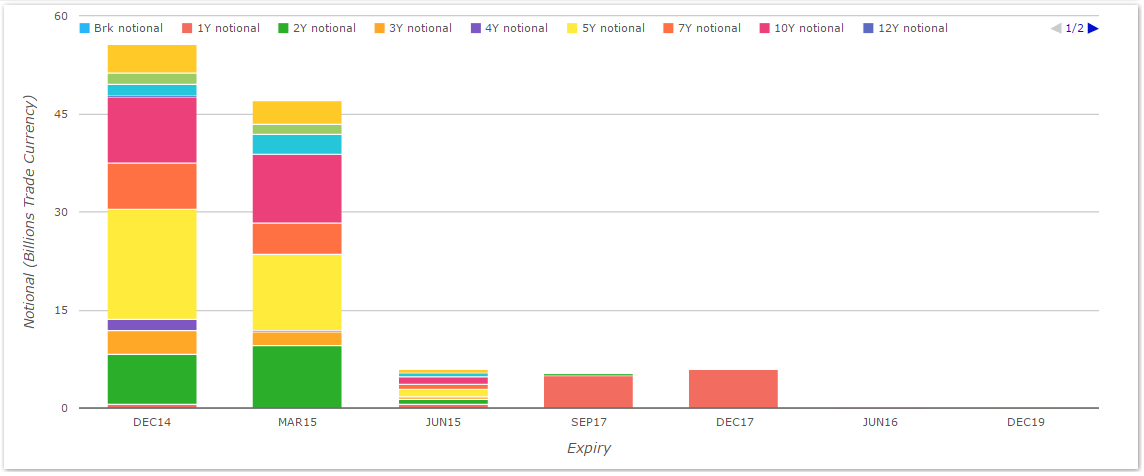
We can then either eliminate all Dec activity, or my prefered measure is to look at the positions rolled between Dec and Mar by taking the minimum volume for each of those IMM dates. What we see is a rather underwhelming number:

Showing:
- There was $16.8bn traded in 5y USD Swaps starting on the Dec IMM vs $11.7bn on the Mar IMM.
- We therefore assume that of these trades, $11.7bn (the smallest number) was related to IMM rolls.
- To correct for roll activity, we then have to double this number – from $11.7 to $23.5bn to reduce both Dec and Mar volumes accordingly.
- Overall, we can therefore allocate $86.7bn of volumes to rolling Dec IMM positions into Mar.
Perspective
So how significant is the roll activity?
- $86.7bn represents just 5.7% of the month’s On-SEF USD swap volumes.
- December 2014 therefore still achieved over 93% of record volumes, correcting for the roll.
- If we corrected on a week-by-week basis for the roll, it is therefore likely that the first three weeks of December saw record weekly volumes trading on-SEF.
Market Moves
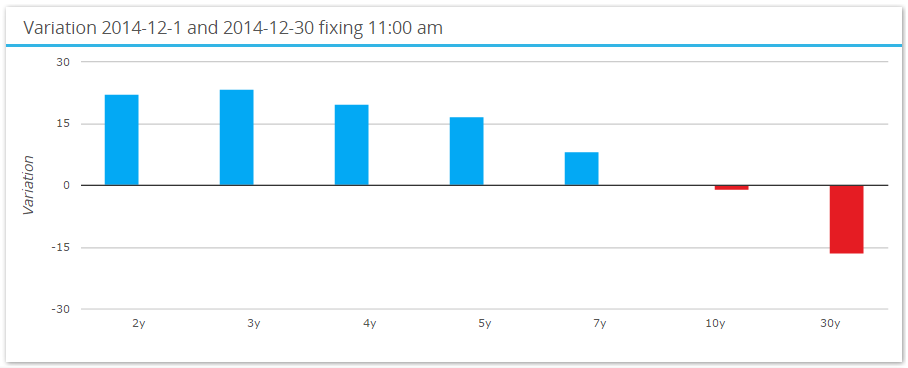
Using SDRFix, we can see that curves continued to flatten – although instead of a continued rally across the whole curve in US dollars, this flattening was led by an increase in short-end rates following the FOMC meeting before Christmas:
Off-SEF Market activity
Looking at the non-SEF World, we are still seeing a huge amount of activity in Off-SEF, uncleared trading, across all of the major currencies. For December, the Summary by DV01 looks like this:
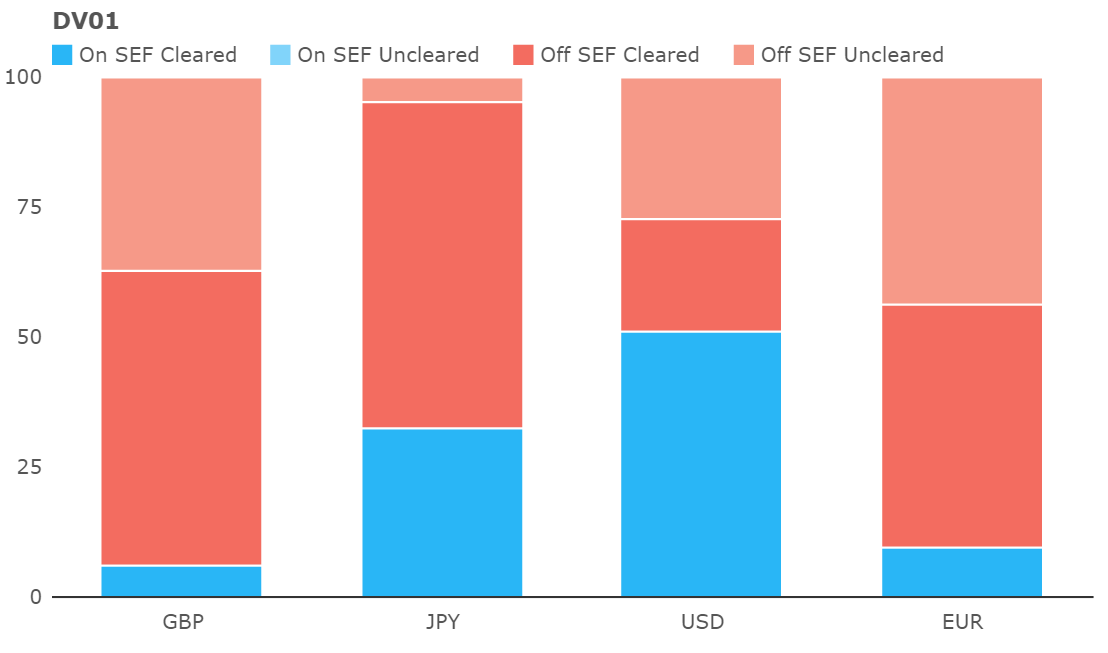
Showing:
- For USD, On-SEF Cleared swaps were the market leader at 52% of volume by DV01.
- However, Off-SEF Uncleared swaps were larger than their Cleared brethren, representing 26% by DV01.
- In EUR and GBP swaps, the vast majority of trading remains Off-SEF, but an alarming amount was uncleared – 43% and 37% respectively.
This increase in uncleared, Off-SEF reporting is a continuation of a trend that we have commented upon previously. From the weekly data, we can see that “batches” of these trades are being processed on particular days – with a significant portion in EUR (in green) during December:
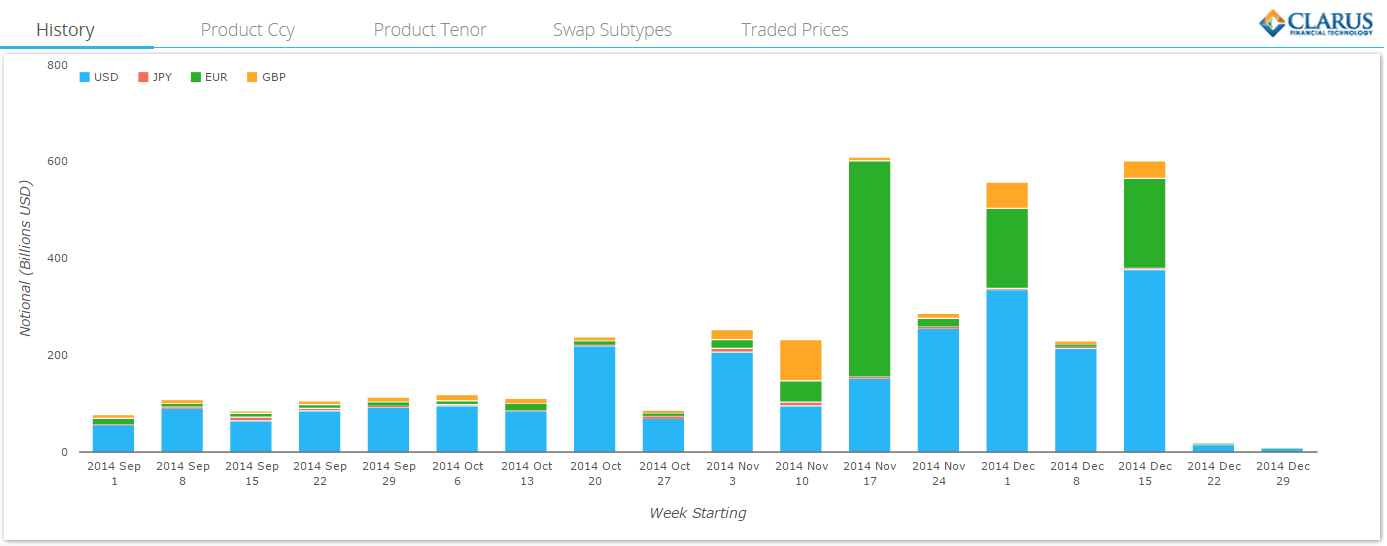
Our hunch is that these volumes are related to some type of portfolio maintenance activity, or trades becoming reportable that were previously exempt. The reason being that the volumes are so high, that we would also expect to see a significant spike in hedging-related activity across all swap types if these were new, risk-increasing transactions.
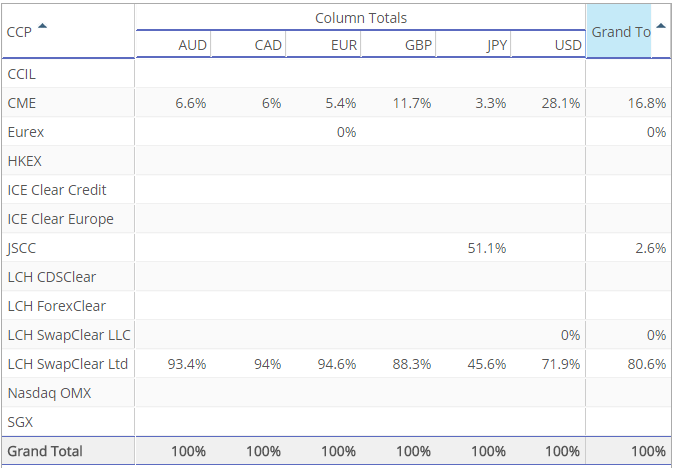
With Uncleared transactions remaining in the minority, it makes sense to follow-up on Tod’s announcement regarding one of our new products for 2015, CCPView. We are now in the position to start analysing the split of the Cleared transactions on a weekly basis. For December, the split of Interest Rate Swap clearing by venue went along these lines:
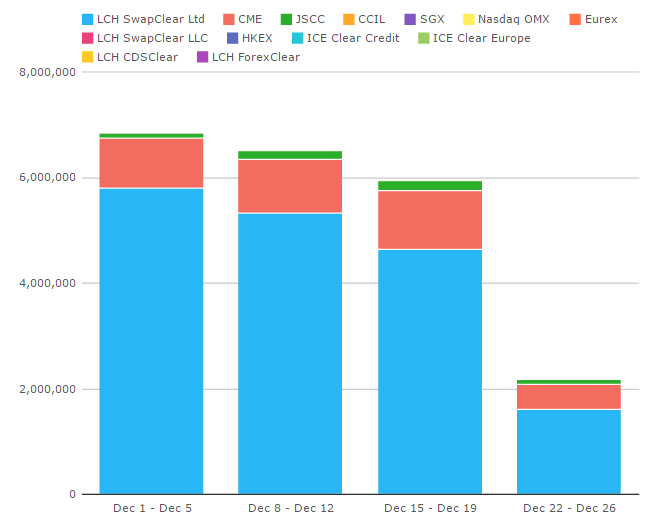
These volumes include both dealer-to-dealer and dealer-to-client activity. Along with the table below, we can therefore see that LCH (80%), CME (17%) and JSCC are all seeing significant volumes across the major currencies:
SEF Monthly Volumes
Using SEFView (to include uncapped notionals), we can have a look at how the SEF World as a whole fared in December 2014. Including all currencies in the Interest Rate Swap Universe, we can see that (when including Dec Roll activity), and measuring in 5yr USD Equivalents, it was (just) a record month!
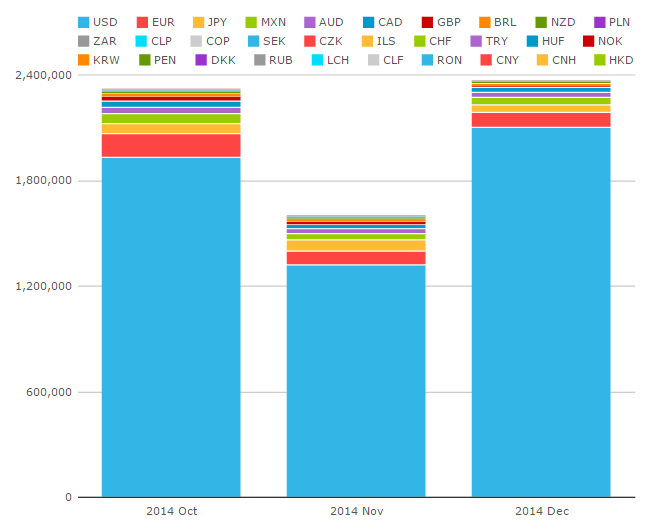
I split this volume chart by Currency to highlight just how dominant USD volumes continue to be for the SEF IRS world. In December, 81% of 5-yr equivalent volumes were in USD.
SEF Market Share
As Amir highlighted in November, we can cut the SEF data in numerous different ways. This month, let’s look at Interest Rate Swap Market Share percentages in 5yr equivalents, for the most significant currencies by volume:
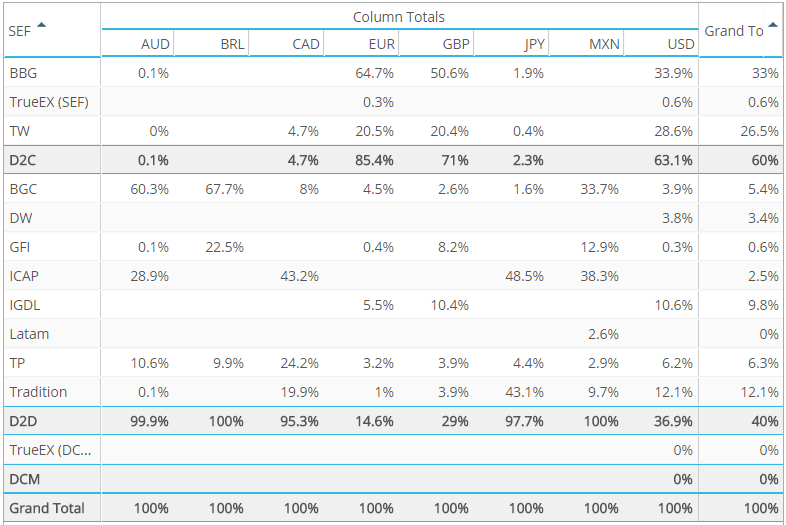
For Interest Rate Swaps, we can therefore see that:
- Bloomberg continues to be the market leader at 33%.
- Tradeweb and Dealerweb combined come in a close second at 29.9%.
- ICAP and Tradition have similar market share around 12%.
- Tullets (TP), BGC, GFI and TrueEx make up the rest.
- These figures change significantly when including OIS, FRAs and Inflation swaps. ICAP seems to have a particular strength across these products, as their market share increases to over 16% when including these volumes (on a 5yr equivalents basis).
In Summary:
- During December, we saw a flattening yield curve in USD.
- Which, in the run-up to the FOMC meeting, saw significant volumes trading on-SEF in USD swaps.
- IMM roll activity is only equivalent to around 5% of monthly volumes.
- Therefore, it is fair to say that USD on-SEF trading saw weekly records in December 2014.
- Nearly 75% of USD swaps were cleared in the month, with LCH clearing 72% by volume.
- Of the 52% of USD swaps traded on-SEF, Bloomberg were the market-leader with a 33% market share.
Of course, as we’ve highlighted over the course of 2014, we are now in a position to further refine these numbers to exclude compression/list-trading activity and/or delta neutral spread positions. Different SEFs and CCPs have different client bases and witness different customer behaviour as a result. However, I will leave it to the Clarus users themselves to get down and dirty with those particular details.