I’ve written about the public FCM data in America a couple times before, most recently back in October 2015 here. I was keen to revisit and update the analysis to see:
- Growth in clearing business
- FCM rankings for swaps & futures
- Concentration amongst top FCMs
- Any real evidence to firms leaving the clearing business
I found some interesting nuggets of information. So let’s begin with just how many FCM’s there are:
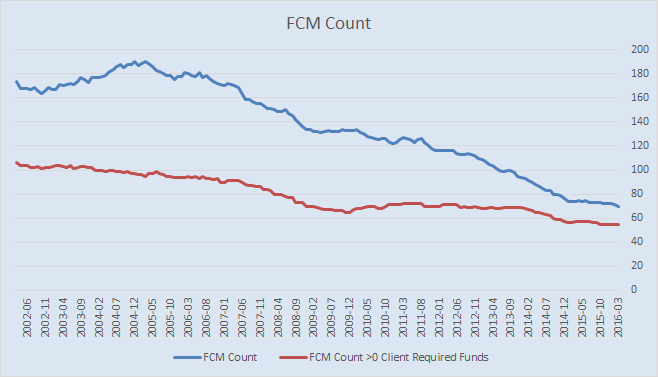
The blue line shows how many FCM’s are reporting. Importantly, the Red line is the amount of FCM’s that have any client margins to support futures, options, and swaps. At a headline, seems to be a contracting industry.
How Much Margin Are We Talking About
Before going deeper, its best if we first remind ourselves of some terminology about the clearing business in America. The FCM data here reports funds & margins held across the three regulatory buckets:
- “Seg” – Listed futures and options.
- “30.7” – Listed futures and options outside of the USA.
- “Cleared Swap” – Over the counter rates, credit, FX swaps.
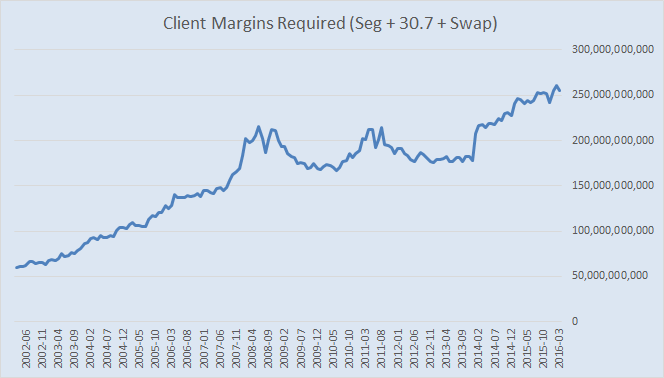
First if we just look at the sheer amount of client margins required by FCMs to support cleared derivatives trading. This now tops 250 billion:
If we look at this growth by regulatory bucket:
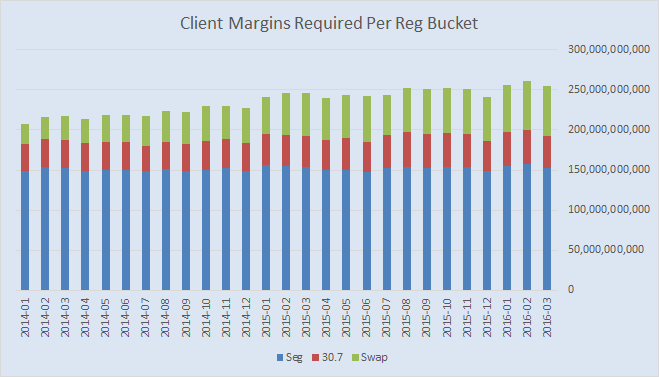
This shows that since Jan 2014:
- Seg and 30.7 are constant
- All the growth is in Swaps
League Table
So of course I was interested in who is winning and losing. Or in the case of the clearing business, who is trying and who is jumping out. Below, I focus on just this growing portion of the clearing business – the swaps market:
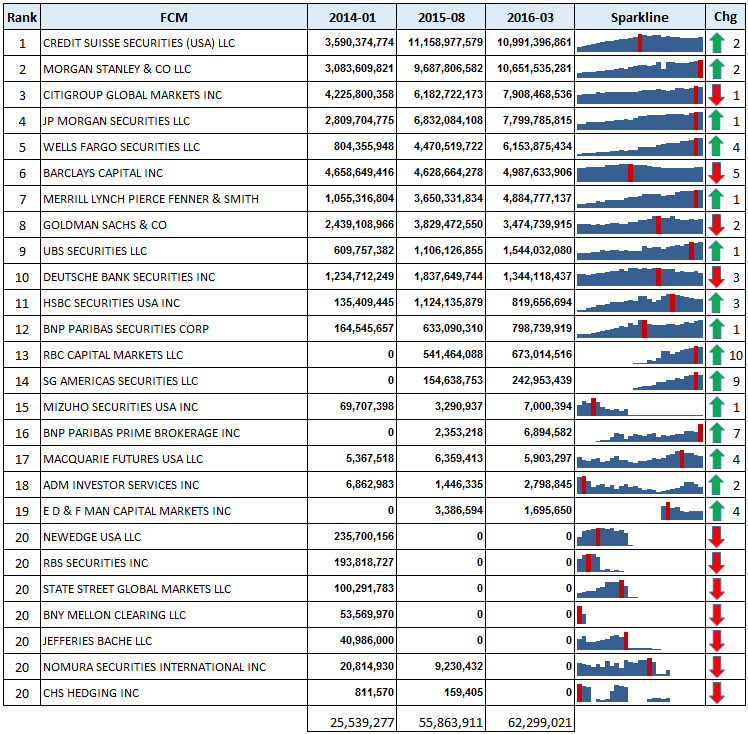
Few notes about this chart:
- The rank is based on the total amount of cleared swap margins required for March 2016.
- The Sparkline shows monthly progress in swap margins since Jan 2014 for each FCM
- The Change is the change in ranks since Jan 2014
What I glean from here:
- Since Jan 2014, 7 FCMs have exited the business (now have 0 margins)
- Since Jan 2014, 5 FCMs have started the business
- Credit Suisse has the #1 spot, though their margins have actually reduced since the last report (Aug 2015 data)
- Barclays is down 5 spots, from an early #1 spot in Jan 2014. However, during this time their margins held has actually increased slightly.
- RBC showing the most notable investment in the business, growing from non-existant to a respectable 13th place on the list
- Wells Fargo, now at #5 overall, is the winner among larger ranked firms, moving up 4 spots from Jan 2014
- SocGen I presume simply reflects the change of the business from Newedge to the new entity
- The sparklines for many of the FCM’s show them peaking in margins in the most recent 2 month
- Some general evidence of non-US FCMs retracing. Granted the #1 spot is held by Credit Suisse, but they seem off of their highs; and Barclays, Deutsche, HSBC also off of their highs.
So margins up, FCM’s down. What does the concentration of the business look like? I put together this simple chart showing the concentration of swap margins held among this list of FCMs:
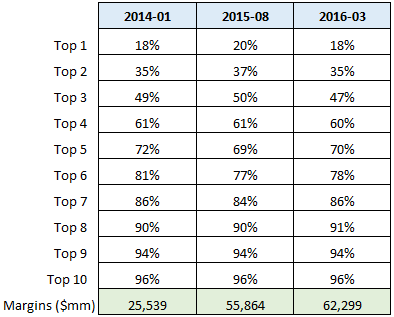
This seems to tell us:
- The top 2 FCM’s hold 35% of the swap margins
- The top 5 FCM’s hold 70% of the swap margins
- The concentrations have held remarkably stable, even with firms moving around in the ranks and the total size of the pie growing by over 100%
- Only 4% of the business is cleared outside the top 10
Futures Etc
Finally, I thought it worthwhile to introduce futures & options into the FCM league table this time around. Lets look at March 2016 standings, where I break out the components of the total margins required into the respective buckets of Seg, Part 30, and Swaps:
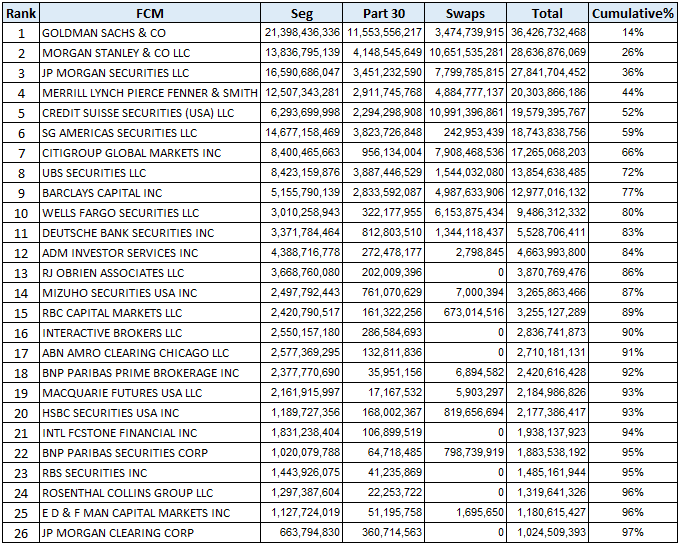
I’ve only included the FCMs with margins of $1 billion or more, which limits the list to 26 of the 55 FCMs that show any margins. The concentration here is not quite as pronounced as we see in swaps, but still interesting that 80% of the business goes through the top 10 FCMs.
Summary
Overall, the data seems to support the notions that:
- Any growth in the US clearing business is in swaps
- The swap rankings seems to tell me that US banks generally faring better than European banks. The exception being the 2 Swiss banks.
- Concentrations of the business seem stable in swaps – the top 5 handling 70% of the business
- Concentrations of the business across futures and swaps more interesting – the top 5 handling 50% of the business.
I have to wonder about what is going to happen when mandatory clearing in Europe takes off. Are the European banks cooling off in their US businesses in anticipation of greater European business? Or will any European mandate mean that they have to shrink their US clearing businesses even further?
Time will tell. We’ll be keeping an eye on it.