It is more than a year since I last looked at FX NDF Trading On SEFs (Jan 2014) and as that was one of our Top 10 Blogs of 2014, it is long overdue for me to see What the Data Shows.
April 2015
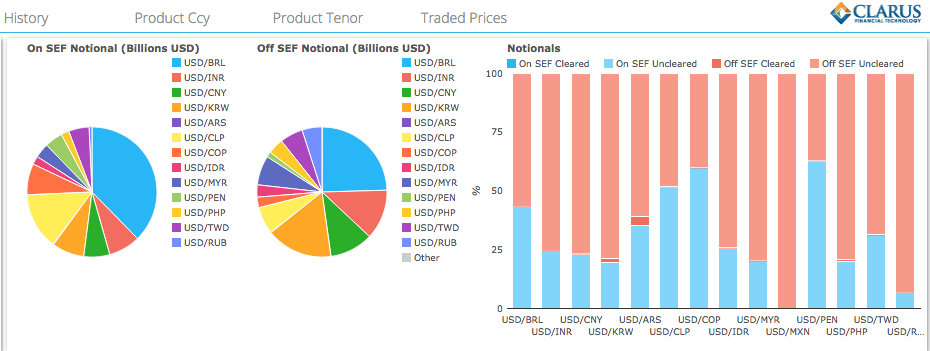
Lets start with SDRView and the latest volumes in the four largest currency pairs (BRL, INR, CNY, KRW) for both On SEF and Off SEF.
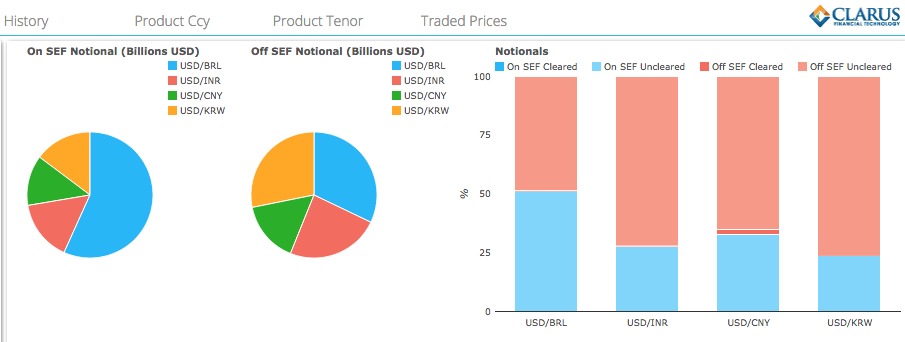
Which shows that from April 1-27:
- USD/BRL is the largest pair in gross notional terms, both On SEF and Off SEF
- USD/BRL volumes are $118 billion On SEF and $112 billion Off SEF
- USD/BRL has the highest On SEF vs Off SEF percentage of 51%
- USD/BRL volume is all Uncleared except for a tiny $170 million
- USD/KRW is the second largest pair, with $31b On SEF and $99b Off SEF
- USD/KRW has the lowest On SEF vs Off SEF percentage of 24%
- USD/INR volumes are $32b On SEF and $84b Off SEF
- USD/CNY volumes are $27b On SEF and $55b Off SEF
- USD/CNY has the highest cleared volume of $1.8 billion
- Cleared volume is a tiny fraction (<1%) of overall volume
April 2014
Lets look at the same data for the corresponding period in 2014 to see what has changed.
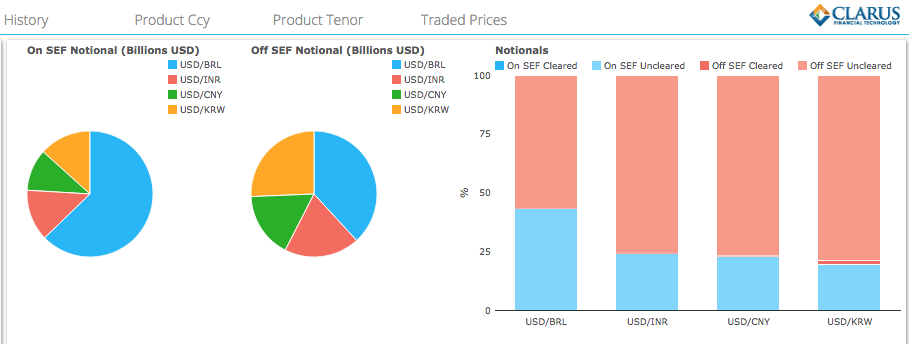
Showing that:
- USD/BRL was also the largest pair in gross notional terms in April 2014
- USD/BRL volumes were $132b On SEF and $171b Off SEF
- Both of these are lower in April 2015, particularly the Off SEF
- Probably a reflection of the weakening BRL currency and the state of the Brazilian economy
- USD/BRL On SEF was 44% and has now risen in a year to 51%
- Remaining Ccy Pairs On SEF percentages have also increased by similar amounts
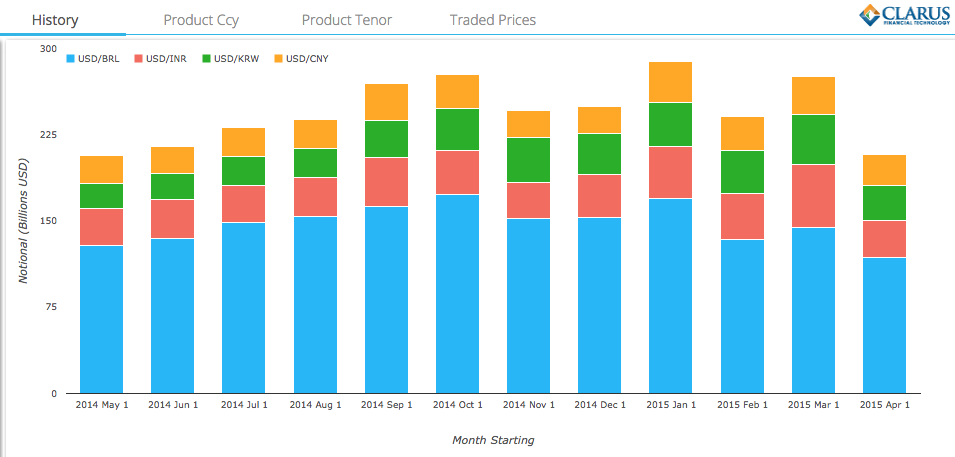
Volume Trends
Lets look at volumes in the past year in gross notional terms.
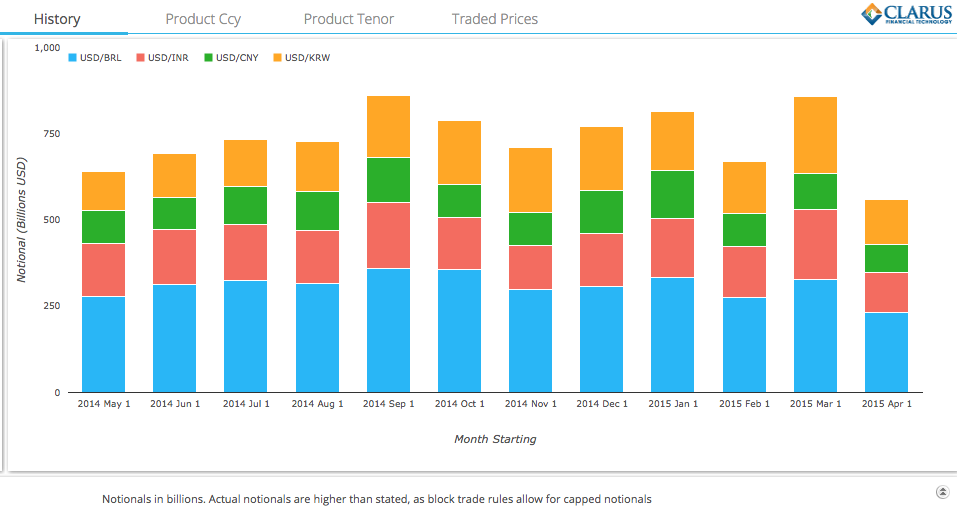
Showing that for both On SEF and Off SEF:
- September 2014 and March 2015 are the two highest volume months
- No noticeable trend in monthly volumes over the year
- USD/BRL volumes $250b to $360b per month
- USD/INR volumes $120b to $200b per month
- USD/CNY volumes $80b to $140b per month
- USD/KRW volumes $120b to $230b per month
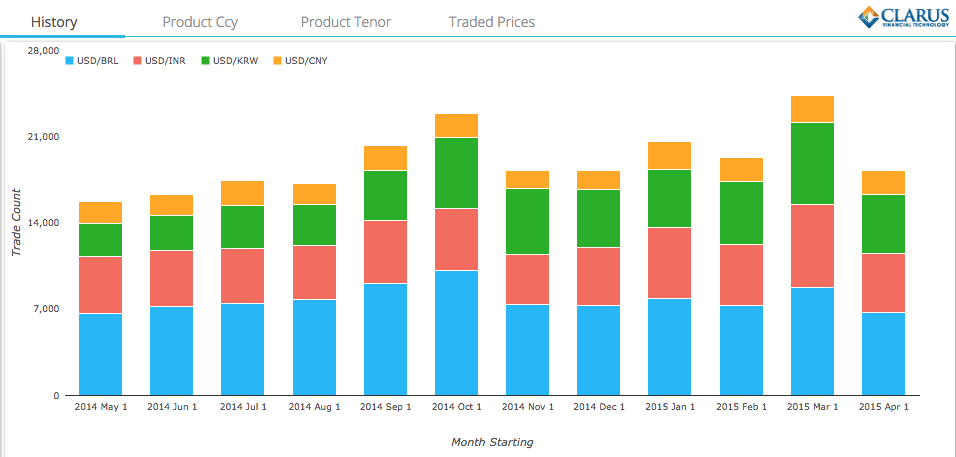
Next lets look at trade counts:
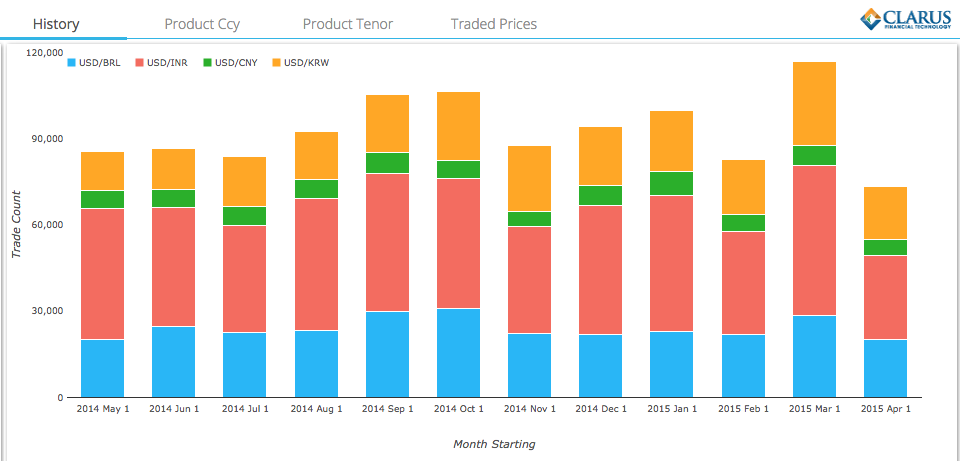
Showing that for both On SEF and Off SEF:
- March 2015 had the highest number of trades
- USD/BRL volumes are @ 25,000 trade per month
- USD/INR volumes are @ 45,000 trades pm, so much smaller deal size than other pairs
- USD/CNY volumes are @ 6,500 trades pm, so much larger deal size than other pairs
- USD/KRW volumes are @ 18,00 trades pm
On SEF Volumes
Perhaps we should check just On SEF volumes to see whether we can see a trend, first trade counts.
Next Gross Notionals.
Showing that:
- We see a good month on month increase each month from May to Oct 2014
- From Nov the USD/BRL volumes in particular are down
- While other paris continue with the increasing trend
This suggest that SEFs captured more of the total volume over the year.
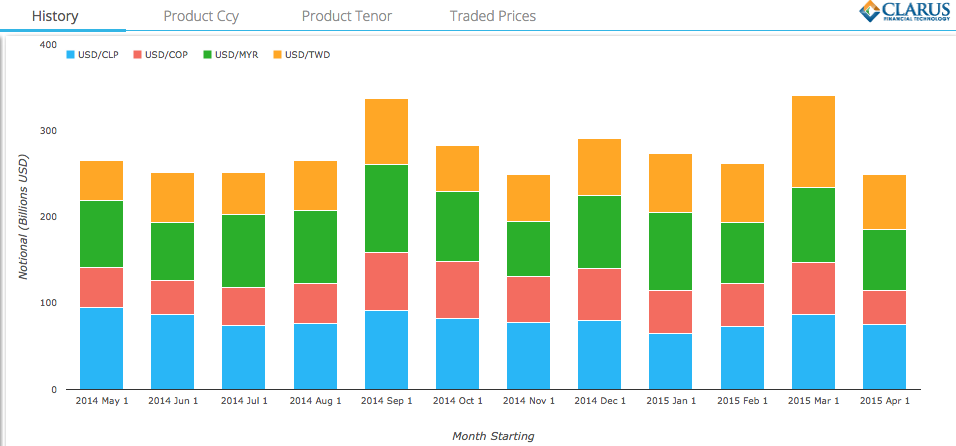
Other Currency Pairs
So far we have focused only on the four largest pairs, so what about the others. Lets look at April 2015.
Which shows:
- There is data in 13 currency pairs
- USD/CLP (Chile) has been larger On SEF than all others except for USD/BRL
- The next largest are USD/MYR, USD/TWD, USD/COP (Malaysia, Taiwan, Columbia)
Monthly volumes for each of these for the past year are substantial and in aggregate almost 50% of the four largest pairs.
Thats enough charts from SDR data.
Which can only mean onto SEF Market Share, but before we do lets take a quick peek at Cleared volumes.
Cleared NDF Volumes
Now we know that mandatory clearing of FX NDFs has been kicked to the touchline or into the dust, in both the US and Europe. We also know from the prior sections that a tiny fraction of volume is cleared.
Lets see what CCPView can show us for 2015.
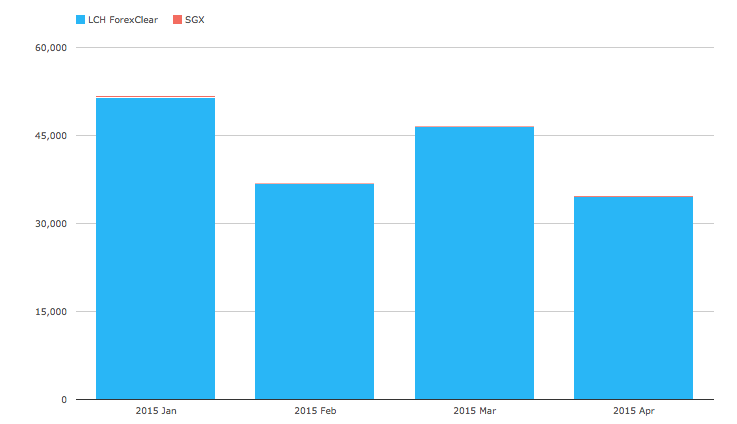
- LCH ForexClear has the vast majority of the volume, with $50 billion in Jan 2015
- SGX has a small amount, with $200 million in Jan 2015 (IDR, INR, MYR, KRW, TWD)
- No other CCP has any volume in the period (HKEx had a small number in Nov 2014)
- Even the LCH Jan 2015 $50b in all currency pairs is dwarfed by the the On SEF Volume in just USD/BRL ($150b).
Lets take a look at LCH 2015 (Jan-Apr) volumes broken out by the 8 pairs we have highlighted above.
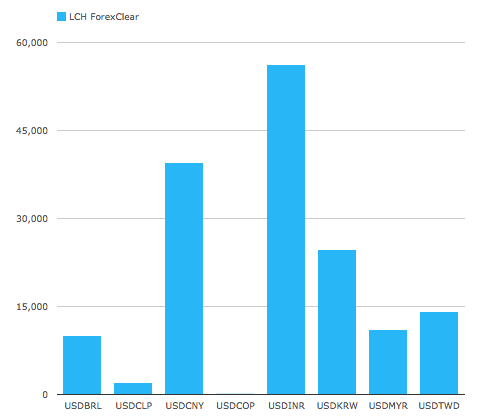
- Interestingly USD/INR is the largest by some way, followed by USD/CNY and then USD/KRW
- The largest traded NDF pair for US investors, USD/BRL, is the sixth largest at LCH this year
- In-fact the Asian NDF pairs are much more prominent at LCH
- While the LatAm ones are tiny, relative to their markets
- I guess the London time-zone has a key impact
Now lets move onto SEF market share.
SEF Market Share
Using SEFView, lets start by looking at monthly NDF volumes for 2015 year to date by SEF:
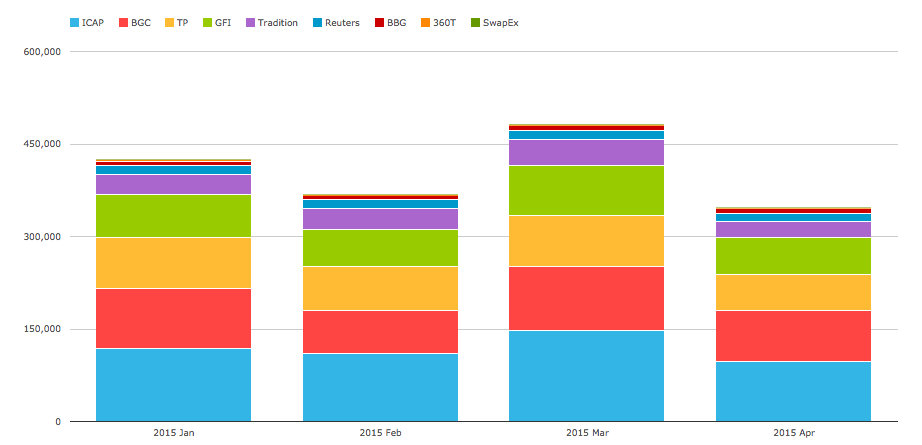
Nice to have some stacked bars and colours again (come on you CCPs or should I say regulators 🙂 ).
ICAP seem to be the largest. Lets get the percentage share table.
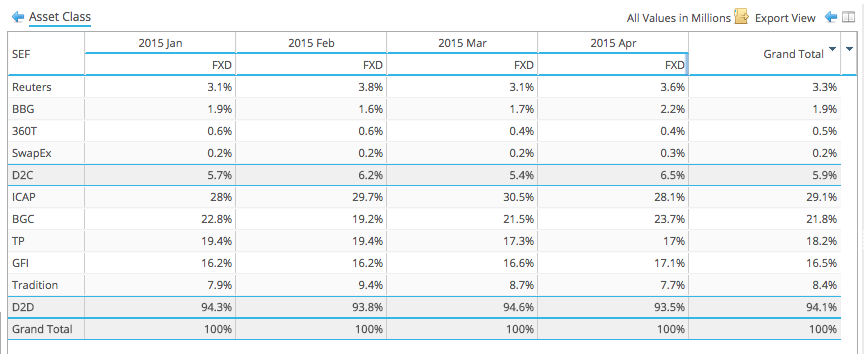
Showing that:
- D2C share is 6% and D2D is 94%
- Reuters is the largest D2C with 3%, followed by BBG with 2%
- Next are 360T 0.5% and SwapEx 0.2%
- ICAP is the largest D2D with 29%
- BGC is next with 22%
- Tullets has 18%, GFI 17% and Tradition 8%
What about share in specific Currency Pairs?
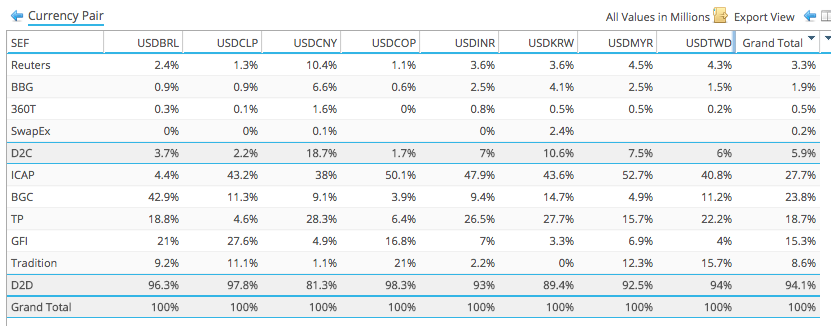
Showing that:
- D2C SEFs have a larger share in USD/CNY at 19%, with the next largest in USD/KRW at 11%
- So the D2C average of 6% is let down by the other currency pairs
- ICAP is largest in every currency pairs except USD/BRL
- BGC is the largest in USD/BRL and strong in USD/KRW
- TP is strong in USD/CNY, USD/KRW, USD/INR, USD/TWD (the Asian ones)
- GFI is strong in USD/CLP, USD/BRL, USDCOP (the LatAm ones)
- Tradition has good share in USD/COP, USD/TWD, USD/MYR
Thats it for SEF market share.
Summary
FX NDF volumes are dominated by USD/BRL, USD/CNY, USD/INR, USD/KRW
USD/BRL is the largest pair with monthly volumes between $250b to $360b
USD/BRL On SEF percentage in Apr 2015 is 51% compared to 44% in April 2014
Overall volumes in these 4 pairs do not show a discernible trend in the past year
Sep 2014 and Mar 2015 were the highest volume months
On SEF volumes show increases month on month from May to Oct 2014
Followed by a drop, mainly in USD/BRL and a rise in 2015
USD/CLP has volume in Apr 2015 that is higher than all pairs except for USD/BRL
Global Cleared Volumes are <1% of US traded volumes
LCH ForexClear has the vast majority of NDF Cleared volume
SEF Market Share in 2015 to date, shows D2D is 94% and D2C is 6%
ICAP is the leader in D2D with 29% share
Reuters is the leader in D2C with 3% share
I won’t leave it so long before looking again at FX NDF data.