We recently added a new feature to SDRView Professional, which for the first time allows us to see the intra-day price behaviour of Swaps. This article will present and discuss what we can see from this.
USD Interest Rate Swaps
Lets start with USD IRS traded On SEF on 3-Feb-2014.
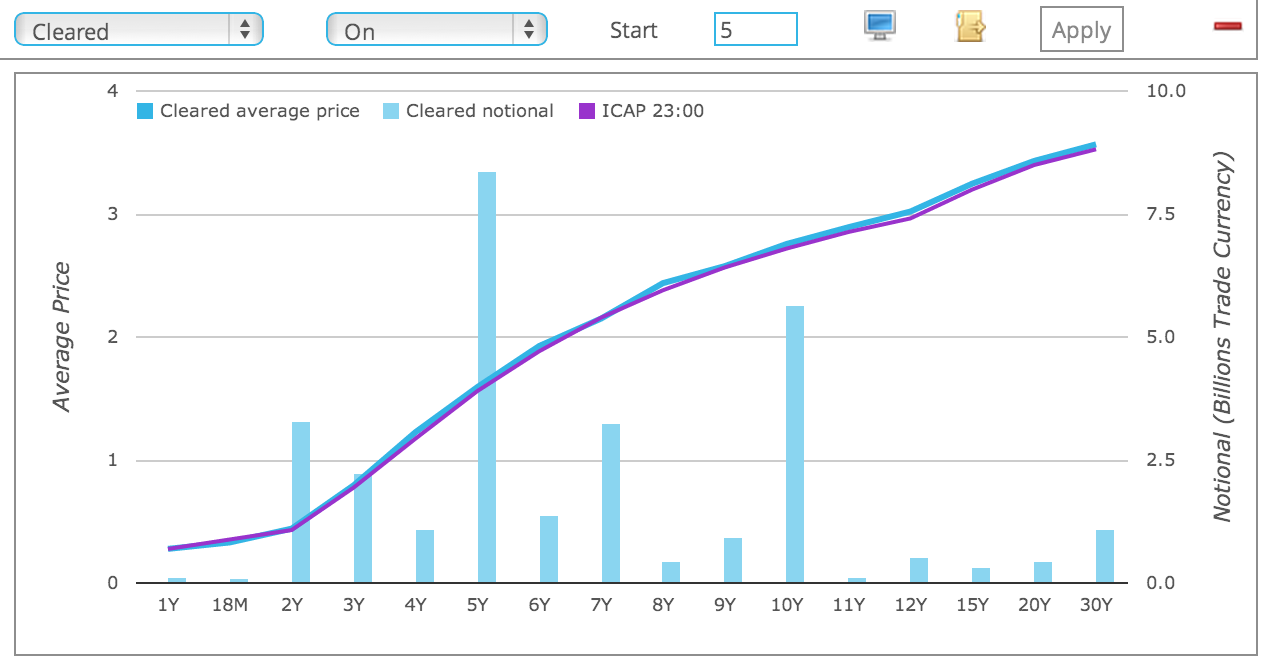
The chart shows:
- the volume traded in each maturity tenor of standard vanilla spot starting usd cleared swaps
- the blue line is the average price for each tenor
- the purple line is the 6pm EST (23:00 UK) ICAP mid-market consensus price
- as is usual the highest volume is in 5Y at more than $8 billion
- the average 5Y price is 1.592 and the 6pm EST ICAP price is 1.56
- the table (not shown) also shows 95 trades with a high price of 1.637 and low of 1.55
- which at almost 9 basis points is a large move for USD IRS
The interesting question now is to see the intra-day price behaviour.
USD IRS 5Y On SEF Intra-Day
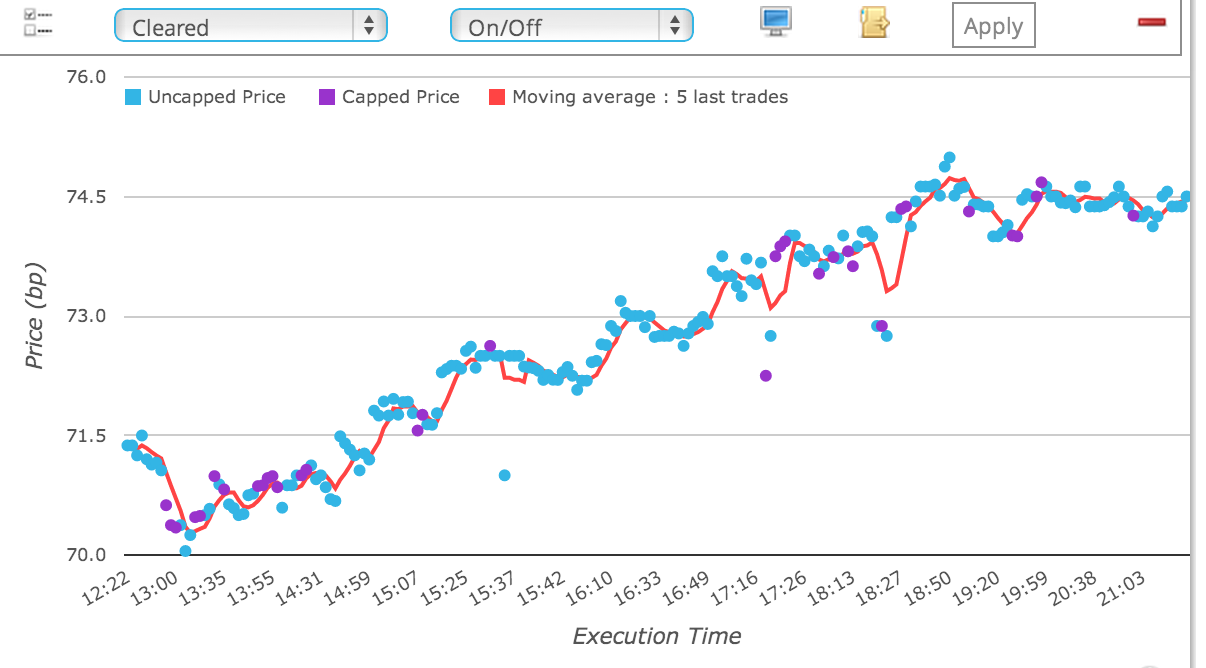
By drilling down on the 5Y tenor, we can now see the following:
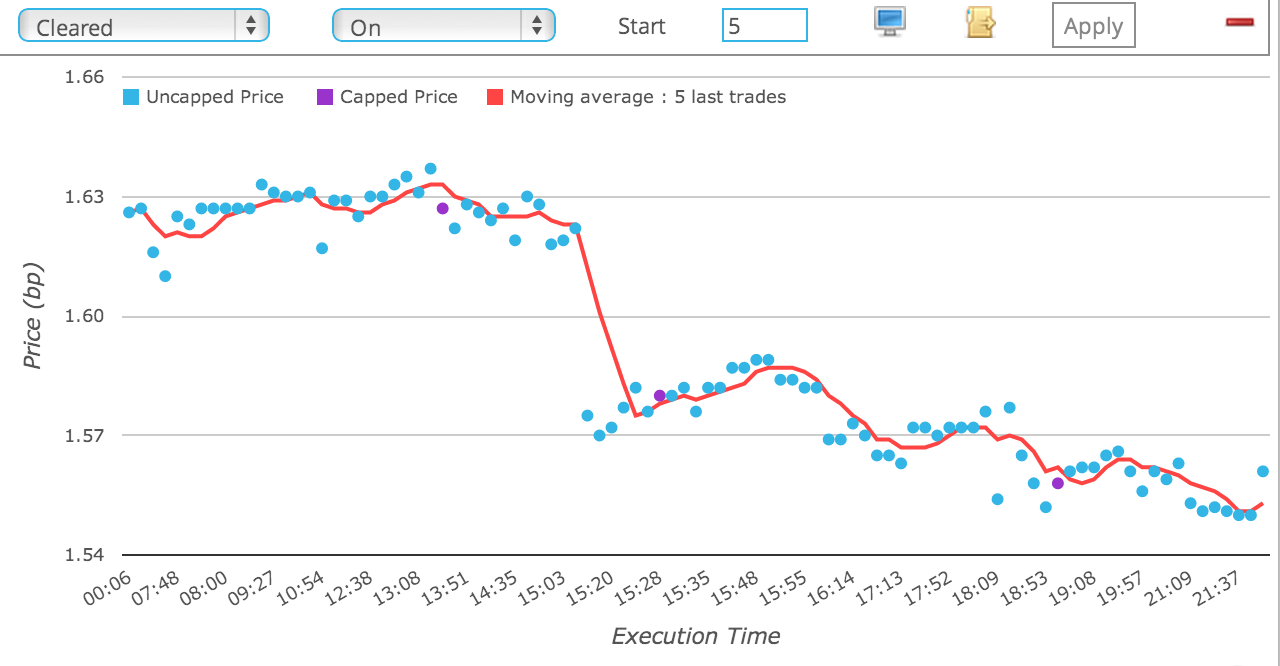
This chart shows:
- Prices by Time of Trade Execution (time is LON in our case)
- Each dot represents the price of a trade at a specific time
- The red line is a moving average of the price of the last 5 trades
- So we can now very clearly observe the intra-day price behaviour
- What can we say?
- Firstly the market started trading at 1.626
- And traded around the 1.63 level up to 14:36 LON (9:36 NY)
- Then it dropped 5.5 bps to 1.575 at 15:13 LON (10:13 NY)
- It rallied 1bps to 1.587 at 15:50 LON (10:50 NY)
- And then continued its downtrend trend
- Repeated two more rallies but continued downwards
- Ending the day at 1.55 at 21:37 LON (4:37 NY)
- With a final trade at 1.56 at 22:29 LON (5:29 NY)
- (Don’t forget that we do not know which trade price is bid/offer or pay/rec)
- (So 1.55/1.56 may represent the bid-offer at that time)
- And the purple dots are the capped block trades
- Of which there were only 3 out of 95 trades.
So we can see exactly how the 5Y IRS price moved down from 1.626 Open to a 1.56 Close.
A move from Open to Close of 6.6 basis points.
USD IRS 5Y Off SEF Intra-Day
Lets now look at the Off SEF trades on this day.
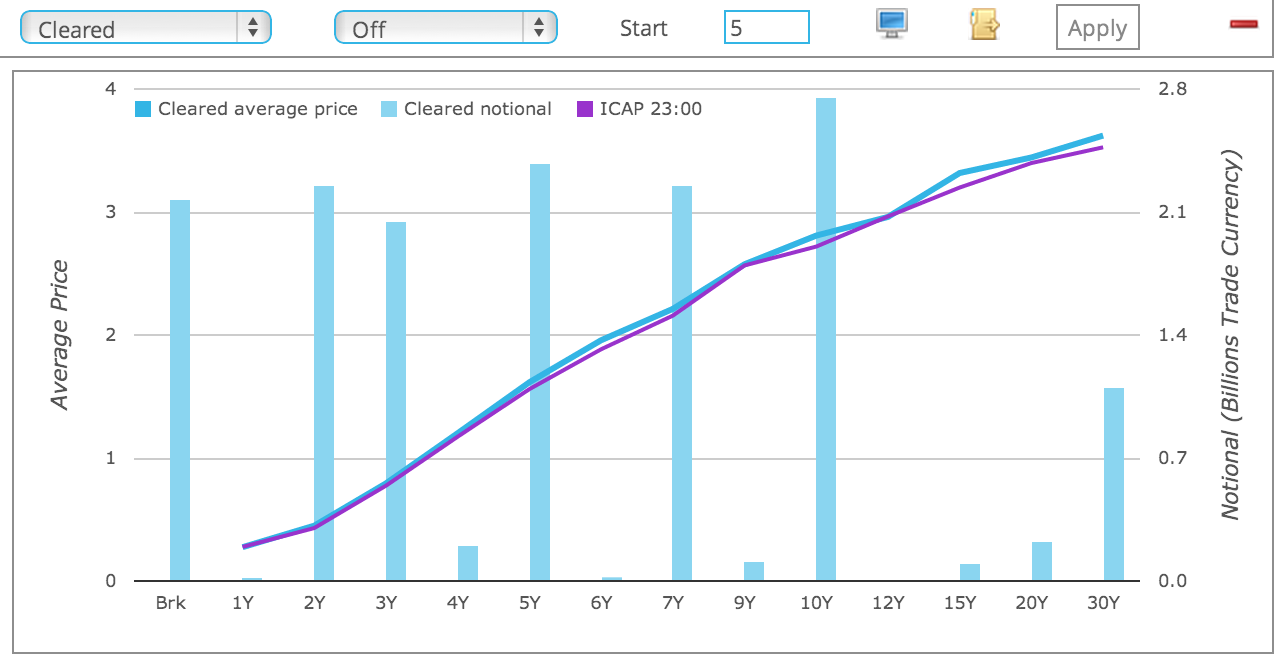
The chart shows:
- this time each of 2Y, 3Y, 5Y, 7Y, 10Y have volumes of around $2 billion
- broken date tenors (which are not traded on SEFs) represent $2 billion (or 28 trades).
- the average 5Y price is 1.616
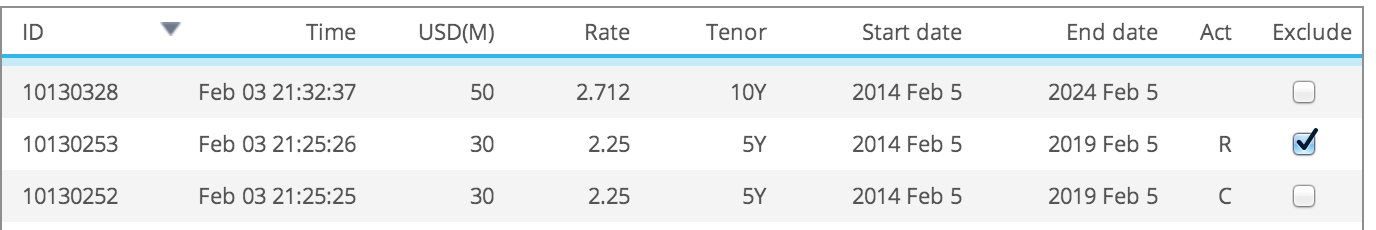
- the table (not shown) also shows 39 trades with a high price of 2.25(!) and low of 1.55
The interesting question now is to see the intra-day price behaviour.
USD IRS 5Y Off SEF Intra-Day
By drilling down on the 5Y tenor, we can now see the following:
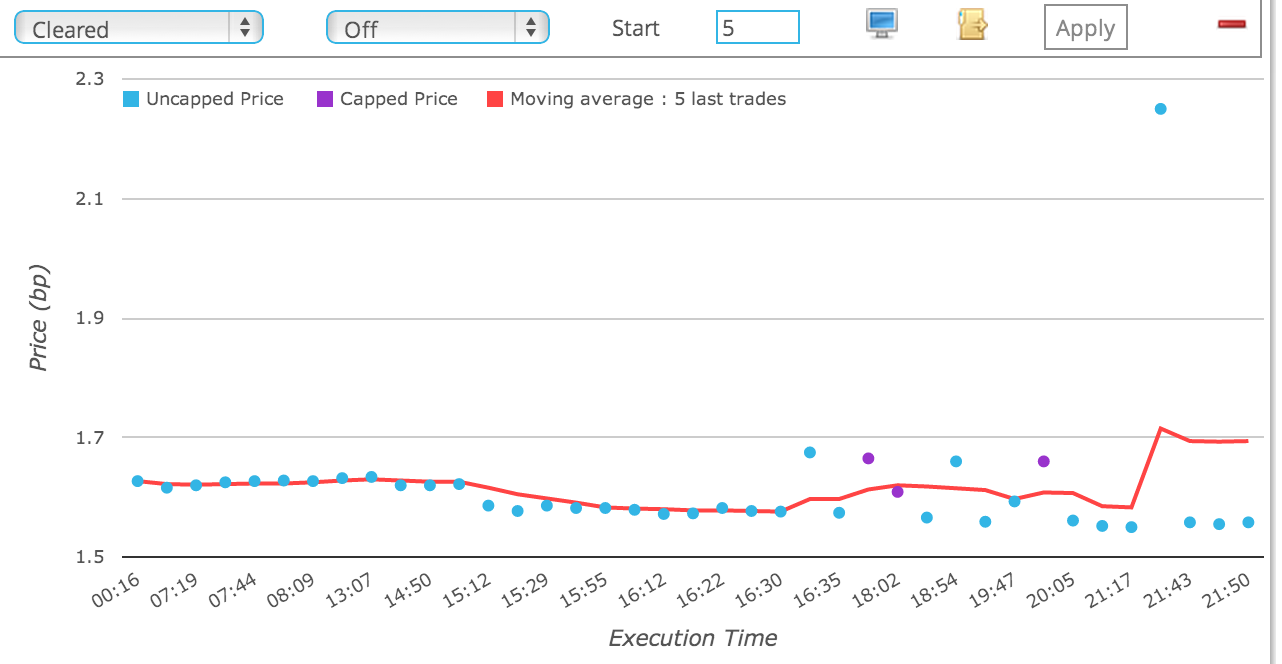
Which is not what we expected!
Ah, that 2.25 price is causing the vertical axis to be stretched and flattening our curve.
Now looking at that trade, we cannot see any obvious reason on the DTCC SDR feed as to why it should be at a price of 2.25.
There is no fee to bring the price back to par, there is no way to tell whether it is a MAC trade.
So all we can do is exclude.
Luckily, we have just such a feature in the Trade List.
So now if we look at our chart again.
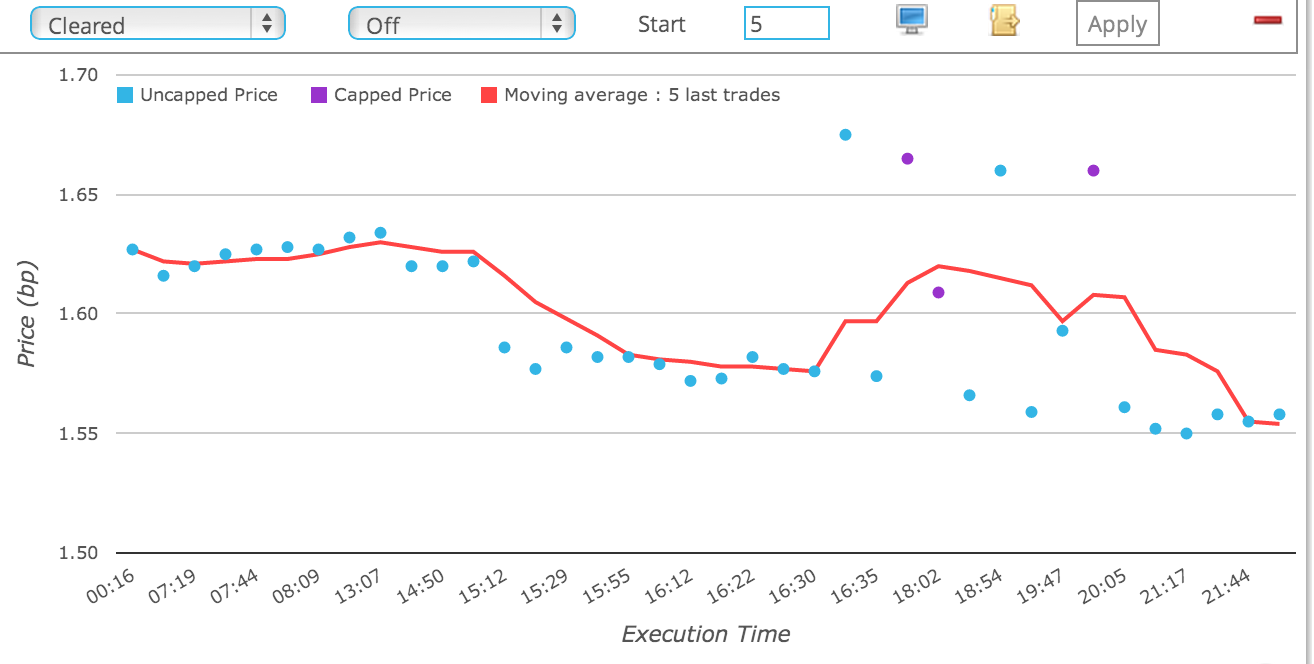
Much closer to what we saw for On SEF:
- Firstly the market started trading at very close to 1.63
- And traded around this level up to 15:11 LON (10:11 NY)
- Then it dropped 4 bps to 1.586 at 15:12 LON (10:12 NY)
- It rallied at 16:30 LON (11:30 NY)
- And then continued its downtrend trend
- With a final trade at 1.558 at 21:50 LON (4:50 NY)
- So far consistent with what we saw for On SEF
- But.
- (There is always a but)
- There are 4 trades at 16:31, 17:00, 18:54, 19:59
- With prices of 1.675, 1.665, 1.66, 1.66
- Of which the first and third are capped block trades
- All of which are more than 5 bps from our (red line) true price
- With nothing on the trade record to indicate why?
Well the reason may be due to some missing information on the SDR record (fees, package, …).
It cannot be credit risk or collateral terms as these are Cleared Swaps.
They might be very large block trades, with a notional far higher than $240 million, which got done away from the standard size trade.
Or they might be clients not getting best execution.
I leave you to decide which.
CDX NA IG 5Y
What else can we look at?
Well we can repeat the above for any tenor or currency or product.
Lets look at another actively traded product; in this case CDX NA IG 5Y.
Which on 3 Feb 2014 had 220 trades at > $12 billion, ON and Off SEF.
I could start making observations on this; for instance the number of block trades.
However I fear, that I have kept you reading in the deep for far too long.
So I will leave those of you that are interested to try for yourself in SDRView Professional.
Summary
Viewing intra-day prices graphically is very interesting and informative.
We can observe the price trend over the trading day.
We can see which trades are done away from the market.
We can isolate block trades prices from standard trades prices.
Meaning we are better informed on what is happening today, what happened yesterday.
After all history is our guide and trends are our friend.