- We combine SEFView and SDRView to strip out Compression flows from D2C SEFs.
- This allows us to make interesting comparisons between the Dealer to Client (D2C) and Dealer to Dealer (D2D) markets.
- D2D USD volumes have stagnated year-on-year.
- D2C volumes have exploded higher by 190%.
- This is before we even start talking about EUR swaps….
- Could this march of volumes on D2C platforms tear down the silo’d D2D venues and finally give us the all-to-all market place that Dodd-Frank envisioned?
SEF Market Share
I feel like it’s been awhile since we’ve really drilled-down into the SEF market share picture – outside of our regular monthly reviews. Whilst this was a hot topic back in the days of Tod’s weekly updates, the industry feeling has recently tended towards more of a “status-quo”. Something we’ve also tended to highlight in our own blogs.
Can you feel the “but” coming? I was recently asked to do some comparisons between 2014 and 2015 figures, and I was a little startled to see the story behind the figures. Read on below to see what I mean.
It all started with this chart
SEFView has a loooooong history now, going back to October 2013. Back in 2014, we found it difficult to make sense of some of the volume jumps we saw as the picture was constantly clouded by expiring non-action clauses, IMM rolls and new electronic trading workflows such as Compression and Compaction, led by TrueEx.
However, in the latter half of 2014 (and particularly during 2015), we haven’t seen the same type of regulatory upheaval. But we’ve still tended to look at the most recent 3 months worth of data in our monthly reviews.
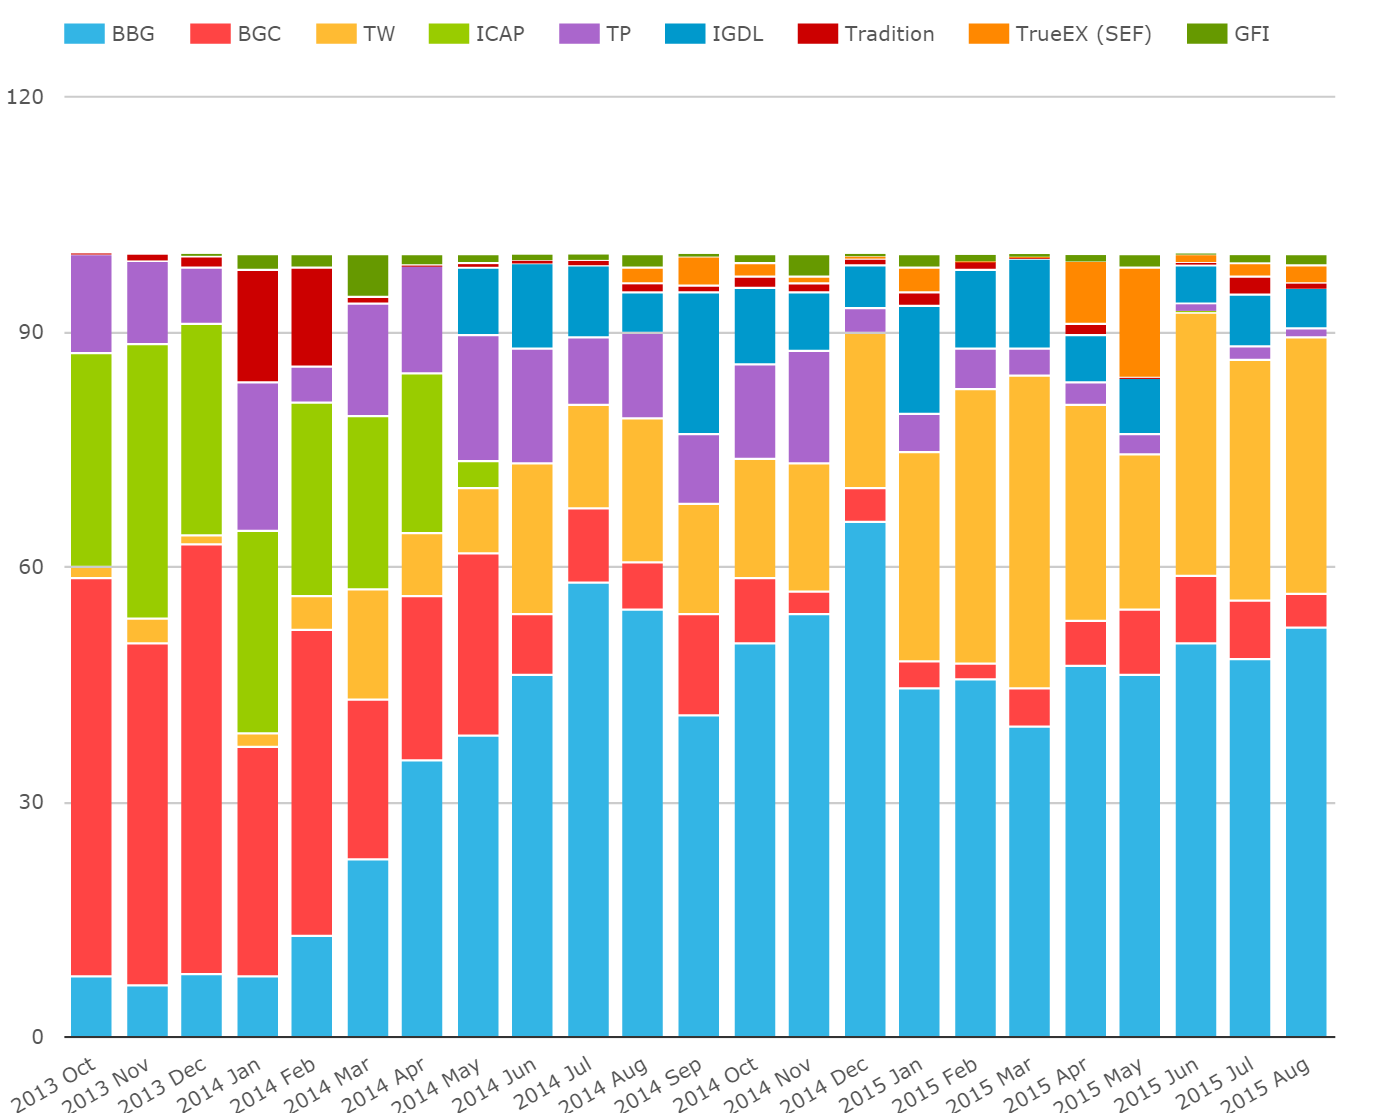
So I’m kind of guilty of not running this query before in SEFView. This shows USD Swaps market share on a DV01 basis since SEF-time began (October 2013):
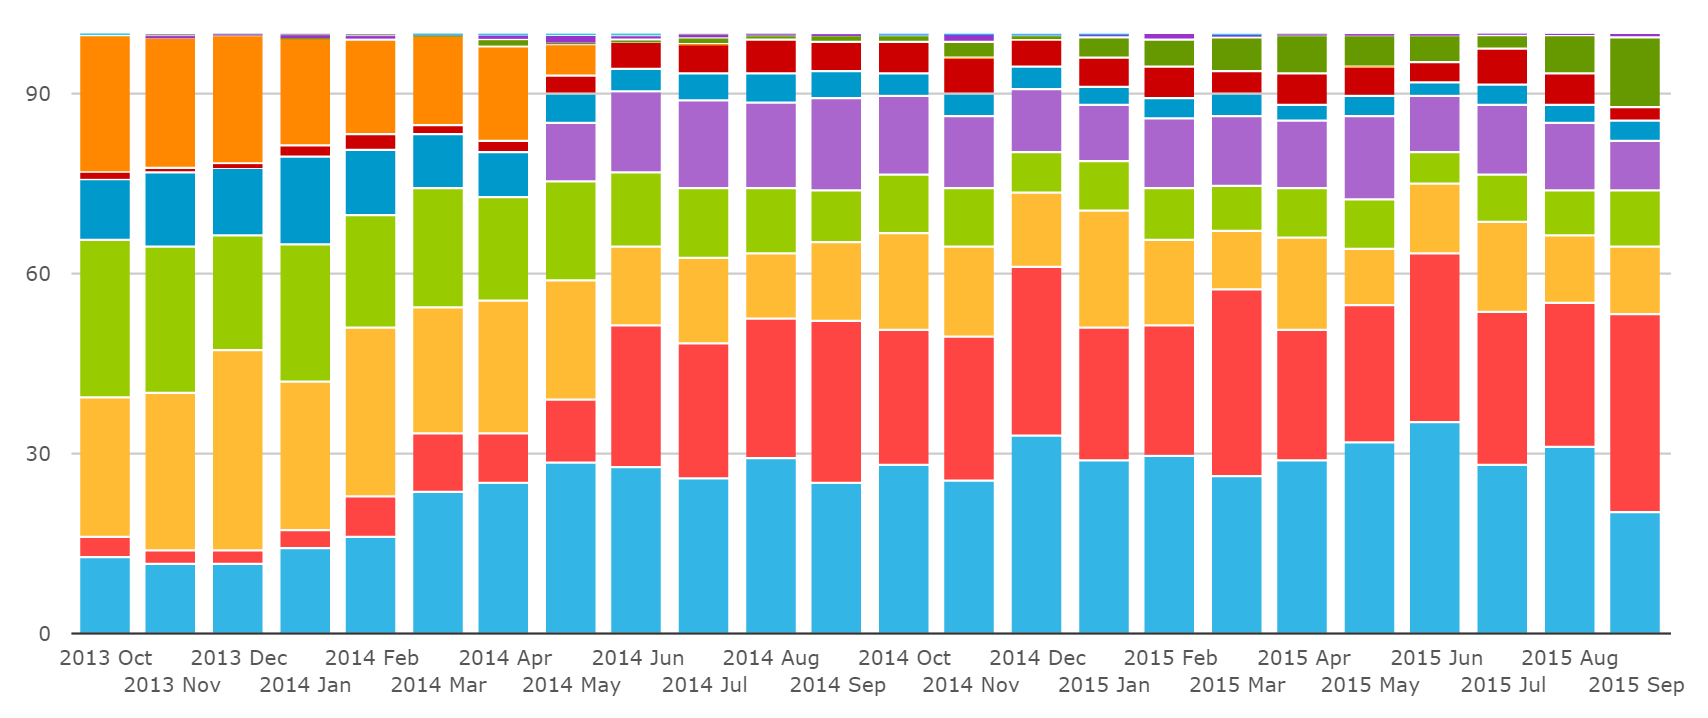
Those bottom blue bars are Bloomberg and the red bars are Tradeweb. What we can see is striking:
- Bloomberg started with a market share of 12.8% for USD Swaps in October 2013.
- Tradeweb started with a market share of 3.2% for USD Swaps in October 2013.
- Come August 2015 (our last complete month), BSEF accounts for 31% of trading, Tradeweb 23.8%.
And if we look at all volumes, we see a generally increasing trend:
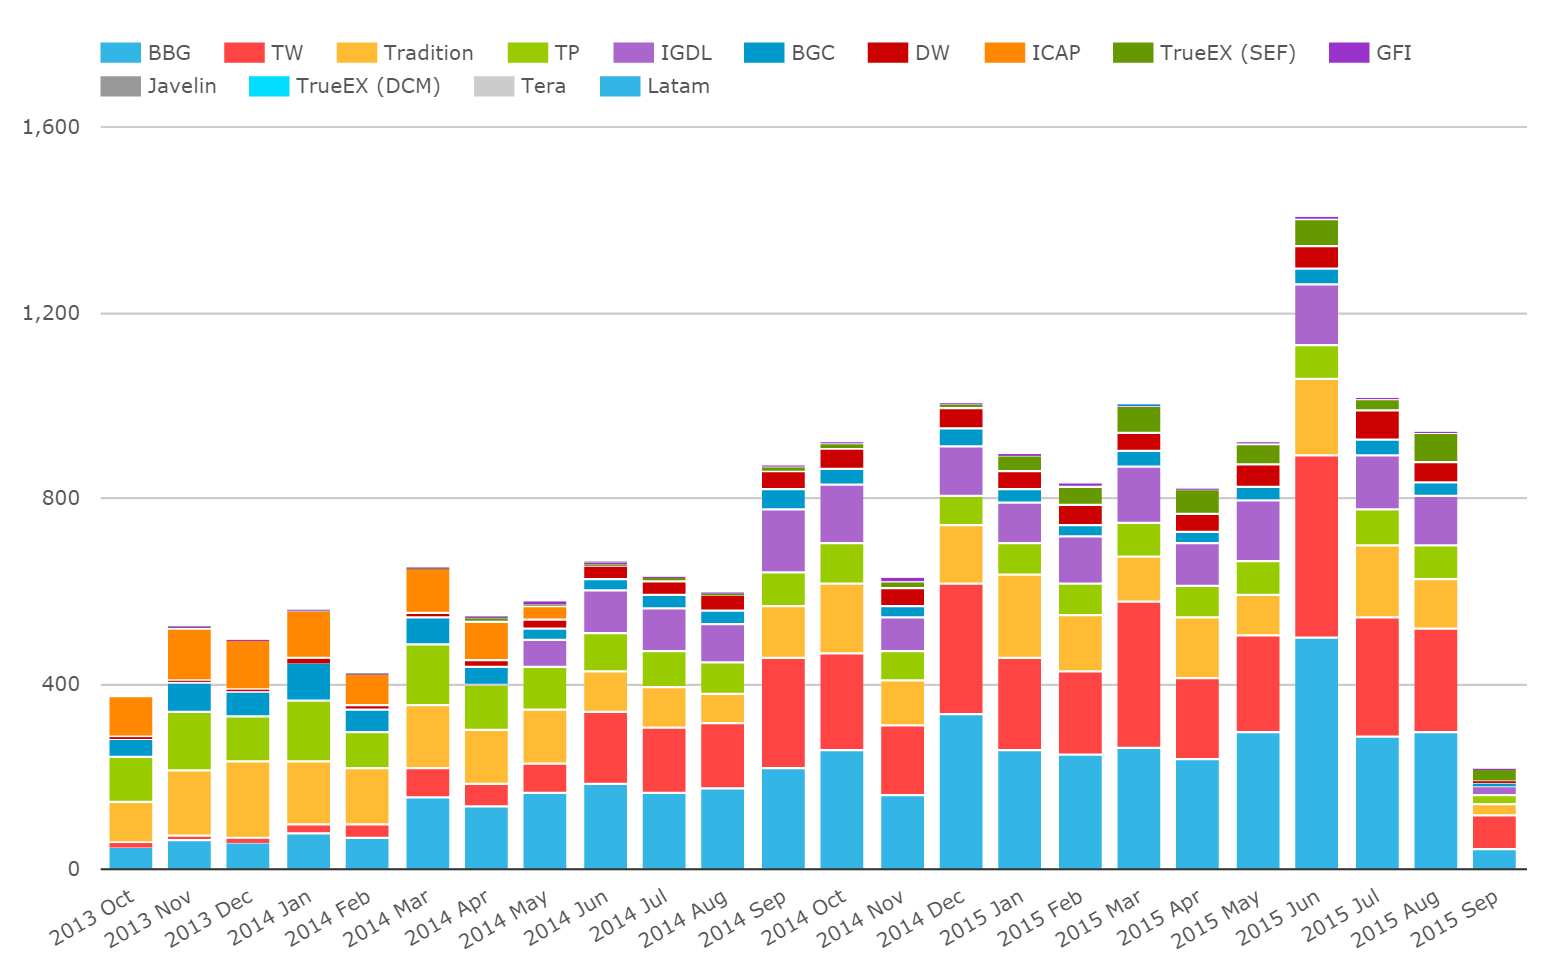
Which raises the question – does a rising tide lift all ships equally?
Compression
My lazy interpretation of these numbers has always been the same. Dealers were first to trade on-SEF, therefore the D2C venues benefit asymmetrically as different end-user exemptions expire. More importantly, the D2C venues have been able to create new work-flows and slowly tailor their offering to capture more portfolio maintenance operations. These “volumes”, such as Compression, are not related to liquidity (they are also not price-forming transactions) and are charged at different execution rates accordingly.
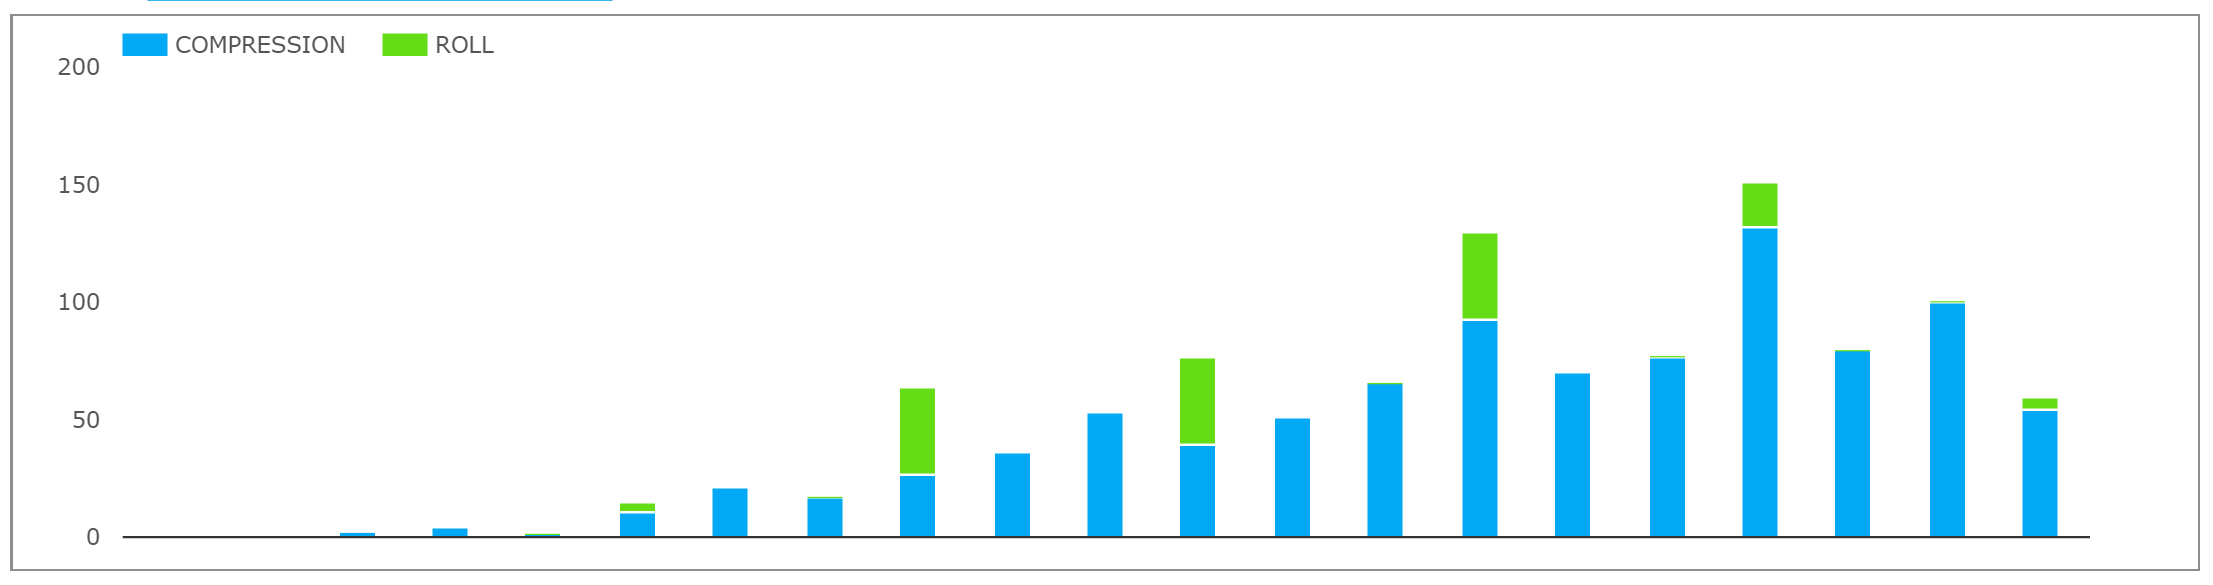
The above reasons are why we always strip out Compression flows from our Monthly Review series. We’ve recently added a Compression time-series in SDRView Res by way of our CustomView. Here, we can see the growth of Compression for Bloomberg on the top-chart and Tradeweb/TrueEx combined on the bottom:
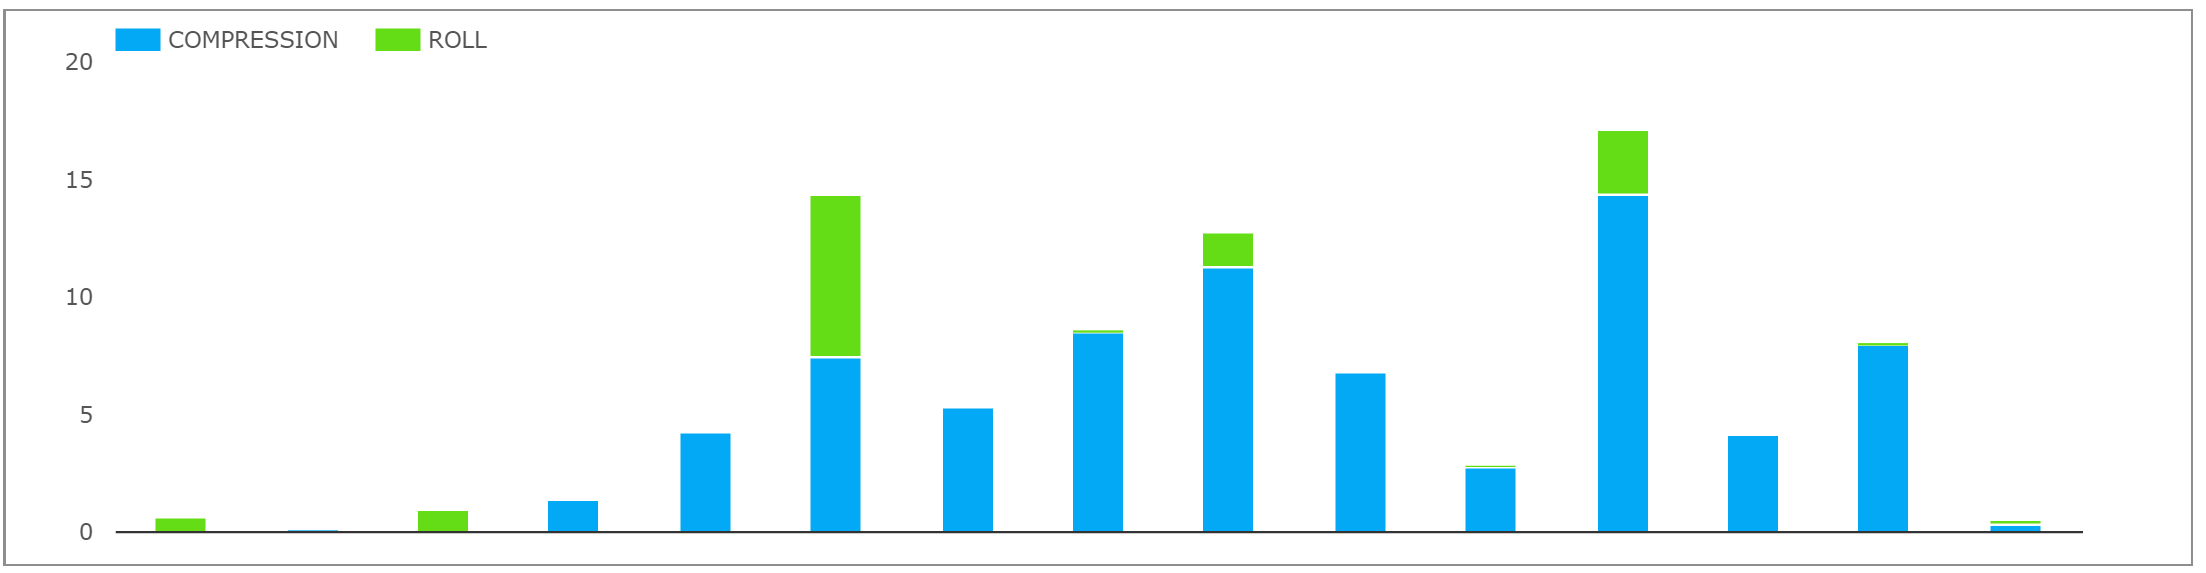
(Apologies, I seem to have inadvertently cropped the date axis, but you get the picture…)
These numbers now allow us to collate a time-series for all USD SEF Flows, ex-compression. It’s been a little fiddly to create as our previous study showed. In summary, it showed that:
- Total Compression flows accounted for 5% of all flows in 2014
- Total Compression flows accounted for 20% of all flows in 2015!
SEF USD Swap Market Share by DV01
Therefore, let’s reproduce the market share chart from SEFView, but excluding Compression:
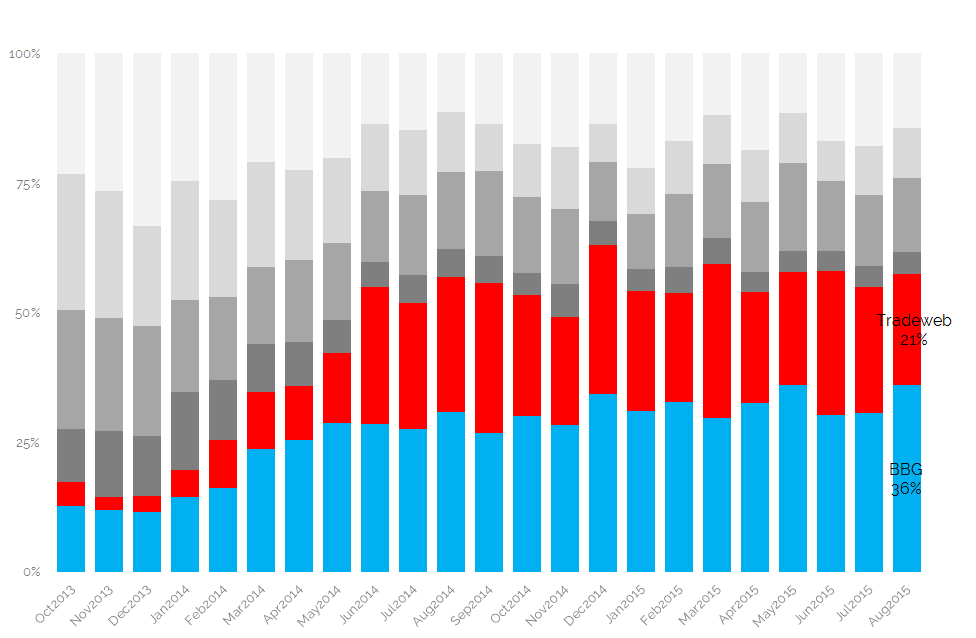
Showing that;
- Bloomberg market share actually increases from 31% to 36% (with Tradeweb falling to 21% ).
On the whole, it’s fair to say that stripping out these Compression flows don’t change the headline numbers that much. So why the blog today? The interesting story comes from comparing year-on-year changes on this new data set.
D2D versus D2C (ex-Compression)
First off, have a look at the time-series of D2C market share versus D2D venues:
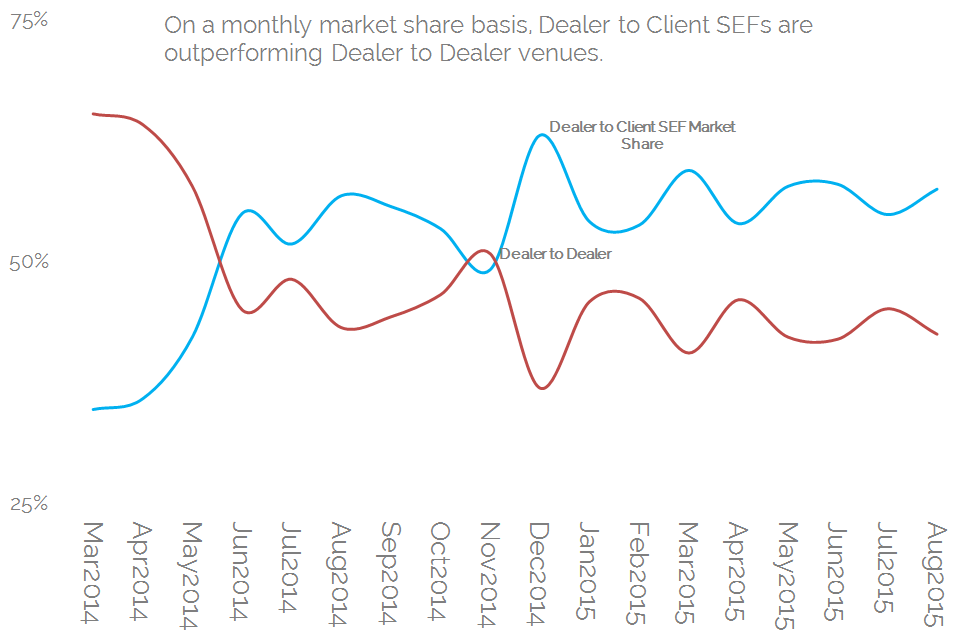
Showing:
- A “big bang” around May 2014 when D2C venues really took off.
- A steady widening in the difference ever since.
- In August 2015, D2C venues accounted for 57% of USD swap volumes excluding Compression.
Percentages and Absolutes
The D2C venues haven’t won the D2D’s existing business however. When we look at it in absolute terms, we see that D2D venues have retained their volumes from last year. But D2C venues are responsible for 100% of the swap market growth this year:
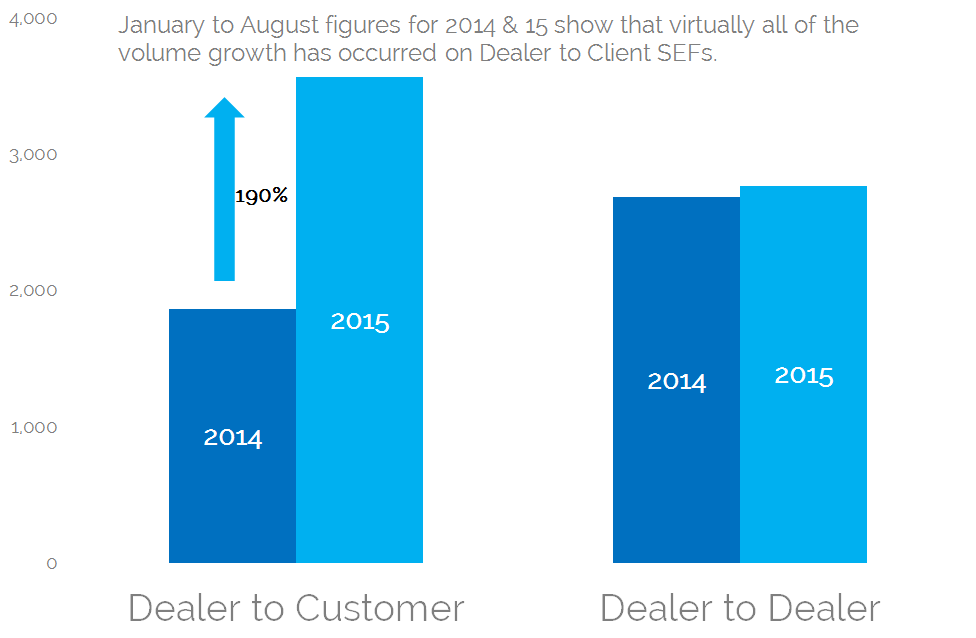
Remember that this chart EXCLUDES Compression flows. So we could really dwarf the D2D market by including those if we were so inclined.
Month-by-Month granularity looks a little better
Fortunately for the D2D venues, there might be hope. If we expand the above chart to look at a monthly time-series, we see that D2D venues had a truly lousy start to 2015 and have been trying to claw back ground ever since:
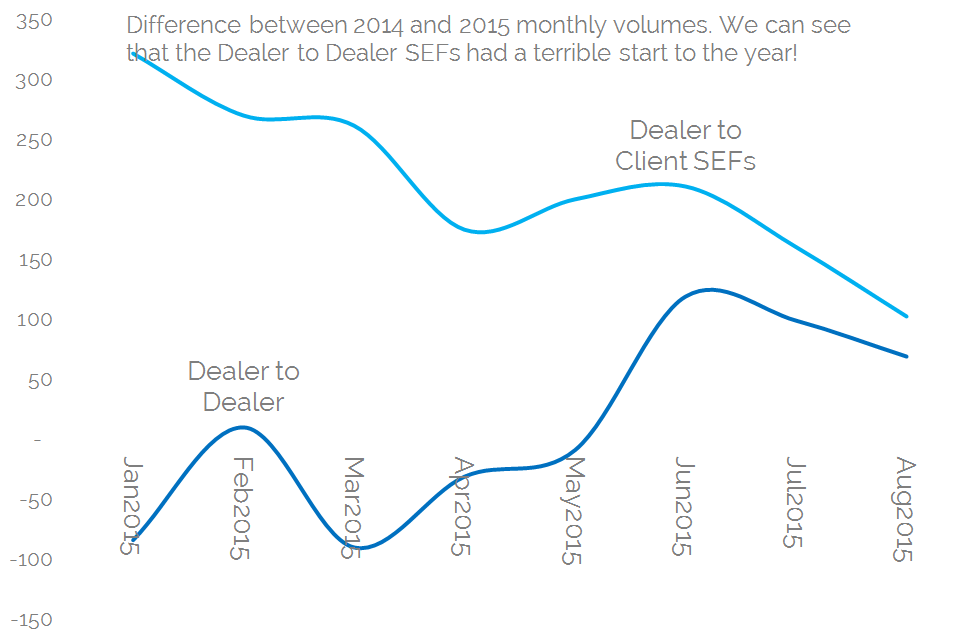
Showing:
- In Q115, D2C SEFs saw a huge 290% growth in volumes compared to Q114.
- Whilst D2D SEFs saw volumes shrink to 86% of 2014 levels.
- Q215 saw D2D SEFs fighting back, increasing 2014 volumes by 8%
- But D2C SEFs were still able to extend their market share by increasing volumes by 174% compared to the same period in 2014.
- Q315 sees D2C still nudging ahead with one month to go……
In Summary
- The ability to compare 2014 and 2015 data-sets is highly valuable.
- The most interesting trend is the growth of Dealer-To-Client volumes.
- We have seen a very rapid growth across these venues in every metric we look at – absolute volumes, market share percentage and volume growth compared to 2014.
- Volumes are now consistently greater on Dealer-to-Client SEFs (even though there are only two venues) than across all 4 IDBs.
- With no growth evident across IDB SEFs this year, I’m inclined to think that volume growth across a platform is achieved through on-boarding new counterparties……
- ….rather than winning volume from competitors or convincing a saturated market to trade more often. It would be interesting to see how many accounts are now trading on Bloomberg and Tradeweb.
- It does rather beg the question as to why IDB SEFs continue to operate in a ring-fenced manner….
- …shouldn’t they now be charging more for their “exclusive” service and hence increasing brokerage rates?
- Or is the growth of Bloomberg market share entirely down to their $10 a trade fee structure?
Either way, if you sat down with a clean piece of paper right now, an all-to-all venue is the only one that can pass the numbers test.
And in EUR Swaps….
It’s interesting to see such a seismic shift occurring in USD Swaps, the most mature of the SEF markets. Have a look at the dominance of Bloomberg in EUR markets (where they don’t even offer Compression yet…):
Remember in USD swaps, they started out with just a 12.8% market share. Not 55%!