- We replicate the transparency calculations published by ESMA, using SDR data on EUR Swaps.
- EUR swaps are the second largest IRS market, and yet do not benefit from real-time trade level reporting.
- Our data shows that most of the EUR IRS curve is “liquid”, with ADV >€50m.
- SDR data calibrates realistic pre-trade transparency thresholds at €50k DV01 per trade.
- SDR data calibrates realistic post-trade transparency thresholds at €95k DV01.
This blog follows on from my original blog about MIFID II Transitional Transparency.
4 Weeks of Transparency Delays. 4 WEEKS!
This is why ESMA data matters. I missed this detail in my original read of the RTS2 from ESMA. Local authorities in Europe can delay the publication of trades over certain thresholds by FOUR WEEKS:

Market participants tell us that they expect most “competent authorities” will indeed exercise this option to delay publication by four weeks. This four-week delay was quite a shock to me. The longest publication delay we see in US SDR data is 15 MINUTES.
Rewind
But before I get ahead of myself and lose you without the back story, here is what has happened so far:
- Pre- and post-trade transparency will be significantly improved in Europe once MIFID II comes into force on January 3rd 2018.
- ESMA are using a data-led methodology to define which instruments will be subject to the Trading Obligation.
- They are using a similar data-led methodology to define Transparency Requirements.
- Transparency Requirements determine what is a “Liquid Market”.
- Liquid markets will have more pre- and post-trade transparency than markets deemed to be “not liquid”.
- ESMA have deemed the whole of the FX Asset Class as illiquid for the purposes of Transitional Transparency!
- For Liquid Markets, a data driven approach defines Large in Size (LIS) and Size Specific To Instrument (SSTI) thresholds.
- Depending on the size of a trade relative to these thresholds, the disclosure of post-trade volume & trade prices is subject to a delay, or in the case of pre-trade transparency, completely eliminated.
- Post-trade transparency can be delayed by four weeks for trades over these thresholds.
- ESMA, in the RTS2, provide details of the methodology used to calculate these thresholds.
The LIS and SSTI thresholds dictate which trades will be made public (both pre- and post-trade). They are therefore very important. Set too low, and the reform efforts in terms of transparency achieved will be to no effect. Set too high, and end users could be front-run or hedging could be severely impaired.
In terms of transparency, remember we are not talking about a delay of 15 minutes like in the US. And not even 24 or 48 hours in the majority of cases. 4 WEEKS! That is not transparency in the true sense of the word.
We therefore feel that it is important that ESMA use all of the available data when making these determinations. One such obvious source of data is the US SDRs.
EUR Swaps in the US SDR
A significant portion of the EUR swaps market is covered in US SDR data, as shown in SDRView:
Showing;
- All EUR IRS reported to the US SDRs during the ESMA observation period, running from 3rd July 2016 until 2nd January 2017.
- Over €2.5 trillion worth of IRS trades were reported. All trades were reported in close to real-time (max delay of 15 minutes for block trades), and all at a trade-by-trade level.
- Comparing to our CCPView product, which includes all Cleared EUR swaps traded during the same period (but not at a trade-by-trade level of granularity), we estimate that 15% of the global EUR IRS market is covered in US SDR data.
15% of the market seems like a pretty good window for transparency purposes. So let’s go ahead and replicate the ESMA calculations, as detailed in RTS2.
The Calculations
To define what is liquid, we need to satisfy the following:
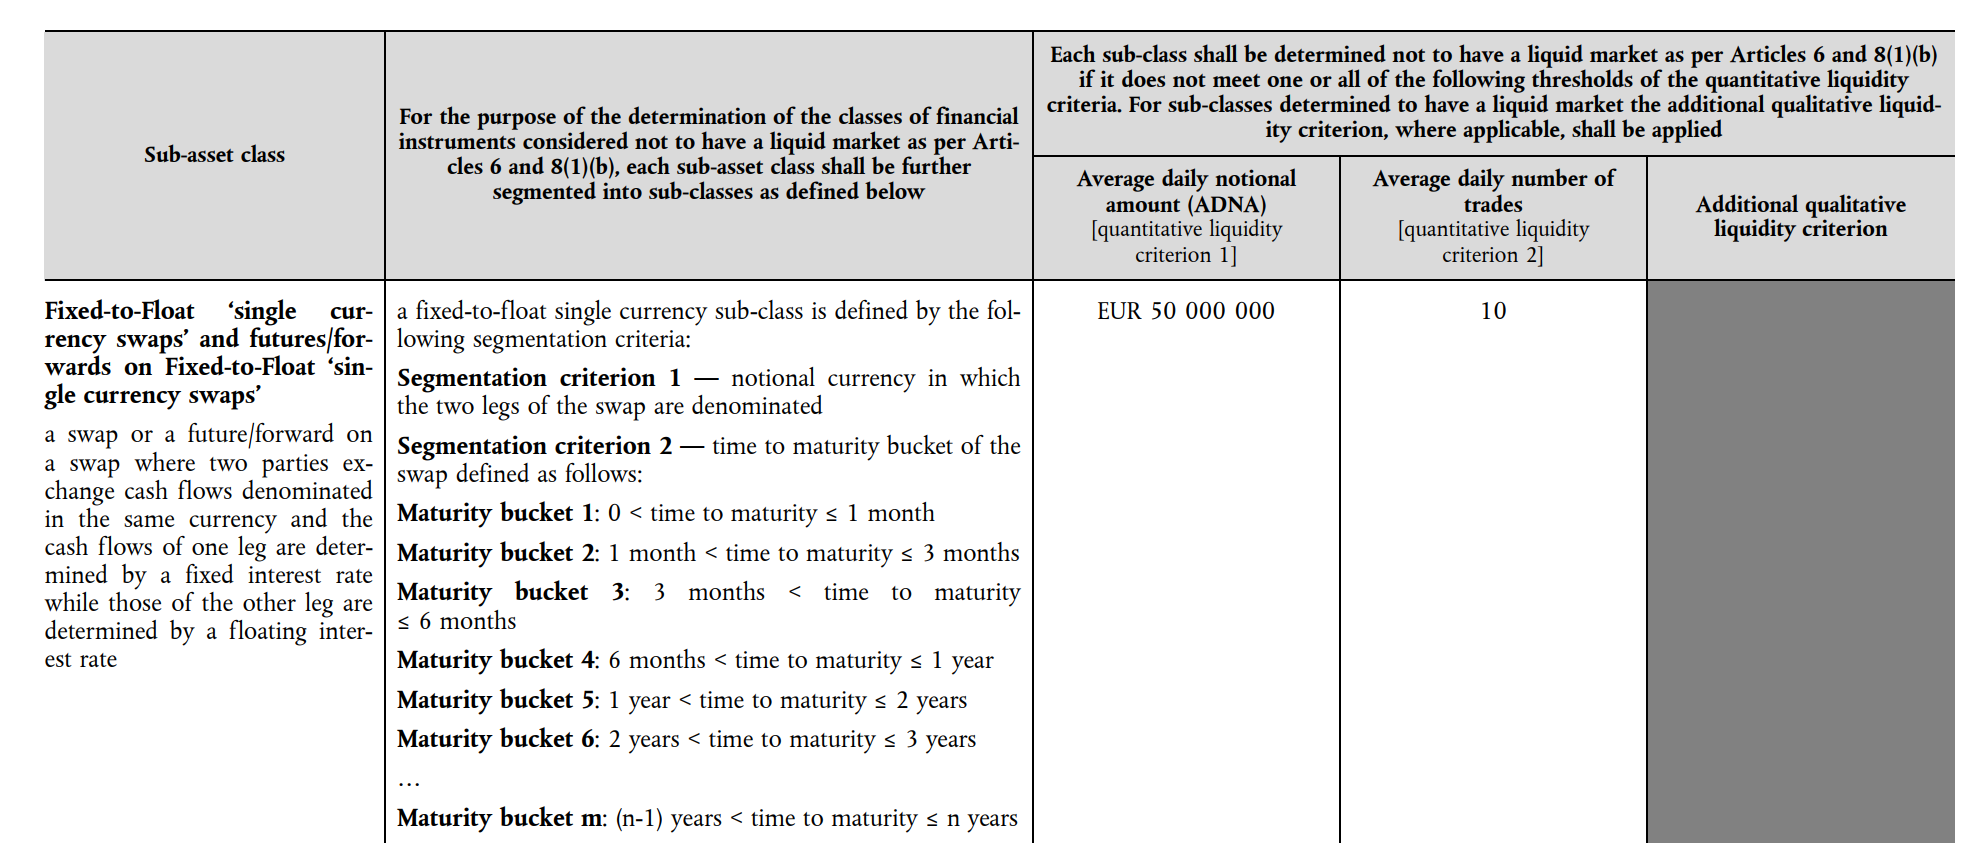
i.e. we need at least 10 trades every single day, amounting to an average daily volume in excess of EUR50m for each maturity bucket.
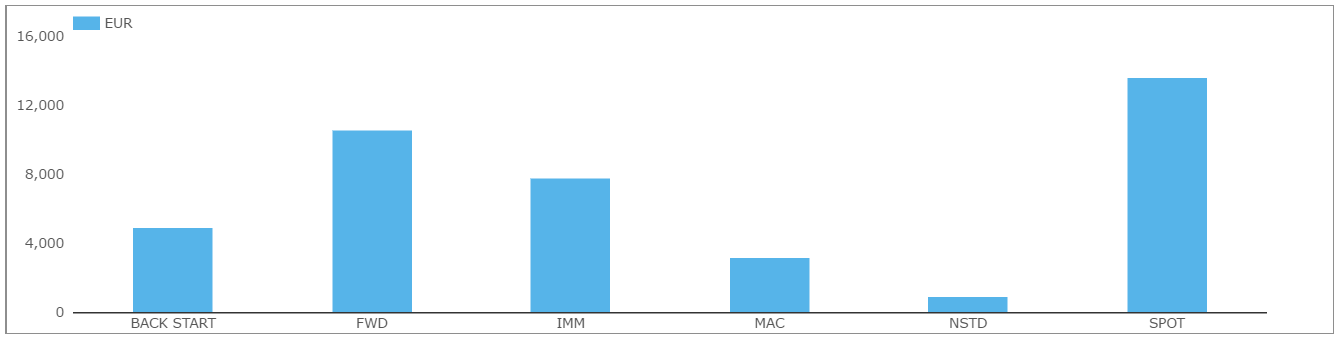
I haven’t been able to find in the document a detailed methodology on what actually constitutes the “maturity date” for an IRS. Is a 5 year swap starting in five years time meant to go in the 5y or 10y bucket? In light of which, I thought I would just take a rudimentary look at the data, and use only spot starting swaps.
Remember that sport starting swaps make up only around 30% of volumes:
Even looking at a portion of the market is interesting when compared to the ESMA calculations…
Calibrating LIS and SSTI
To recap, the ESMA data analysis yielded the following EUR IRS as “Liquid” and their corresponding LIS and SSTI levels:
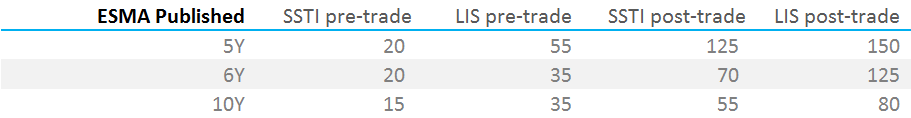
Instruments maturing within a year of the benchmark maturity are deemed as “Liquid” from the ESMA data set.
How does this compare with the SDR data? And more importantly, how do the SSTI and LIS levels compare? Well, even with “only” 15% of the market covered, SDR data has 15 maturities defined as liquid in terms of having >€50m in Average Daily Volume (we can safely assume that they trade over 10 x a day even if the SDR data shows fewer trades).
Our complete grid of data is shown below:
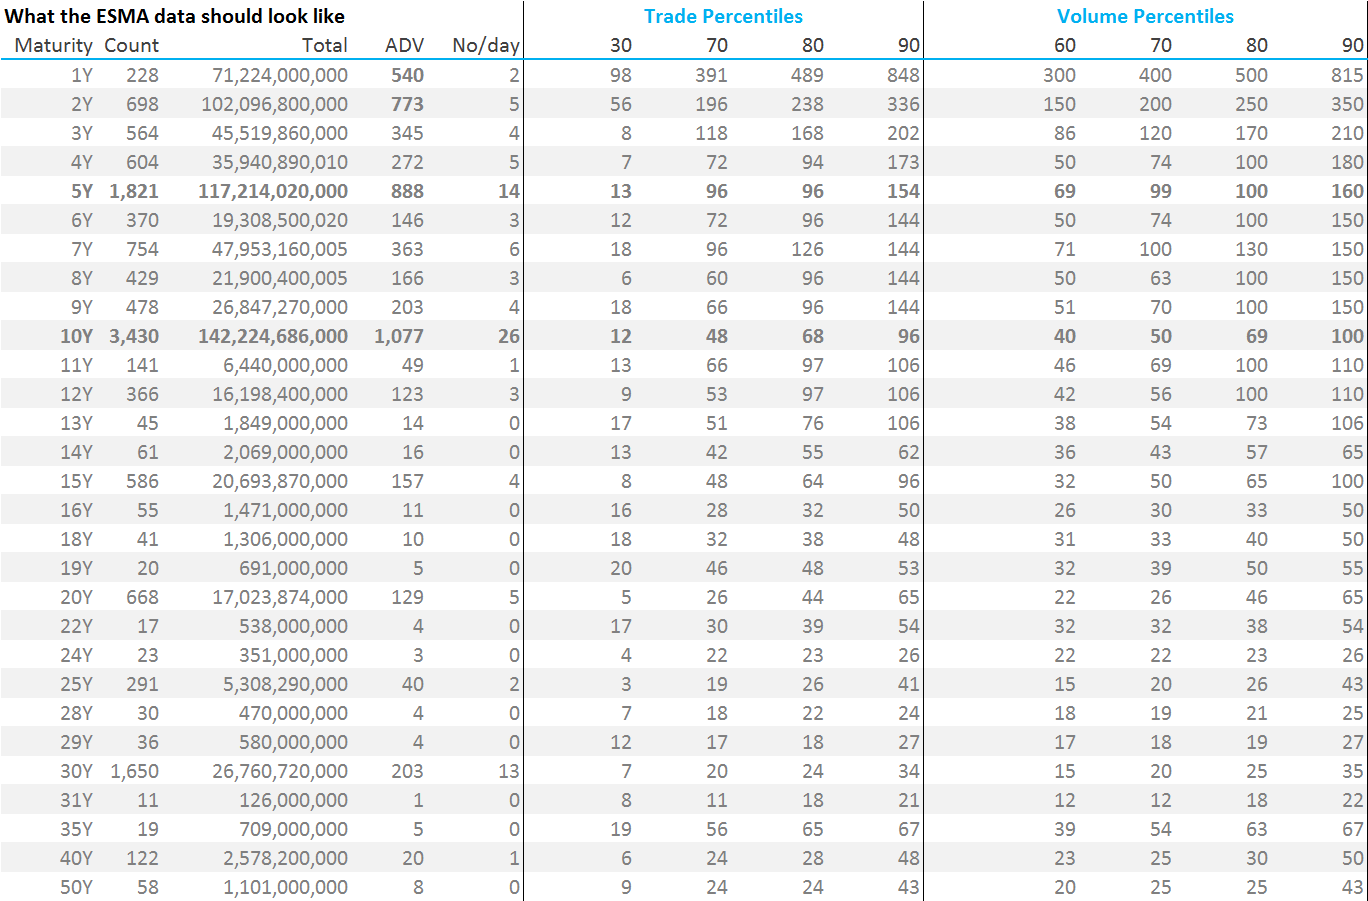
US SDR data therefore shows that for EUR swaps alone:
- Maturities 1Y, 2Y, 3Y, 4Y, 5Y, 6Y, 7Y, 8Y, 9Y, 10Y, 11Y, 12Y, 15Y, 20Y, 30Y can all reasonably be deemed “liquid”.
- Remember, this only takes into account spot starting swaps, which is only about 30% of US SDR volumes, so the numbers are super conservative.
- We have enough granularity in the data to calculate the SSTI and LIS thresholds.
From the public trade-level data in US SDRs, the following determinations of LIS and SSTI levels for liquid instruments can readily be made:
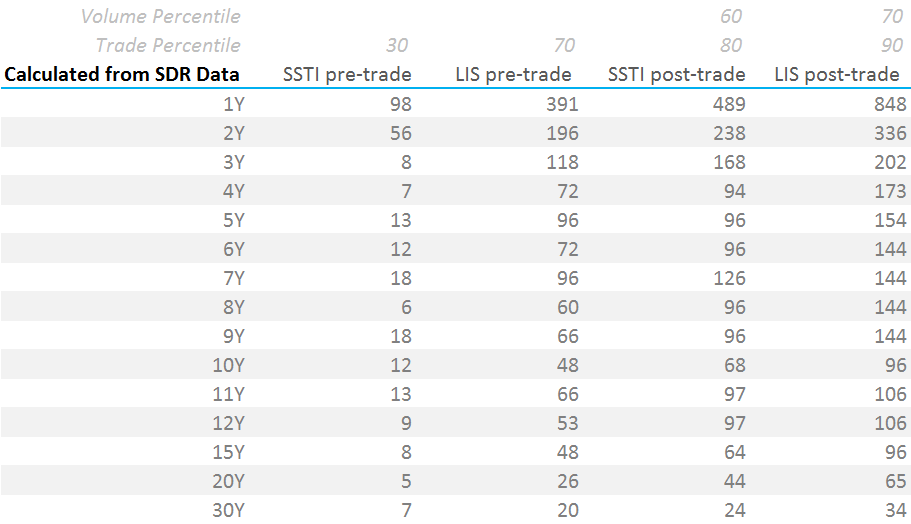
Showing;
- For 10y Swaps, we believe that post-trade transparency thresholds for SSTI and LIS should be at €68m and €96m respectively. This is around 20% larger than the ESMA calculations at €55m and €80m.
- More significantly, the data suggests that the LIS for pre-trade transparency is nearly 40% higher at €48m.
- The SSTI pre-trade thresholds are set at very low levels during a 4 year implementation period (ratcheting up by a ~10 percent percentile each year). I’m at a bit of a loss as to why it is being implemented this way – it seems needlessly complicated for no benefit if you believe that transparency is a good thing.
- Remember that SDR data is capped at the block reporting threshold in the US, meaning that these sizes are probably skewed to the low side.
- Overall, our numbers are still small.
- Our average SSTI for pre-trade is equivalent to just €10,000 DV01 (highest is €17k DV01 in 30y swaps).
- Our average LIS for pre-trade is €50,000 DV01.
- Our average post-trade threshold is €65,000 SSTI and €95,000 LIS.
- Happy to talk over the methodology used to calculate these thresholds with any interested readers. It is a bit arcane to detail in a blog.
The Good News
Over time, as the ESMA data gets better, the official LIS and SSTI thresholds will converge with those calculated here.
The methodology to calculate these thresholds is available, transparent and can be replicated if you have the data.
This means that market participants can follow the public data and imply what the SSTI and LIS thresholds should be per instrument.
This is a good thing. It is such a shame that the transitional levels, which will be in place until April 2019, are so wide of the mark. Particularly when there is perfectly good data available!
In Summary
- ESMA thresholds for Transitional Transparency look very low.
- When calibrated against US SDR data, we find much higher levels.
- From our calculations, pre-trade transparency should be available for trades up to €50,000 in DV01 (equivalent to ~100m 5 years/ 50m 10 years).
- Post-trade transparency should be immediately available for trades up to €95,000 in DV01 (equivalent to ~200m 5 years/ 100m 10 years).
- Our recalibrated European post-trade transparency thresholds are far more consistent with the CFTC rules in the US.