- ESMA published their latest Consultation on Trading Obligation for Derivatives under MIFIR on 19th June 2017.
- EUR, USD and GBP swaps are deemed liquid and will be covered by the Trading Obligation under the current proposal.
- JPY, NOK, SEK and PLN swaps will continue to be covered by the Clearing Obligation but will not be subject to the Trading Obligation.
- The Trading Obligation will come into effect as of January 2018.
The Trading Obligation
ESMA have followed their September 2016 Discussion Paper on the Trading Obligation with a Consultation Paper this month. For some background about the Trading Obligation, and how ESMA will define it, I encourage you to read Amir’s blog that covered the previous discussion paper.
Today, we will concentrate on the current proposal. Please remember that this latest ESMA paper is just that – a proposal. Interested parties are invited to respond to this Consultation Paper. We encourage all market professionals to do so as it is in all of our best interests to shape the future direction of our market infrastructure.
ESMA are trying to follow a data-driven path, leading to a deterministic list of product types that are “liquid” and hence subject to the Trading Obligation. Given accurate and comprehensive input data, this is a highly worthwhile undertaking. Assuming the data is good….
This latest Consultation Paper runs to 81 pages, but there are only 40 pages of new content. Page 81 shows the proposed Trading Obligation:
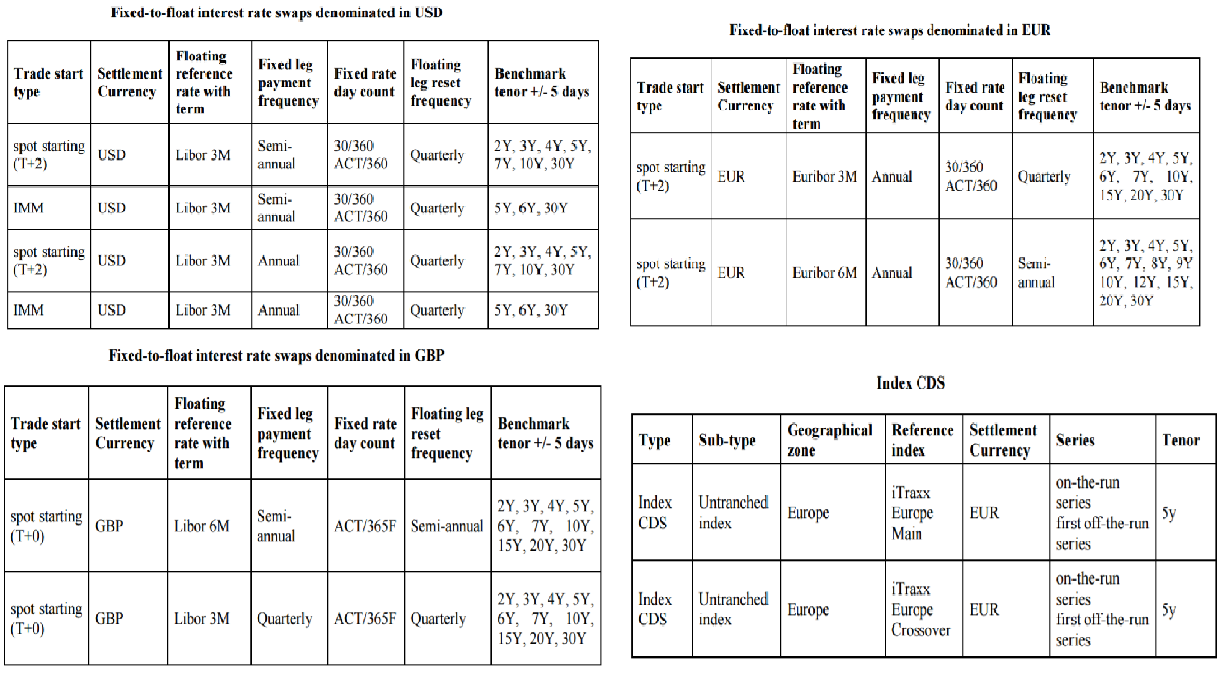
Showing;
- TO applicable to EUR, USD and GBP IRS, plus CDS Index trades denominated in EUR.
- Note that the maturities falling under the TO vary from currency to currency.
- IMM swaps are only deemed liquid in USD (not in the other two currencies).
- Note that these maturities are far from a simple copy of the MAT rules in the US.
What is liquid?
The tests to determine whether a derivative is liquid were defined in the original Discussion Paper. The tests were:
- Average trade frequency of ~10 trades per day (1300 trades during the period).
- Average notional amount per day of ~EUR50m (for IRS).
- Traded on ~80% of trading days (70% for CDS).
- At least 3 tenors must be deemed liquid for a given IRD class (this is a new requirement).
However, as part of this latest Consultation Paper ESMA state;
56. In light of the concerns brought forward by stakeholders on the robustness of TR data, ESMA did not set fixed thresholds for the liquidity criteria to determine whether a derivative should be subject to the TO, but – similar to the approach in the US – relied rather on a holistic liquidity assessment. This approach thereby takes into account the various liquidity criteria.
This is also consistent with their statement regarding the data used in the assessment;
126. Furthermore, since only a small part of TR data could be included for this analysis due to missing fields (e.g. reference rate is usually provided without its term), ESMA believes that the liquidity analysis in this CP is likely to understate the overall liquidity in IRS
The TR (Trade Repository) data was this time supplemented with data from MTFs, and as part of this “holistic liquidity assessment”, ESMA have inferred market behaviour from other sources too:
127. Moreover, when adding parameters and tenors ESMA also had regard to the fact that even though trades are not always executed in high numbers, evidence of liquidity is demonstrated by the availability of pre-trade prices made public on a continuous basis by a number of trading venues across the currencies (EUR, USD, GBP) and tenors considered in this consultation. In addition, ESMA notes that over the course of the last quarter of this year ICE Benchmark Administration published benchmarks for different tenors and currencies multiple times a day derived from electronic order book systems. In the view of ESMA the various liquidity checks those benchmarks are subject to further demonstrates the eligibility of those swaps for the TO.
This more pragmatic approach (when compared to the original Discussion Paper) makes a lot of sense, and encourages us to think that further improvements can (and will be) made as we progress to the final ruling.
I think it is also important to note that ESMA reference the excellent BoE work on transparency in IRS trading, citing the paper as evidence that:
support[s] the view that properly calibrated trading mandates improve liquidity and lower execution costs for end-users.
Needless to say, we couldn’t agree more.
The Data
We spend a lot of time looking at the US SDR data. This provides a great frame of reference for this particular Consultation Paper as it puts the ESMA data into perspective. We know that ESMA must perform a high degree of cleansing on their data sets – both to match TR data with MTF data, but also because TR data is particularly bad. Our long-held opinion is that European TR data should follow the lead of the US regime and make transaction-level reports publicly available. The publication of the data elicits independent verification of the trade details, leading to a virtuous feedback loop of quality control. This has worked in the US. It will also work in Europe.
We expect that the ESMA data set covers a larger portion of the EUR IRS market than the US SDR data. This would be consistent with both the BIS OTC survey data and recent changes in market structure that saw US market participants move legal entities post Dodd Frank.
EUR IRS Data
The ESMA data set is composed of cleansed TR data plus supplementary trading data from MTFs. This is summarised below;
- This data covers the time period 1st July to 31st December 2016.
- ESMA look at only benchmark tenors, plus/minus 5 days.
- ESMA look at only trades deemed to be “spot starting”.
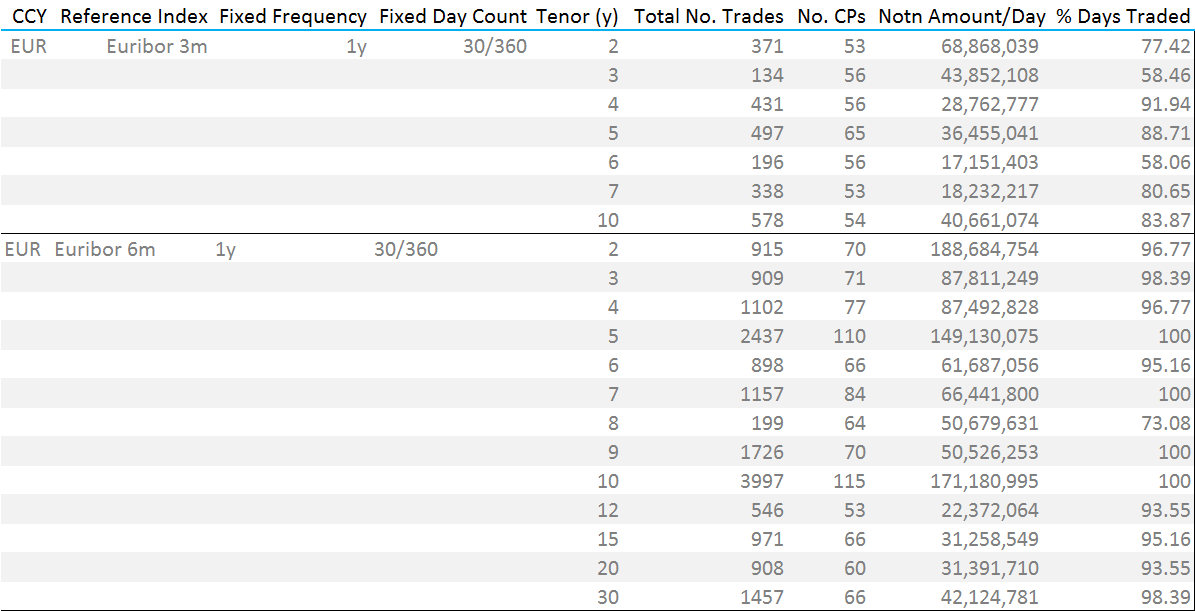
- The data set covers only EUR trades versus Euribor 6m and Euribor 3m.
- Only trades with a Fixed leg that conforms to a 30/360 day count basis, paid annually (1y) are included.
- They see nearly 4,000 10 year trades (across the whole of the six month observation period). These are versus Euribor 6m, a “daily notional amount” of €171m was traded, and this 10 year tenor traded every single day. 115 different counterparties were active in this 10y swap.
- Activity drops off pretty abruptly outside of the 10 year swap. Only 2,437 5 year swaps were observed, but a relatively large 1,726 9 year swaps were recorded (I am assuming these are tied to the Eurex bund contract?). Most tenors would have failed the previous test of having at least 1300 trades.
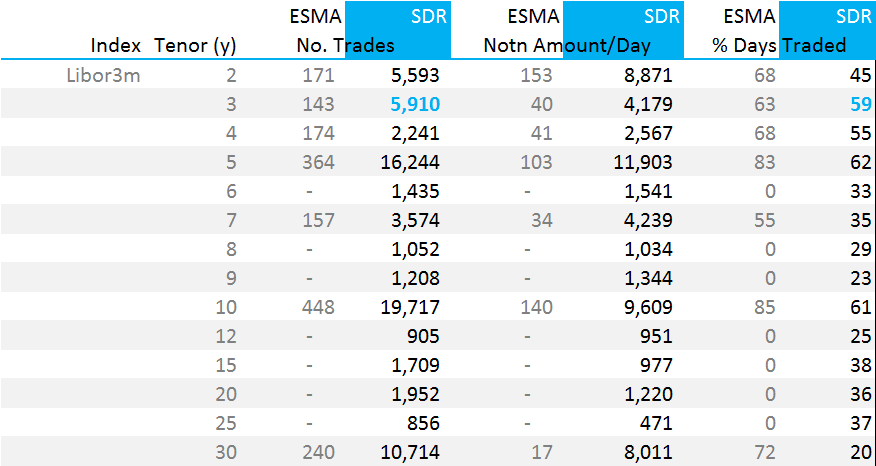
This data compares favourably to the same time period in the US SDR. Remember that this SDR data covers only EUR IRS traded by US Persons:

Showing;
- Comparisons between the number of trades, notional traded per day and the percentage of days traded between the ESMA data set and the SDRView data (from the US SDRs).
- Happily, the ESMA data-set is certainly larger. Only considering these liquid swaps, the ESMA data set is nearly 20,000 trades, where-as the US SDR is 8,500.
- It is not clear how ESMA calculate the column “Daily Notional Amount” in their tables. In the original Discussion Paper, they included the following methodology:
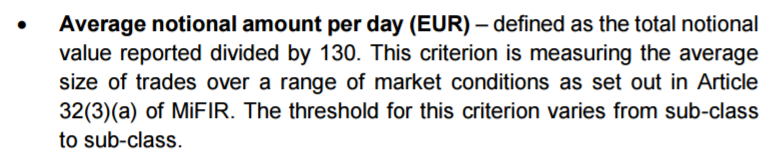
- I have tried to reconcile against total notional divided by 130 (as well as average trade size, average amount traded per day (which is shown in the table)). I do not see how this column has been calculated. If anyone knows, please reach out to us. It is a pretty pivotal part of the data.
- In the US SDR data, there are 9,379 spot starting EUR IRS in total. Out of these, the proposed ESMA Trading Obligation would cover 8,611 of them (92%).
What I don’t tell you with the data above is which EUR swaps we are ignoring. In the six month observation period, the US SDR includes:
- 35,441 “new” trades.
- Of these, only 29% are spot starting.
- SDRView shows the split by trade sub-type:
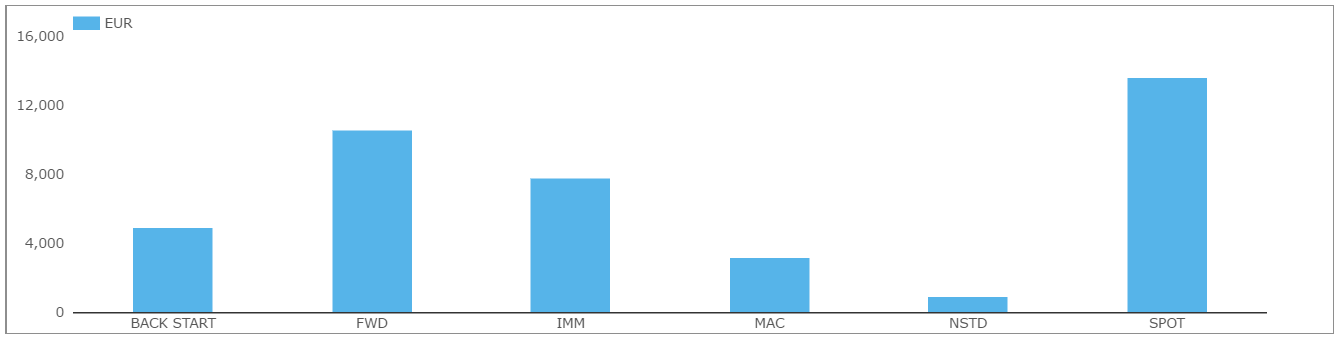
Showing that Forward starting swaps are a very significant portion of the market. Likewise, IMM starting swaps.
USD IRS Data
We can see that ESMA have done a pretty good job with the EUR IRS data that they have access to. This undoubtedly represents a step forward from the situation we were in back in September 2016 when the Discussion Paper was published.
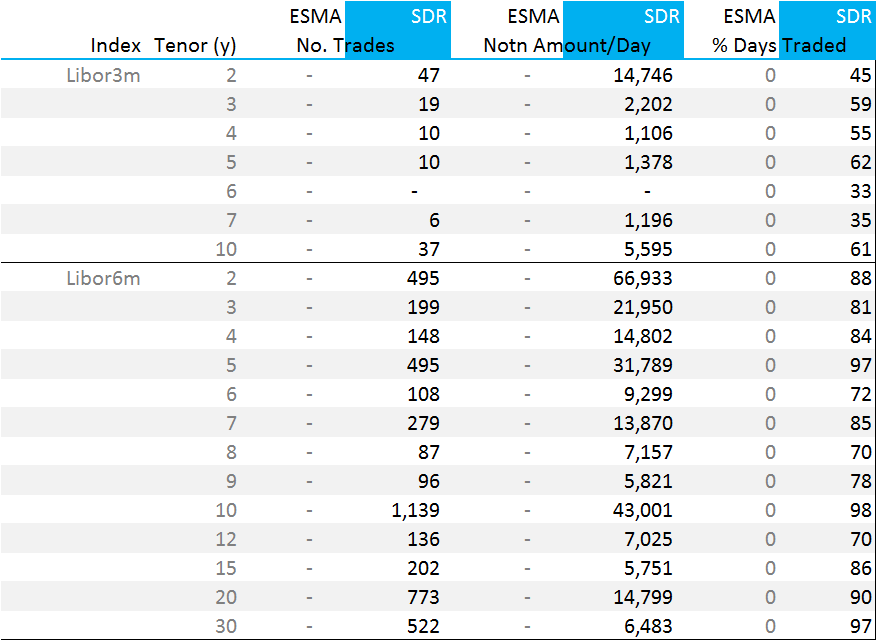
However, as soon as we step outside of EUR swaps, we step into trouble with the data. We would expect the ESMA data set to represent a smaller portion of the USD IRS market, than the US SDRs. But when we look at the data, we are shocked at what a small portion of the market is actually covered in European TRs:
Showing;
- Over 73,000 spot starting USD swaps versus 3m USD Libor were reported to US SDRs in the six month observation period.
- The ESMA data set includes only 1,697!
- This is surely an unrepresentative portion of the market on which to base a Trading Obligation.
JPY IRS Data
A similar exercise in JPY IRS shows that there were a large number of JPY swaps reported to US SDRs:
Showing;
- Nearly 5,000 spot starting JPY IRS swaps were reported to US SDRs in the six month period across the main tenors.
- JPY IRS versus Libor 6m in the 2y, 3y, 4y, 5y, 7y, 10y, 15y, 20y and 30y tenors all traded on over 80% of days.
- We could reasonably label 2y, 5y, 7y, 10y, 20y and 30y JPY IRS as liquid using similar metrics to EUR and USD IRS earlier.
Other CCY IRS Data
We would of course be happy to replicate this analysis for SEK, NOK, PLN and GBP swaps for any of our clients who may be interested. Don’t hesitate to reach out to us if you are considering a response to the Consultation Paper and need some data.
Access to Liquidity
We spend a lot of time looking at the US SDR data. This provides a great frame of reference for this particular Consultation Paper as it puts the ESMA data into perspective.
ESMA have done a good job with the EUR data available to them. Their sample size is still somewhat smaller than we would expect. Given EUR and USD swap markets are similar sizes, we would expect the true picture of EUR IRS markets to cover around 70,000 spot starting swaps over a six month period.
However, outside of EUR swaps, we are very concerned about the data being used to derive the Trading Obligation.
We therefore believe that the ESMA data should be combined with the US SDR data. This would give the most complete picture of liquidity available to a market participant, irrespective of where they are based.
Liquidity in global OTC derivative markets is not geographically constrained. If you are located in Frankfurt, you can just as easily access prices provided from a dealer located in London, New York, Singapore or Japan.
Analysis for a Trading Obligation should therefore be conducted on a similarly global data set. It should not be constrained by where the trades are reported.
We are confident that if such a comprehensive review of the data were to be performed we would see an added benefit to market participants. Namely, a convergence of Trading Obligations around the globe, such that rules in Europe will be aligned with the current trading obligation in the US.
The two largest capital markets can then be considered the “gold standard” to which all other jurisdictions can aspire. One day, we hope that will also include trade-level public dissemination of trades.