- We update our NDF Clearing Analysis.
- A minimum of 17% of the market is now cleared.
- Clearing volume can account for up to 30% of volumes in some currency pairs.
- Uncleared Margin Rules continue to motivate clearing.
All Time Record Volumes
Cleared NDF volumes continue to grow at an impressive rate. Since we last looked at the overall market in November, CCPView shows that we’ve had two record months:
Showing;
- 2018 has seen average monthly volumes in excess of $700bn each month.
- These volumes are 80% higher than the first two months of 2017!
- Open Interest was $0.99trn as at end of February 2018. That is some 30% higher than when we last looked…
- …and so should attract some compression activity. Open Interest has dropped by $70bn in the first week of March, so maybe this is now gaining some traction?
- In terms of market share, LCH ForexClear dominates (97% of volumes were cleared at LCH in February 2018).
With Success Comes Great Responsibility
Increasing cleared volumes do tend to lead to one thing though – increased Initial Margin. Let’s look at the latest LCH ForexClear disclosures:
Showing;
- LCH ForexClear IM requirements as at September 2017 (so a little bit out of date). We will get fresh data for December 2017 in two weeks time.
- The story looks positive for the service. Even as cleared volumes have increased dramatically, Initial Margin has stayed under control, even reducing from the peak in March 2017. I’m sure we wouldn’t have seen the same evolution of IM back in the early days of SwapClear as notional amounts ballooned. Good to see the industry learning from previous experience.
- According to the IOSCO disclosures, ForexClear now has:
- 29 participants (27 banks plus 2 “other”).
- $41m in Client Initial Margin. So Client Clearing is now a thing.
Pending any shocking revelations in the latest disclosures in two weeks, from the information available it looks like ForexClear remains predominantly a dealer-to-dealer service.
NDF Volume Data
We have written at length about NDF clearing in our FX series of blogs. This is because NDF markets were particularly impacted from the introduction of Uncleared Margin Rules.
Prior to the uptake of clearing, our SDRView data products were the only way to gain transparency into these markets. With the uptake of clearing, we can now also use CCPView as an important data resource.
As a brief bit of history, we have previously combined BIS data and SDRView to show that the portion of the NDF market covered by US persons was around 38%. This is derived from:
- SDR data yielded an Average Daily Volume of $49.9bn during April 2016.
- For the same month, BIS data reported an NDF ADV versus USD of $130.2bn.
BIS data further showed that the proportion of a market covered by SDR data varied from currency pair to currency pair. For example, USDBRL SDR volumes represent nearly 70% of the global market.
Generally speaking, we used to be happy to assume that our SDRView data reflected 38% of the market.
This now appears to be changing….
Minimum Clearing Levels
I wanted to estimate the clearing uptake per currency pair. The BIS survey in April 2016 was split into 5 major currency pairs, so we could compare SDR volumes versus BIS global volumes for these five currencies. (You can see the comparison to BIS data in an earlier blog here).
This allows us to do some nice analysis of how the uptake of clearing has progressed per currency. Please note these are minimum levels of clearing:
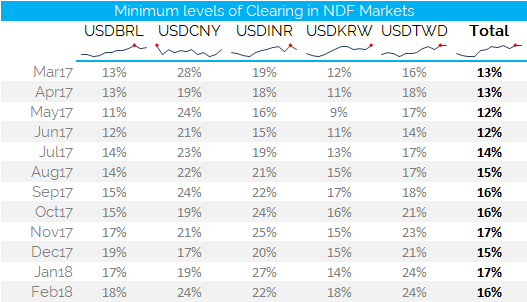
Showing;
- Clearing has grown across each individual market.
- Clearing can account for nearly 30% of volumes in any given currency pair.
- The minimum Clearing uptake has increased from 12% to 17% within a year.
- Four of the currency pairs see more clearing in 2018 than at any previous point in time (the red dots on the sparklines are the peak values).
- Only USDCNY bucks that trend, with highly variable cleared volumes compared to the market overall.
These are minimum estimates. Read on to find out why.
Maximum Clearing Levels
I found a small problem with the above analysis when I looked at the resulting Average Daily Volume for the whole market that it implied.
- In April 2016, the BIS thought that the ADV for NDFs was $130bn.
- In February 2018, my calibration above implies an ADV of $242bn!
Has the market really doubled in less than two years?! Very unlikely. My inflated number is because I assume none of the SDR volumes are cleared. This is inaccurate.
What proportion of the SDR is cleared? It is very tricky to say. Because NDF clearing is a post-trade process (see blog here), the trades are not executed or reported as “Cleared”.
In light of which, I can only assume that we see some cleared volumes reported to SDRs. How much? The safest assumption to make is that 100% of cleared trades are reported to SDRs. We assume this isn’t true, but it gives us the other side of the coin to compare to our Minimum Clearing Levels above – i.e. the Maximum Clearing Level.
Applying this logic, we have the following estimates for market size and clearing uptake:
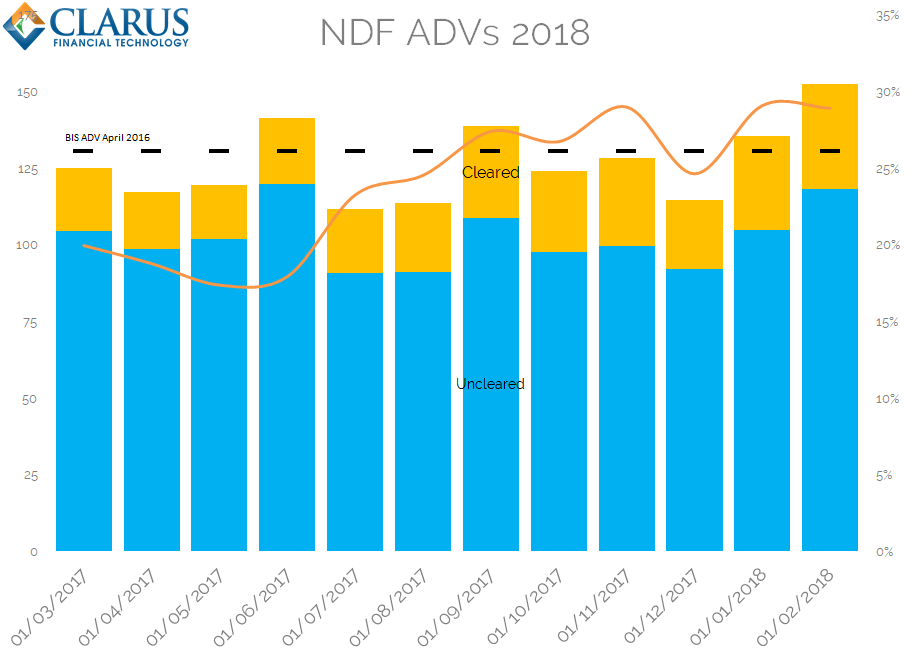
- Average Daily Volumes each month for the past year across all NDFs, split Cleared vs Uncleared.
- The BIS April 2016 level ($130bn ADV) is shown as a dotted line for comparison.
- The overall market size looks fairly reasonable using this assumption – around $150bn ADV last month.
- What is interesting is that it really increases the percentage of the market that is cleared (orange line).
- In March 2017, 20% of the global market was cleared.
- In February 2018, 30% of the global market is now cleared! That is quite some growth.
In Summary
- LCH ForexClear has a 97% market share in NDF clearing.
- Cleared volumes have grown by 60%+ year-on-year.
- Up to 30% of volumes are now cleared.
- Our CCPView and SDRView data products provide vital transparency into these markets.