or Are UMRs an economic mandate for clearing?
- Since the introduction of Uncleared Margin Rules six months ago, there has been an increase in Clearing across many markets.
- We have seen the proportion of trades being cleared across NDFs, OIS, Latam and Inflation Swaps increase significantly.
- This increase in clearing has been accompanied by an increase in trading activity.
- Multi-lateral netting is a huge motivating factor for dealers to clear the bulk of their portfolios.
Interest Rate Swap Clearing by Currency
G4 Interest Rate Swaps
Using SDRView Res we can quickly look at the percentage of notional that is cleared every month. Something that wasn’t immediately obvious back in September last year is that even vanilla IRS in the G4 major currencies have seen an up-tick in clearing since the introduction of Uncleared Margin Rules:
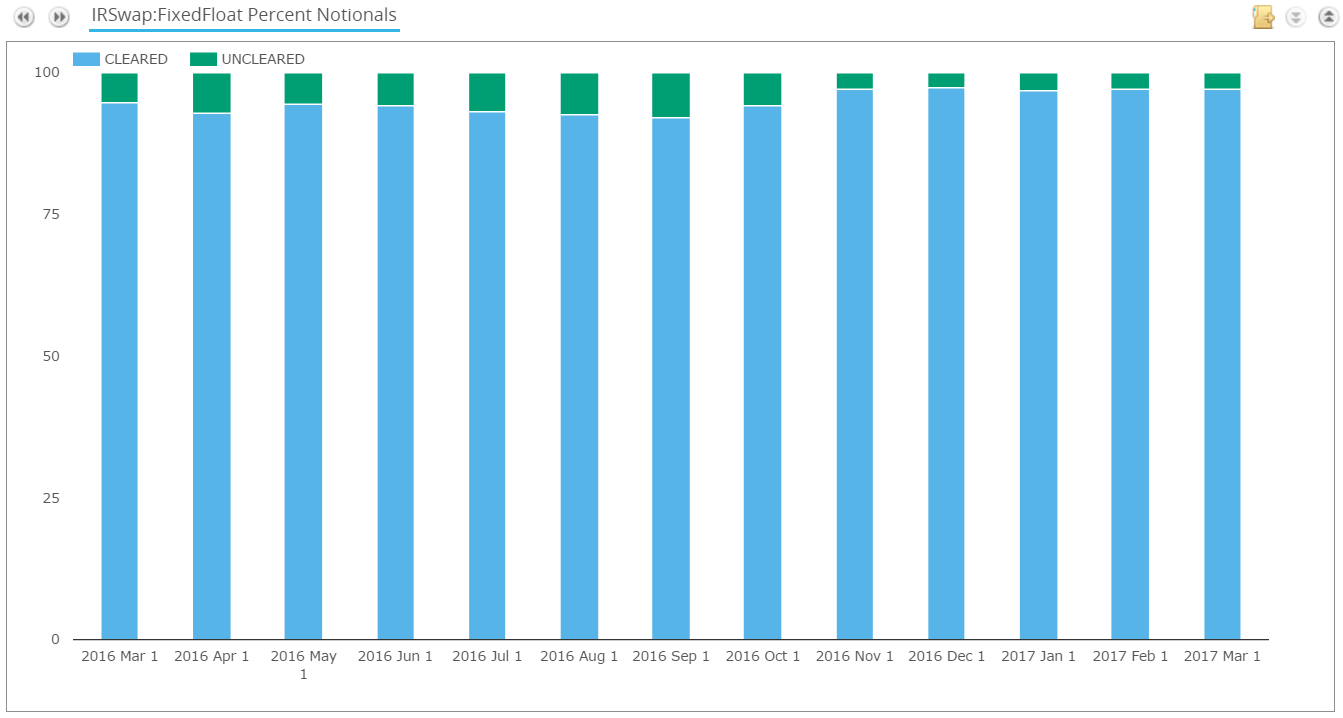
- In March 2016, 5.4% of trades were uncleared.
- In March 2017, just 2.8% are uncleared.
- Average volume traded each month has increased during this time period. In the six months to September 2016, the monthly average was 45,000 trades. The past six months have seen a monthly average of 47,000 trades.
- This trend towards clearing does not therefore appear to be hampering trading.
- Rather, a larger proportion of IRS trades are now being cleared than ever before.
MXN and BRL IRS
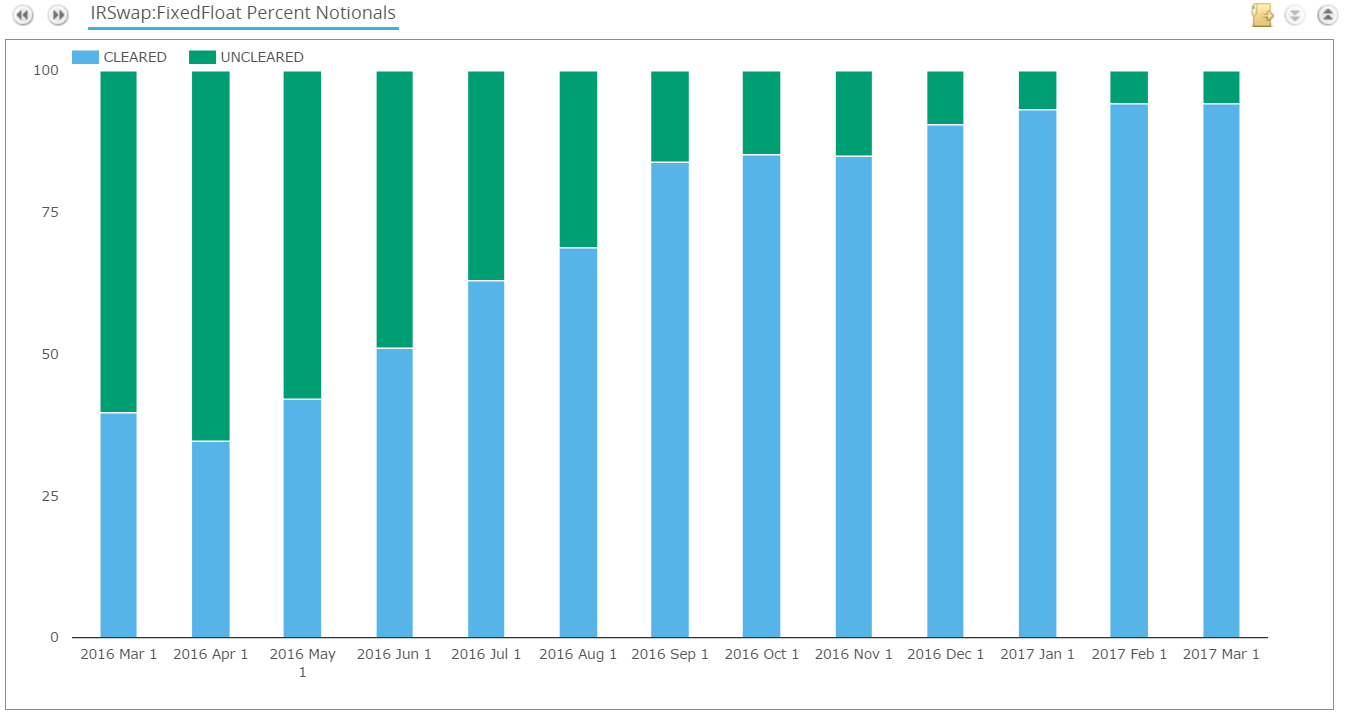
- If we wanted a “poster child” for the effects of Uncleared Margin Rules on IRS markets, we would point our finger directly at the MXN and BRL IRS markets.
- In March 2016, 60% of volumes were uncleared.
- In March 2017, 6% of volumes were uncleared!
- It is interesting to note that in February 2017, only 1% of MXN IRS reported to the SDRs were uncleared. This must be in response to the extended Clearing Mandate for US Persons that came into effect at the end of last year, as well as the UMRs.
- Whilst for BRL, clearing has increased from 0% (!) in March 2016 to 85% in March 2017 and still seems to be growing.
- These volumes will have been impacted by CCPs introducing BRL and MXN swaps in readiness (or just after) the UMRs.
This growth in clearing has positively impacted volumes. Average monthly volume was $205bn equivalent in the six months before UMRs. Since then, it has been running at $225bn and is set to be higher still in March 2017.
Cross-referencing this trend with CCPView shows that much of this clearing growth has been at CME:
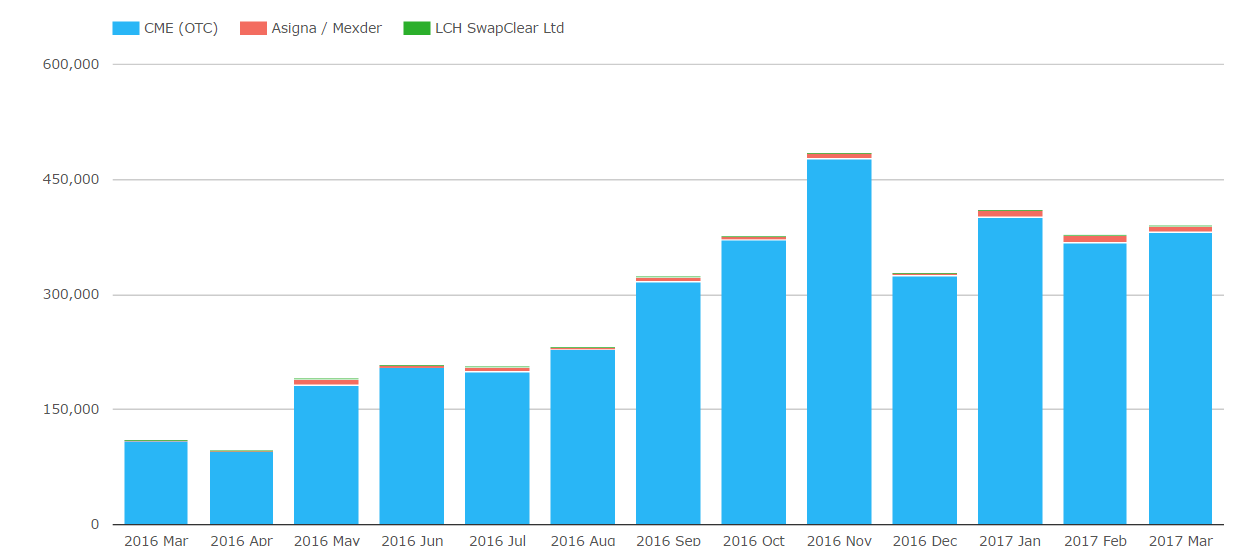
Please check out Tod’s excellent overview of Latam swaps for more.
Other Currencies
I’ve taken a look at a few of the other corners of the IRS market too:
- CE3 (PLN, HUF and CZK) have seen an increase in clearing activity. Uncleared volumes are down from 22% to 14%. Incredibly, overall volumes have nearly doubled since last year!
- CAD, AUD and NZD have seen no change in the amounts being cleared. Uncleared volumes have been consistently ~10% of volumes.
- CHF plus the Scandi currencies have likewise seen little change in the SDRs. Anything between 1 and 5% of volumes have stayed uncleared since introduction of UMRs.
- Asian currencies seem to have been little impacted. To be fair, I lose track over which Asian currencies are clearable at CCPs, which I imagine will be the next wave of expanded currency offerings.
- We cover 42 currencies in total across the SDRs. I will leave it to our users to drill down into anything else I may have missed.
Basis Clearing
Floating-Floating swaps in the same currency (“basis” swaps) have seen a growth in clearing. This is driven by the USD market. USD Basis Swaps, as reported to the SDRs, are nearly 10 times larger than markets in other currencies! Basis Swaps in USD have seen uncleared markets shrink from 7-8% of volumes last year to ~3% this year.
Inflation Clearing
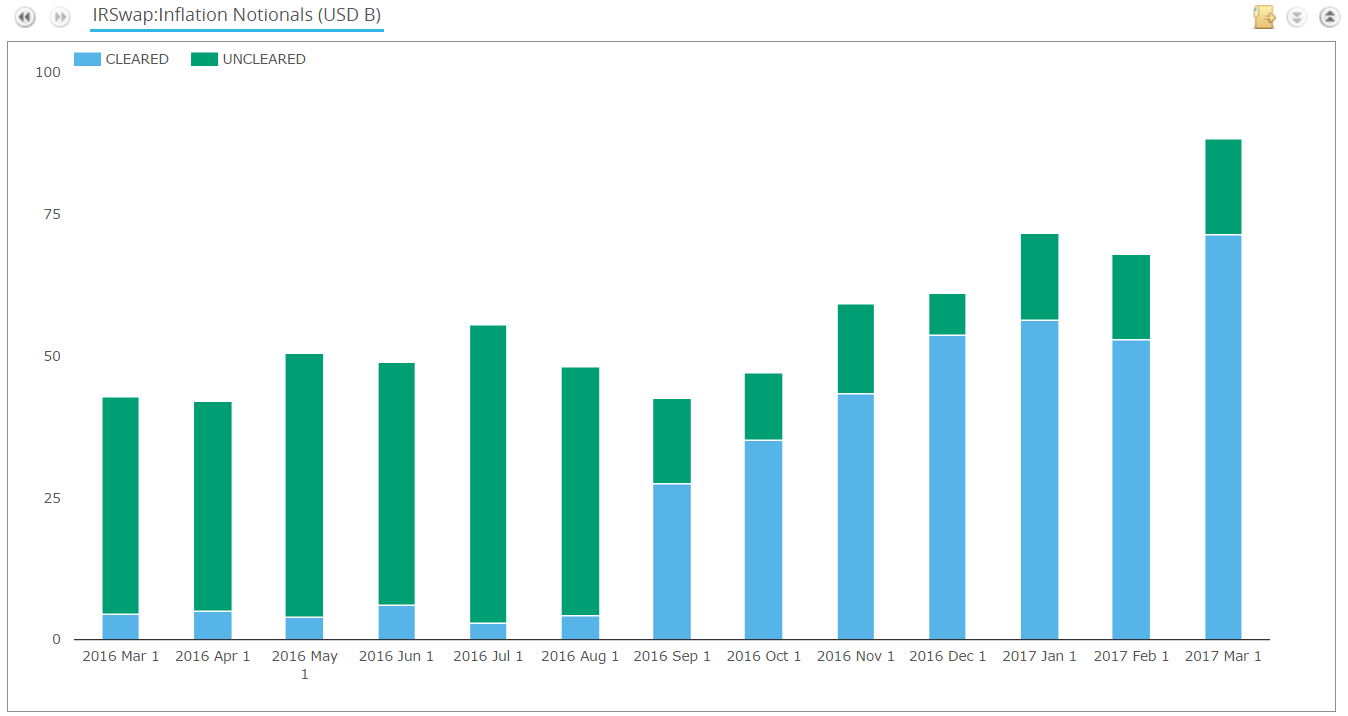
We have looked at Inflation Swaps in relation to the UMRs previously. Whilst they are somewhat of a niche area of the market, they still command monthly volumes over $150bn. Again, in an environment of increasing volumes, we have seen clearing rates increase from 10% to 80%. The chart below looks at EUR, GBP and USD:
OIS Clearing
OIS swaps have seen a remarkable increase in overall volumes trading – likely as a result of a shift in monetary policy from the Fed. Going hand-in-hand with these increased volumes has been a shift towards clearing. In USD OIS, virtually 100% of volumes are now cleared, up from 75% before the UMRs:

The trend towards increased clearing take-up is repeated for OIS swaps in all other currencies (ex-USD) as well. However, we are yet to see an increase in volumes for OIS swaps outside of USD, despite an expanded Clearing Mandate:

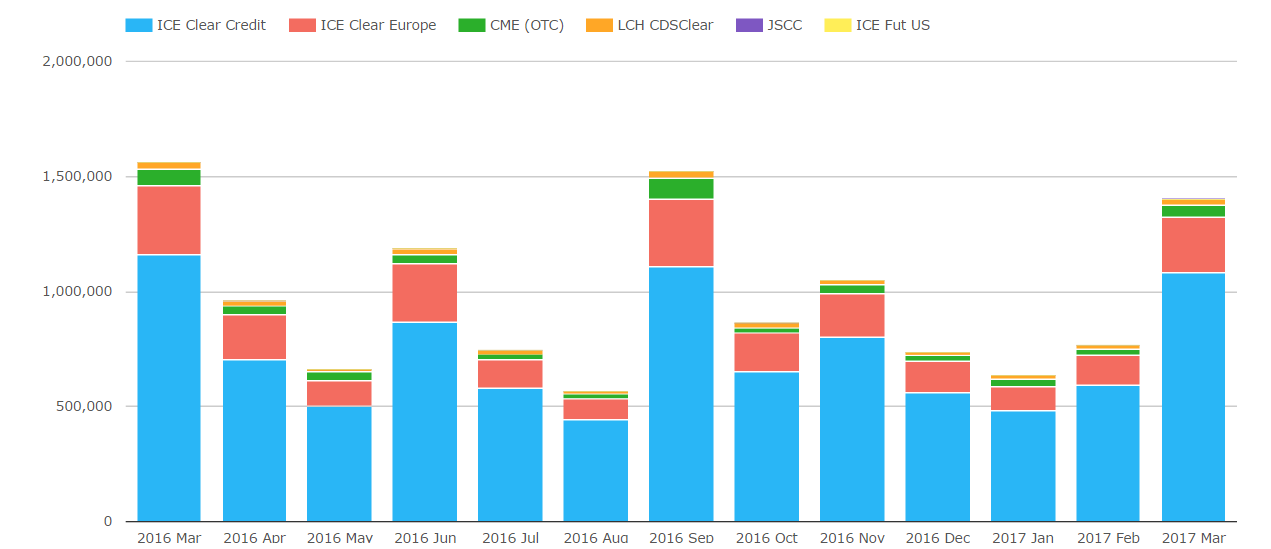
Credit Derivatives Clearing
Looking at volumes in both USD and EUR Index products, little seems to have changed in the past 12 months. In any given month, between 15 and 20% of volumes remain uncleared. This is backed-up by global cleared volumes in CCPView, that generally show little change over the past year:
NDF Clearing
I have written at length about NDF Clearing over the past six months. Our articles are grouped together here. Summarising the growth that we have seen in clearing:
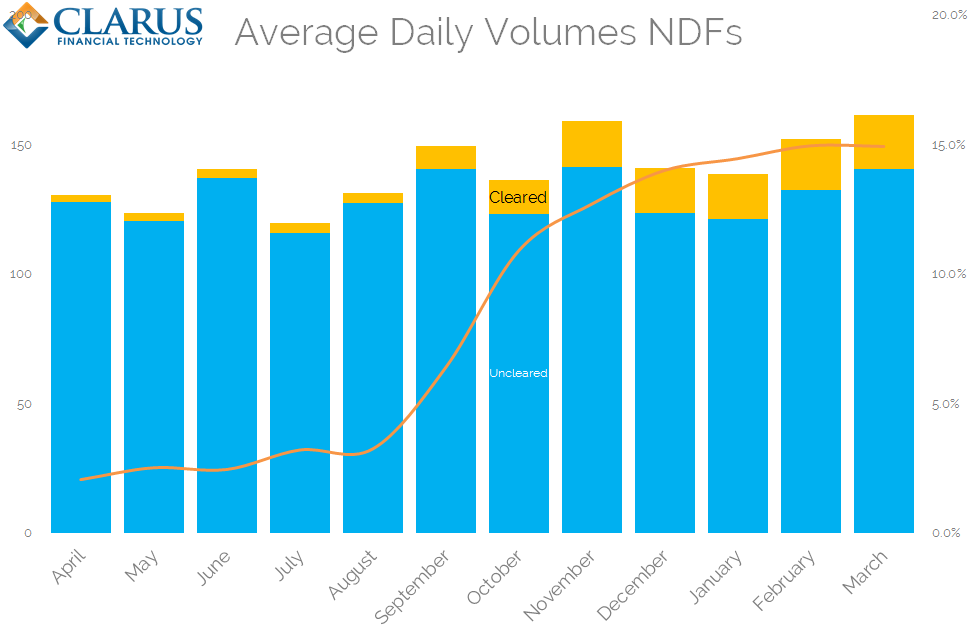
Showing;
- Average Daily Volumes of Cleared and Uncleared NDFs.
- Cleared NDFs include volumes from Comder, SGX and LCH.
- Uncleared volumes are derived from SDRView data, scaled up on the assumption that reporting US Persons are ~38% of the global market.
- The current Clearing Rate in the market is 15%, up from 2% last year.
Initial Margin Disclosures
Of course, this increase in clearing must be felt somewhere. We will shortly have another set of CPMI-IOSCO disclosures to analyse the true impact. Nonetheless, we can turn to CCPView to see what the increase in Initial Margin has been like at the CCPs up to the end of September.
The most telling impact has been seen at LCH SwapClear, where Gross Client IM has doubled in recent times:
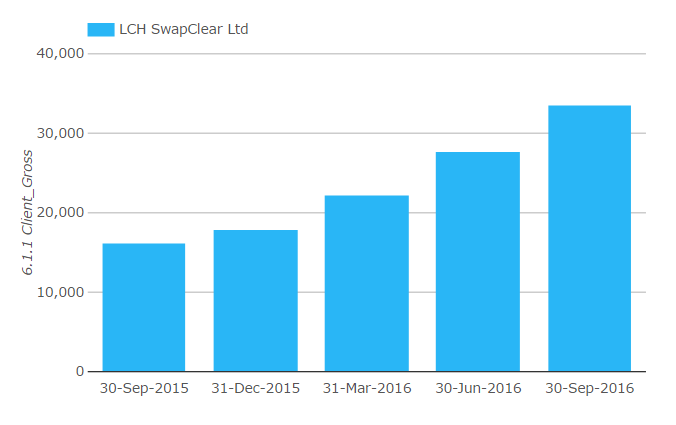
Showing;
- Gross Client Initial Margin at LCH SwapClear has increased from £16bn to £33bn.
- We expect this trend to continue.
- As more volumes across more products become cleared, it is likely that more directional positions will also enter CCPs.
- This should cause an increase in the amount of margins that CCPs hold.
Clearing Houses – Providing Economic Incentives to Clear Since….
We have covered a lot of data in this blog. My conclusions so far include:
- Markets did not grind to a halt as a result of the introduction of margin on uncleared derivatives.
- We have seen examples of previously uncleared markets transitioning to clearing (e.g. Latam IRS, Inflation, NDFs).
- We have also seen examples of clearing increasing its’ reach in markets that were already near saturation (G4 IRS, OIS).
- In each case, overall volumes have increased in the past year.
- We have reported in the past that uncleared volumes (in isolation) have seen little change.
I wrote a blog last year, “What is Multilateral Netting?“, that explains why Clearing Houses are so efficient in a post-UMR world. Offering dealers multi-lateral netting of all of their exposures is an extremely strong economic motivation to clear. In many ways, it does not matter for this community what the standalone comparisons of IM in Clearing versus Bilateral space are. Increased netting will always be the motivating factor to clear.
Finally, let’s revisit our headline – have there been any unintended consequences of the UMRs? Well, the transition to clearing certainly has the propensity to make our markets more efficient. The data tells us that so far, more clearing means more volumes.
Surely you mean *intended* consequences!? Here at the IMF, we long ago argued for incentivized central clearing, as opposed to mandated. Part of that is to increase capital charges and margin requirements to more accurately reflect the true risk of these businesses and their contributions to systemic risk. (https://www.imf.org/external/pubs/ft/gfsr/2010/01/pdf/chap3.pdf)
Inflation chart image says it’s for USD, EUR, and GBP… It is only showing USD volumes…
Hi Kevin. The source data for the chart includes EUR, GBP and USD Inflation swaps. These volumes are then converted into USD equivalents and summed up into an overall USD-equivalent volume.