Earlier this year I looked into European derivatives trade reporting (see EMIR Trade Reporting) and as not much of note has improved in the public dissemination of aggregate data in Europe, I thought I would look at Asia, starting with the largest market; Japan.
While the Japanese FSA (JFSA) requires mandatory derivatives reporting to an SDR (under Article 156-66 of the Financial Instruments and Exchange Act) there is currently no mandatory requirement on the SDRs to provide public dissemination. This situation is the same in Hong Kong, Singapore and Australia.
So without data, what is there to write about? (Except for fiction, which unfortunately is not my forte).
Well someone recently made me aware that the JFSA has published aggregated data on derivatives reported to them. So we have some data to look at and analyse.
FSA Publishes
So over the Japan Financial Services Agency website, english version at http://www.fsa.go.jp/en to see what we can find.
Well we find two links, one for end-June 2014 and one for end-March 2014. (click here).
Unfortunately the link for end-June 2014 leads to the infamous “The page cannot be found”, which is a shame. Perhaps the Japanese site works but I will leave that to one of our more learned readers to let me know. (3-Oct: See comment at the bottom for a working June link forwarded by one of our readers).
However the March 2014 link does lead to some data and the good news is that the information is far more interesting than the European aggregate disclosure I wrote about many months back.
Volumes by Asset Class
Lets start first with the overview table available on the JFSA site.
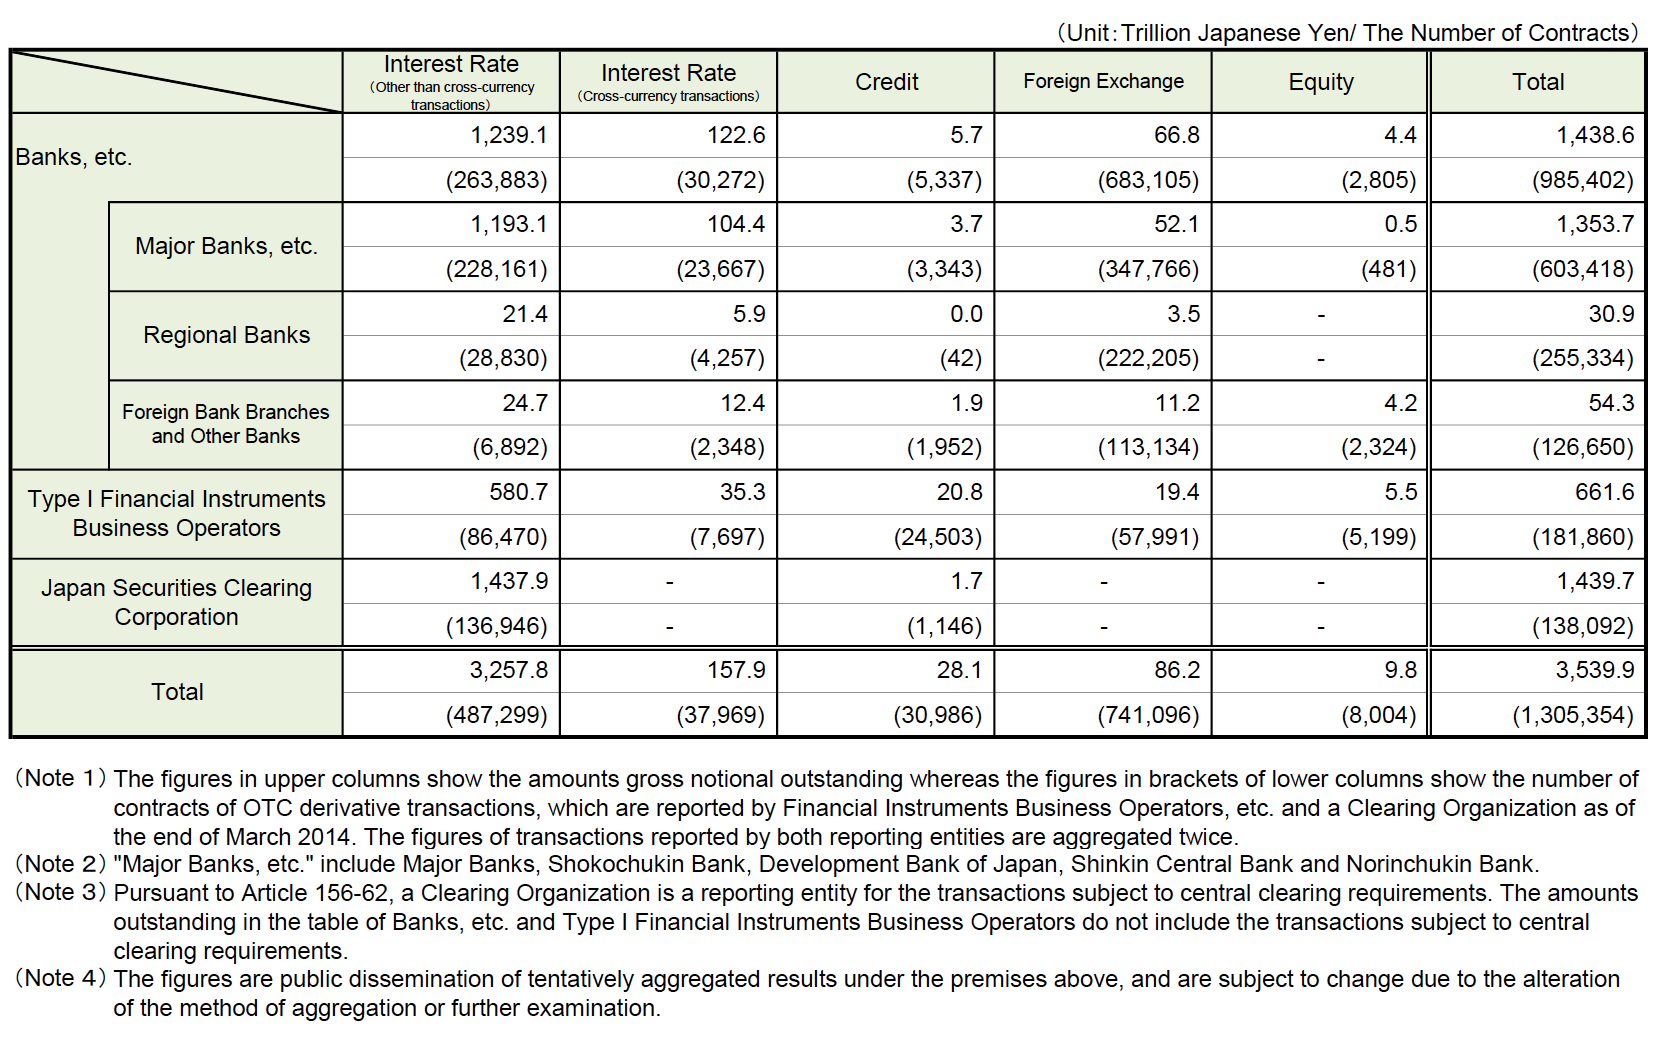
- This shows outstanding notionals and trade counts by asset class, so it really is the whole market and not just volume over a period
- The numbers are double the number of transactions (see Note 2)
- Another way to verify this is to look at the JSCC line which shows 136,946 Interest Rate trades and compare to JSCC’s own disclosure, which shows 68,473 IRS trades outstanding as of March 2014; exactly half the FSA number
- Note 1 leads us to believe that all trades are reported twice (rather than just some) at least I hope that is true
- So we could half all the numbers in the table when quoting actual amounts
- However for relative percentages this makes no difference
Lets now create some pie-charts from the data given:
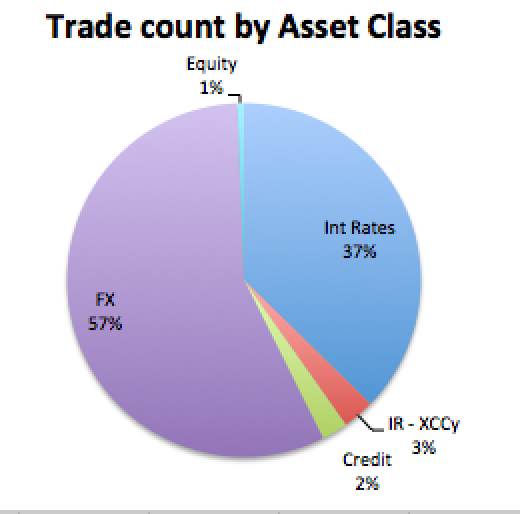
Which shows that:
- 57% of the trades are FX
- 37% are Interest Rates
- 3% are Cross Currency Swaps
- 2% are Credit Derivatives
- 1% are Equity Derivatives
The same chart by gross notional is less interesting as it would show 92% are Interest Rates.
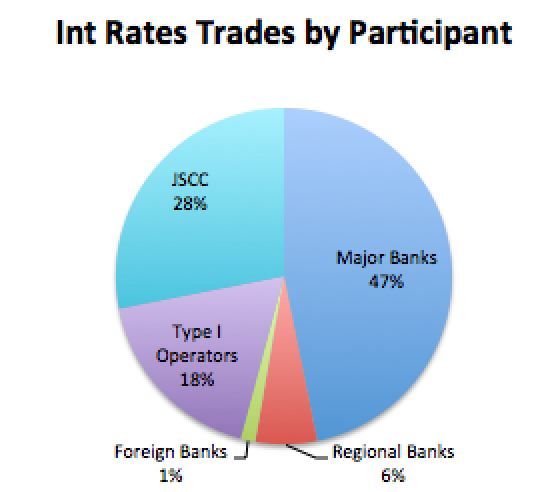
Which shows that:
- 28% of Interest Rates trades are JSCC, so Cleared
- An impressive statistic given that JSCC has only been Clearing IRS for a couple of years and only in JPY
- Bi-lateral or Uncleared trades are 72% of the total
- Major Banks (Japanese) represent nearly half (47%) of the trades
- Type I Business Operators (Securities firms, Investment Managers) are 18%,
- Regional Banks 6% and Foreign Banks 1%
More Details on Interest Rates
There are further tables available for Interest Rates, showing currency, remaining maturity, product and maturity breakdowns.
Rather than present these tables or chart them, I will just make some observations.
- JPY represents 88% of the total trades, followed by USD with 7.5%
- 32% of JPY trades are cleared vs 68% uncleared
- Major Banks dominate JPY trades with 42% share
- Securities firms & Investment Managers follow with 18%
- JPY Cleared Swaps at JSCC are 719 trillion yen in notional outstanding
- While Uncleared Swaps are 755 trillion yen in notional outstanding
- (Assuming we need to half both the reported numbers)
- Compare this to LCH SwapClear, which currently has 2,117 trillion of notional outstanding
- In-fact the current JSCC figure is 954 trillion yen, so 45% of the LCH one
- Product wise FixedvsFloat are by far the largest product, followed by Basis Swaps and then Swaptions
- OIS Swaps and FRAa are very low volume with less than 400 trades reported
- LIBOR is the most used reference index, with almost 5 times the number of trades compared to TIBOR
Details on Cross Currency Swaps
Lets now note some interesting figures for Cross Currency Swaps:
- There are 38,000 trades outstanding of 158 trillion yen notional
- Majority are JPY/USD followed by USD/EUR and EUR/JPY
- 2Y to 5Y is the largest maturity with 25 trillion notional outstanding
- Followed by 1Y to 2Y with 16 trillion and 5Y to 10Y with 9 trillion
- Major Banks dominate the product with 56% of the trades and 64% of the notional
And to relieve your eyes a chart of product types
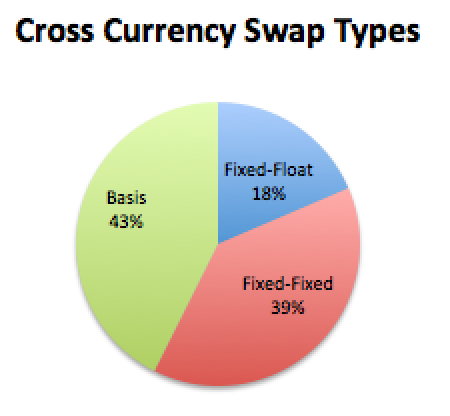
Showing that surprisingly Fixed for Fixed represent 39% by trade count. This seems largely due to regional banks trading a lot of these in smaller size than Basis Swaps traded by the Major Banks.
There is also disclosure on Credit Derivatives, but I will leave that to those of you that are interested.
Summary
Japanese firms have been required to report derivative trades to an SDR since 1 November 2012.
There is no public dissemination requirement for the SDRs.
JFSA published aggregate figures as of end March 2014.
These show us the number of outstanding trades and notional in each asset class. Tables for currency, remaining maturity, product and reference index, all with a breakdown by market participant type are also provided.
Interesting observations are that:
- 32% of outstanding JPY Interest Rate Swap trades are Cleared.
- Major Japanese Banks represent nearly half the interest rate trades.
- JSCC volumes of JPY Swaps are now 45% of LCH SwapClear volumes.
- Cross currency swaps are also a large market with 38,000 trades and 158 trillion yen notional.
While the level of disclosure is not as good as the US, it is far better than the disclosure I have seen in Europe. Granted the information is nearly 6 months old but at least it is useful information.
Far better than the daily information being published by European SDRs, which is still as meaningless as when I first reported on it.
We know every region will get onto the same playing field, but it is taking an awfully long time.