Following on from my blog, SEC Security-Based Swap Data Repositories Are Now Live, and now with 5 weeks of data published, I wanted to take a deeper look at the data for Credit Derivatives.
CDS and TRS in USD
Let’s start by looking at trades reported to the DTCC and ICE repositories by US persons that are in USD and volumes by week for the 5-week period from 14-Feb to 18-March.

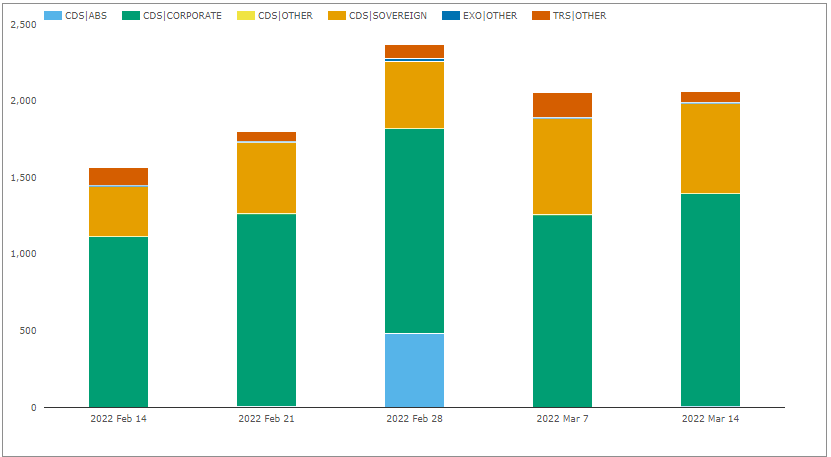
- Just over 2,000 trades a week in USD denominated products
- CDS on Corporates the largest with 1,100 to 1,400 trades per week
- CDS on Sovereigns with 300 to 630 trades per week
- TRS with 60 to 160 trades per week
- TRS underlyings a mix of Corporate, Sovereigns, Loans, which are not easily distinguisable
- CDS on ABS with 480 trades on a single day, 28-Feb, and hardly any except for that
- Exotics, a small number of trades, 3 to 20 per week
The same chart but switching from trade count to gross notional.
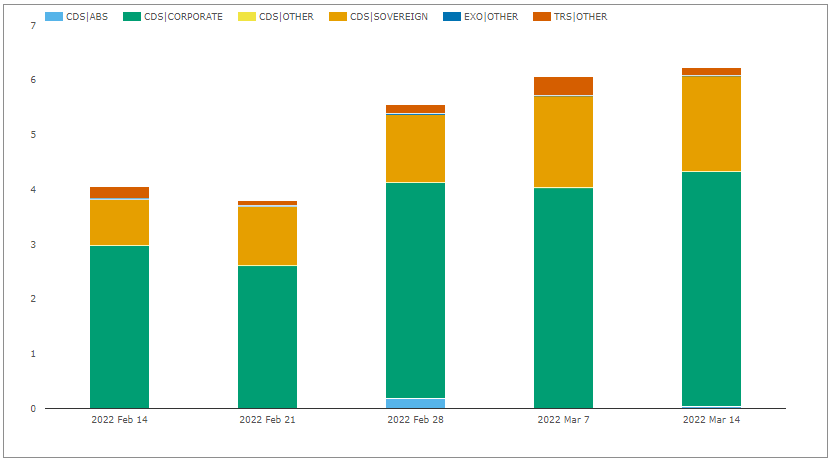
- $4 billion to $6 billion notional per week
- Though this is understated due to the capping of trade notionals to $5million
- CDS on Corporates with $3-$4billion per week
- CDS on Sovereigns with $1-$2 billion per week
- TRS with $100 – $400 million
Out of 2,065 trades in the week of 14 March, 1,236 or 60% are reported with capped notional of $5 million.
The $5million is the same figure as that used in TRACE for US Corporate Bonds.
I don’t know how much larger than $5 million these trades are on average, so difficult to estimate how much larger volume than $4-$6 billion a week, but it would not be surprising if it was 50% to 100% or more higher.
Comparing with CDX
As a comparison, we can compare with CDS Index trading volumes in major USD Indices for the same period.
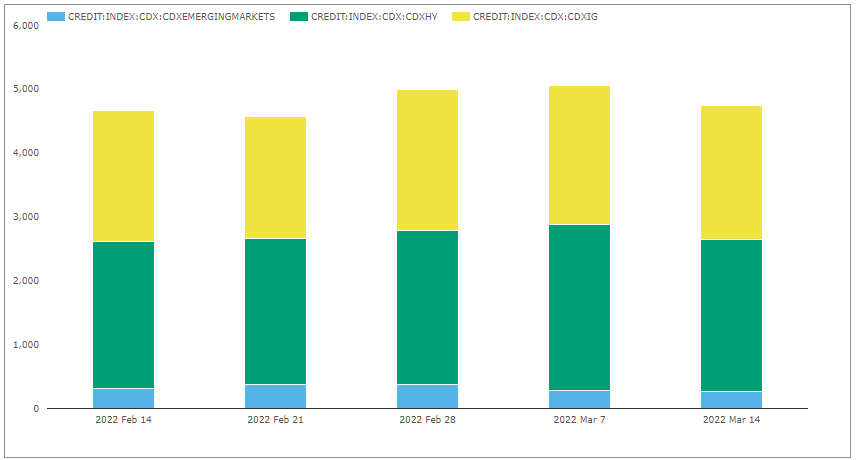
- 4,500 to 5,000 trades a week in USD denominated products
- So twice the single name volumes
- CDX HY the largest with 2,300+ trades per week
- CDX IG with 2,000+ trades per week
- CDX EM with 250 to 370 trades
The same chart but switching from trade count to gross notional.
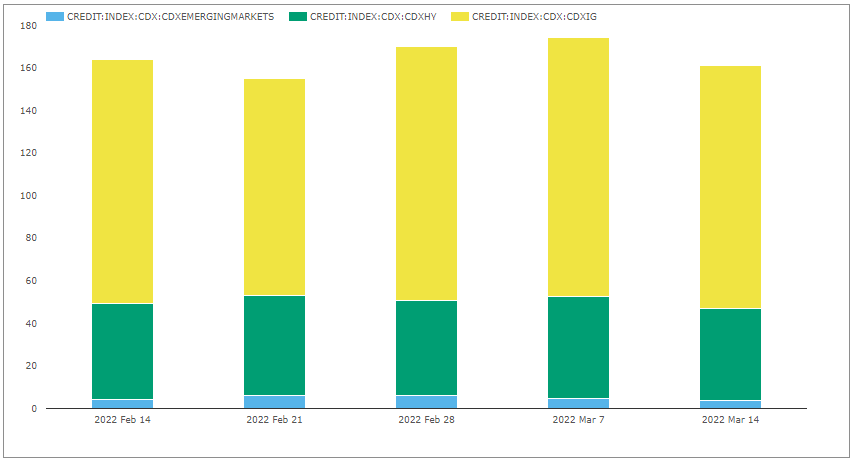
- $150 billion to $175 billion notional per week
- (Though this is understated due to the capping of trade notionals to $110 million)
- An order of magnitude, 30X, larger than the single-name volume
- CDX HY with $50 billion per week
- CDX IG with $100+ billion per week
- CDX EM with $4-$6 billion per week
Of course we would expect the average trade size of a single-name CDS to be far smaller than the Index.
As an example, as CDX.IG.NA has 50 single-name constituents, anyone doing a basis trade would buy/sell $100 million of the index and sell/buy $2 million of each single-name.
Still given that approximately 60% of the single-name trades are capped at $5 million, it will be interesting to compare with other data sources we have to try and put a figure on the average (mean/median/mode) trade size; a task for another day.
CDS and TRS in EUR
Let’s now turn to single-name trades in EUR, reported by US persons for the same period.
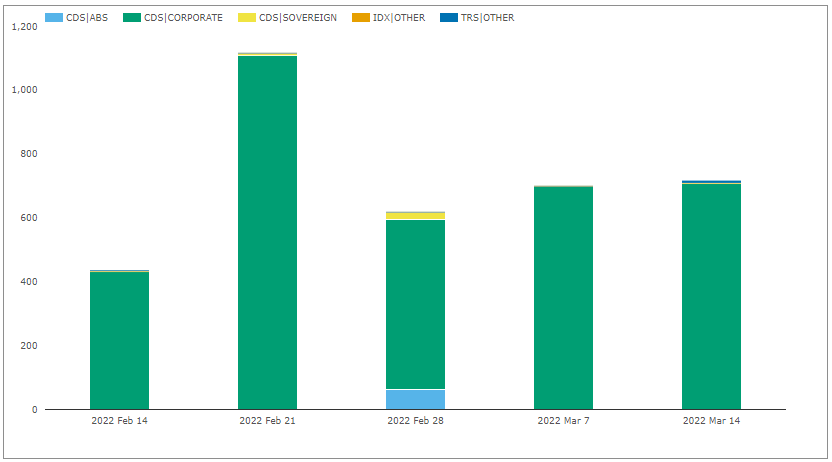
- 500 to 1,100 trades a week in EUR denominated products
- CDS on Corporates the largest with 400 to 1,100 trades per week
- CDS on Sovereigns with a few trades per week
- TRS also with a few trades
- CDS on ABS with 64 trades, again all on 28-Feb, and hardly any except for that
The low number of Soversigns seems surprising, but perhaps par for the course as this is US persons trading activity and their is far more USD denominated Soverign debt than EUR, that firms will have bought or sold protection on.
The same chart but switching from trade count to gross notional.
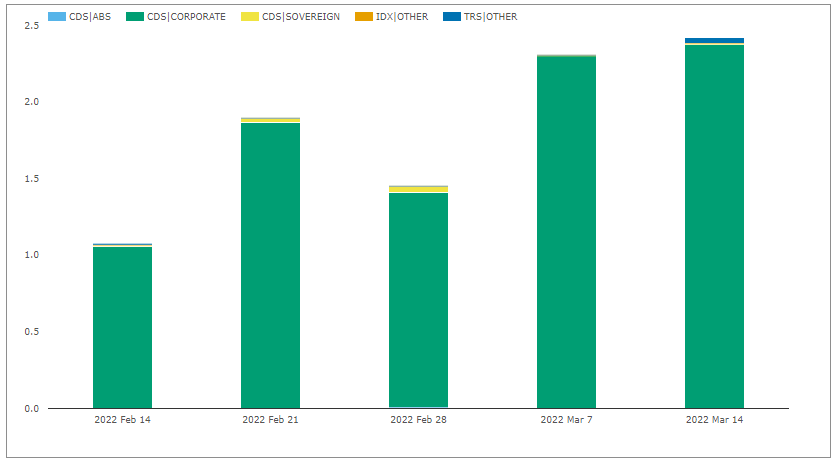
- €1 billion to €2.5 billion a week in EUR denominated products
- CDS on Corporates the vast majority of this volume
In comparison iTraxx indices volume averages 3,000 to 4,000 trades and €100-150 billion a week, so signifciantly larger than the 30X observed for USD notionals.
That’s all I have time for this week.
In Summary
Traanstions in single-name Credit Derivatives are now public.
USD denominated trades, average >2,000 per week.
CDS on Corporates is the largest segment with >1,000 traded per week.
Followed by CDS on Sovereigns.
EUR Corporates and USD TRS are next.
Trade notionals disclosed are capped at $5 million, consistent with TRACE (US Corporate Bonds).
However with almost 60% of trades capped, it is hard to estimate the true weekly notional.
Certianly much larger than the $4-$6billion a week for USD single-names.
Though materially much smaller than the $150 billion in CDX.
We plan to shortly release our SBSDRView product.
To provide more insight into this data.
Please contact us if you are interested in a subscription.