

It’s been a few weeks since we last did a general SEF report. Hopefully many of you are logging into the Freeview version of SEFView to see daily SEF activity. On the macro scale it can be hard to spot trends when looking at total aggregate SEF activity. So this week I look deeper at what we’ve categorized as the Client and Dealer SEFs.
DATA
Lets first look at the trailing 5 weeks of data:
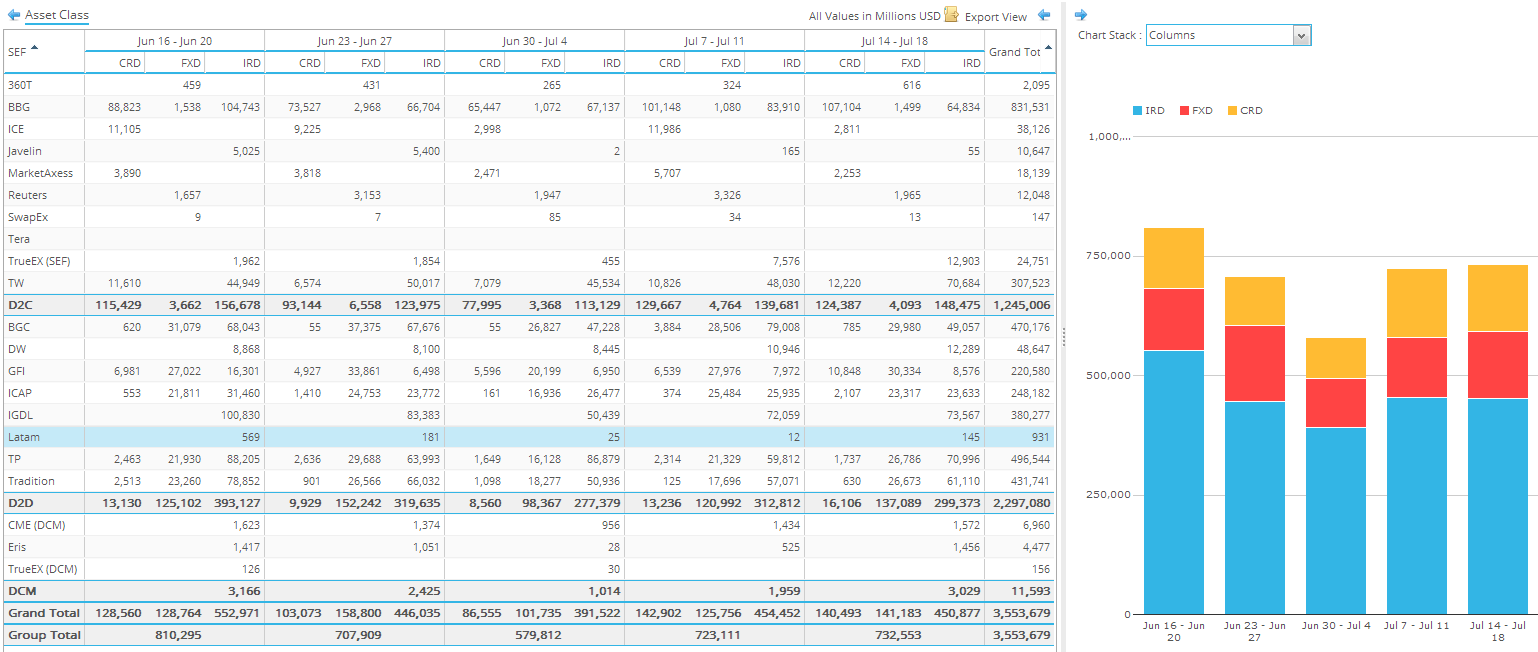
Some things to note:
- We’ve added a time horizon chart, so it’s easy to spot the dropoff in the July 4th holiday week, and then reverting to a mean
- Bloomberg and Tradeweb IRD activity continue to exchange large weeks
- D2C activity in Credit continues at ~90%. D2D is ~10%
- D2C activity in FX (remember FX is not “Required”) continues at ~4%. D2D is ~96%
- D2C activity in IRD seems to have crept back up to ~33%
D2C ON THE RISE
If we look at this D2D/D2C split going back to SEF inception, we get a fairly interesting trend emerging. First lets look at all IRD (ex-FRA and OIS):
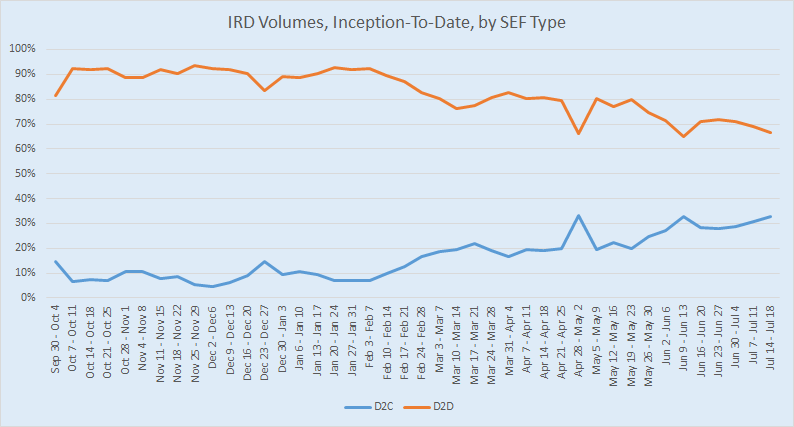
I’d think there are a few general cases for this:
- The end of package relief has forced clients to trade on-SEF
- Package trades in the inter-dealer / IDB market were largely already introduced to the IDB SEF’s pre-package relief
- The insinuation of dealers pushing their derivatives business into NGA might explain a drop in D2D (a topic for a separate blog)
- The possible recent uptick in Trade Compression being performed by SEFs (see Amir’s blog on this topic)
Whats more interesting is if we now look at G3 currencies (USD, EUR, GBP), and look only at vanilla swaps and swap futures:
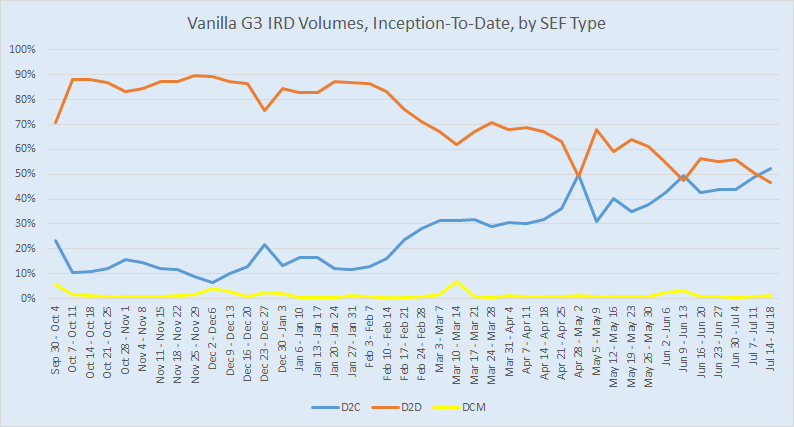
By doing so, this tells us that “Client” SEFs are actually putting through the same magnitude of activity as “Dealer” SEFs. And by limiting the world to just G3 vanilla IR swaps, we can include Swap Futures and see that they remain a negligible percent, with some occasional bumps, presumably around the IMM roll dates.
I should note that DCM includes Eris and CME, which list Swap Futures, as well as TrueEx DCM, which lists OTC swaps. So it’s not safe to equate DCM to Swap Futures. However you can see from the data table that the TrueEx DCM activity tends to be a small portion of the total DCM activity. If you want to separate out OTC and Futures, you’ll need to sign up for SEFView, but for now the difference is neglibible.
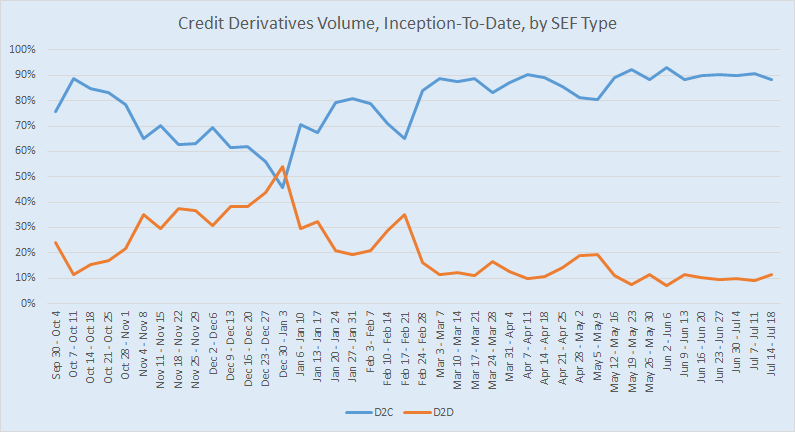
CREDIT
Before we close, we aught to complete the picture with Credit. We’ve been seeing it for months now and the picture hasn’t changed. Client SEF activity here continues to run at the 90% level. The only major correction to this was during the Christmas holidays when volumes disappeared in general.
SUMMARY
Much the same data at the aggregate level, but good to see data pointing towards further adoption of SEF’s by the buyside.