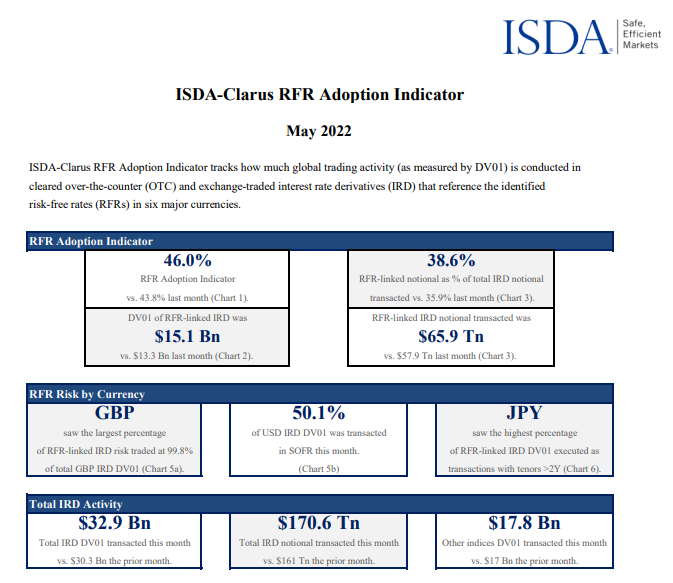
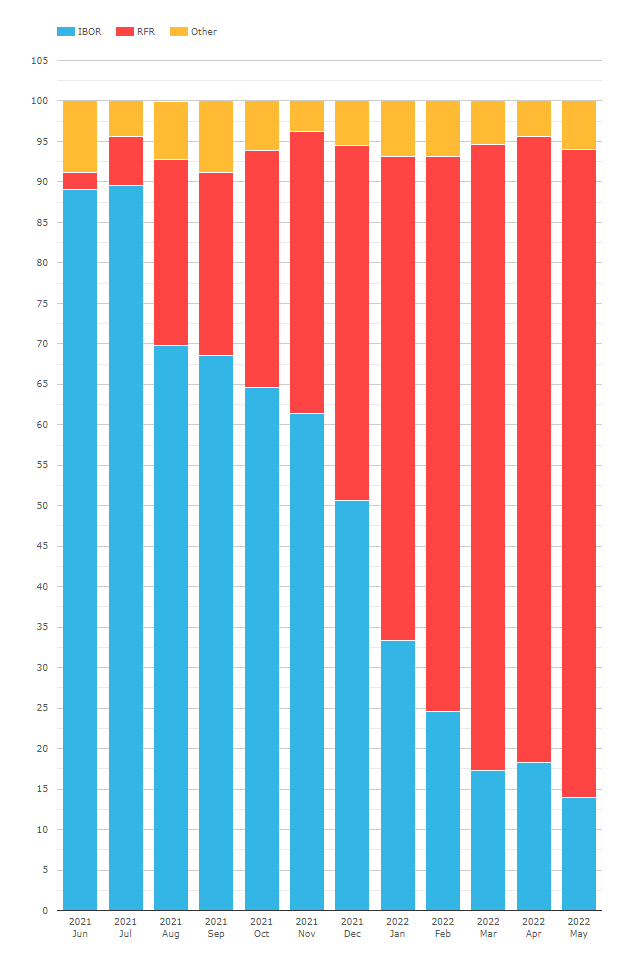
- The ISDA-Clarus RFR Adoption Indicator jumped to a new all-time high of 46.0% in May 2022.
- SOFR adoption cracked 50% (just!) of the market.
- 21.8% of EUR risk traded versus €STR, dipping slightly from last month’s all time high.
- We look at SEF activity in SOFR.
The ISDA-Clarus RFR Adoption Indicator for May 2022 has now been published.

Showing;
- A new all-time high of 46% for the overall RFR Adoption Indicator.
- May 2022 was the fourteenth consecutive monthly increase in RFR adoption, dating back to March 2021.
- SOFR adoption increased to another all time high of 50.1%.
- Virtually 100% of trading is now in RFRs for CHF, JPY and GBP. There is little reason to expect this to change in the future.
- It was quite a subdued month again in terms of overall trading activity. That seems amazing to write this week, after all the market volatility we are witnessing.
Are There Any Gotchas?
The data is telling a strong story, and it is remarkably consistent.
SOFR adoption up – Yup.
Trading near 100% in the old LIBOR currencies – Tick.
€STR – kind of plodding along but needs to do more – Still the case.
AUD – not interested in transition right now – Yes siree.
Which SEF sees the most SOFR?
With little to highlight from the ISDA report, let’s take a look at another area of Clarus data – SEFView. Our data app monitors the market share of SEFs. Is transition away from USD LIBOR to SOFR causing any changes at the SEFs?
Let’s look at four charts.
1. Overall SEF USD Activity
First up, market share across all SEFs across all USD Rates products (LIBOR and RFRs):

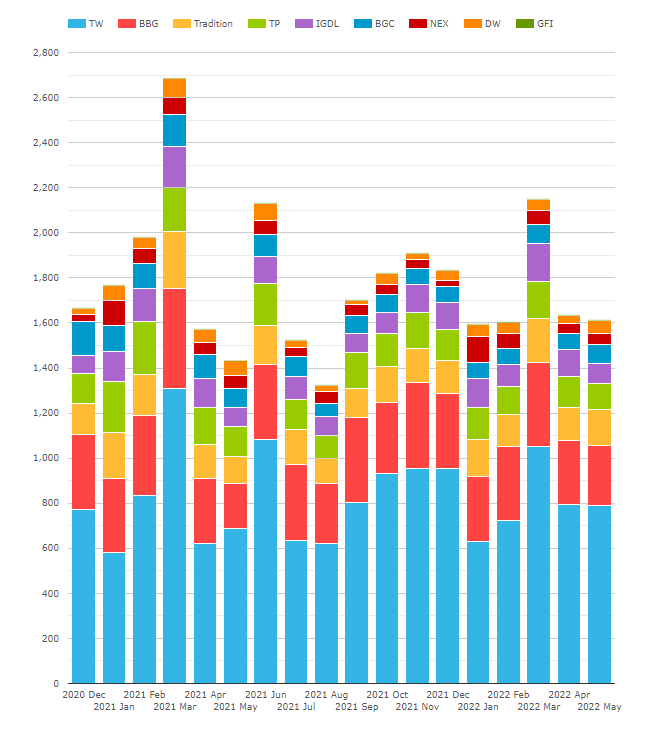
Showing;
- Market share as measured by DV01 ($ millions). Please note that these charts look significantly different by notional.
- The dominance of the D2C platforms, Tradeweb and Bloomberg, continues to be notable. They account for 64% of total activity – although I’m not convinced all of that activity is truly price forming?
- Before December 2021, when SOFR adoption was at ~25% of the USD market (or lower), D2C platforms saw a 64% market share of total activity. In 2022, with SOFR adoption now climbing to 50%, that has not changed one bit. They have still seen 64% of total activity this year!
- If we look at Tradition, who have a 9.0% market share over the period, this was almost exactly the same in 2021 and 2022 as well (8.9% vs 9.4%).
- It is a similar story across all of the SEFs. Market share is remarkably stable. TP (Tulletts) averages 8.1% this year versus 9.2% last year; IGDL (ICAP) at 6.9% this year vs 6.4% in 2021.
- Tradeweb at 46% and Bloomberg at 18% have likewise been stable. Look at that Tradeweb number – impressive!
2. D2C SOFR Activity Only
Secondly, what is the battle like between Tradeweb and Bloomberg on SOFR? The chart shows volumes in DV01 ($ millions).

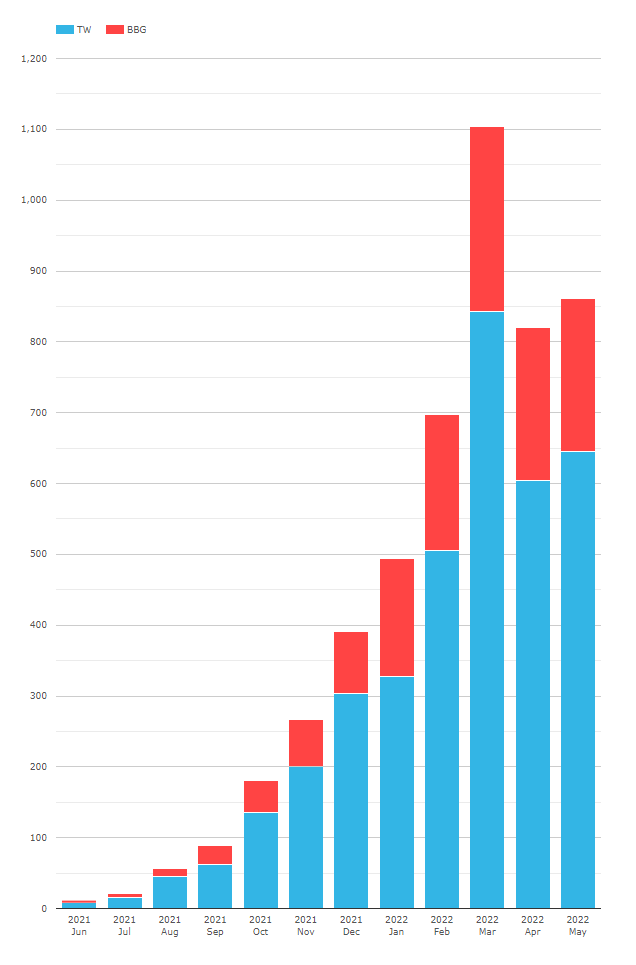
I like this chart as it shows how quickly SOFR trading has taken off in just 12 months. Looking at the figures;
- March 2022 is the only month when over $1bn of DV01 has traded in SOFR linked products on D2C SEFs. As with the rest of the market, the past two months have seen a decrease in activity. I wonder again if the current market volatility in June will change that?
- Tradeweb has a ~73% market share in 2022. This has been stable for the past 12 months, in a range 66-88%.
- SOFR transition does not appear to be threatening the Tradeweb dominance.
3. D2D SOFR Activity Only
With interdealer SEF activity transitioning to SOFR thanks to the SOFR first initiatives, where do the current market shares lie for the IDBs?

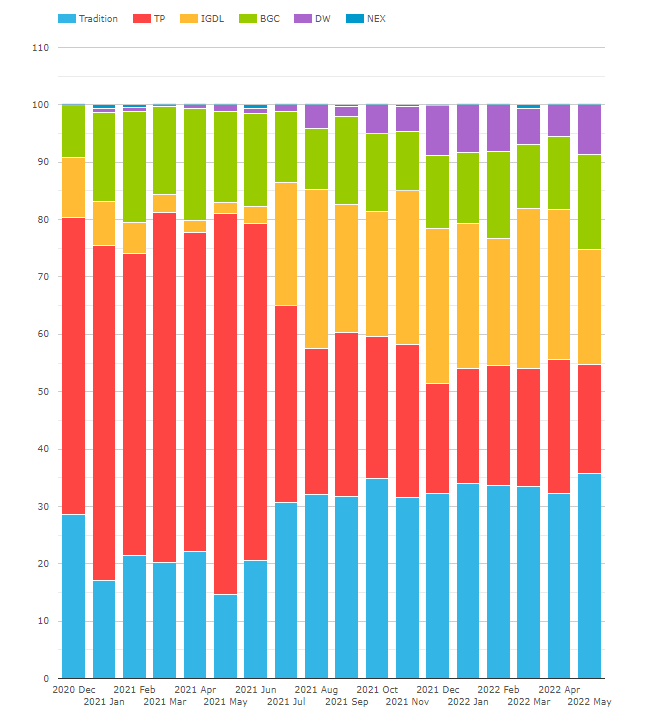
Showing;
- Market share as measured by DV01 ($ millions). Please note that these charts may look significantly different by notional.
- Trads have had a 34% market share in SOFR this year. That is up from ~30% in the second half of 2021.
- ICAP (IGDL) at 24%, combined with Tulletts (TP) at 21%, are 2nd and 3rd respectively (or 1st when combined!).
- BGC have seen a consistent 13-14% market share.
- Interesting to note the growth in Dealerweb. Maybe Tradeweb are successfully leveraging the D2C footprint into the interbank market now? That is one worth investigating in a future blog.
And What About SEF SOFR Adoption?
This is a pretty cool chart to finish the blog with. Nearly 80% of SEF trading, as measured by DV01, is traded versus SOFR. If only everything was traded on SEF (and OTC!):

In Summary
- RFR Adoption across the whole market hit a new all-time high of 46.0% in May 2022.
- Over half of the USD Rates market traded vs SOFR.
- SEF market share in USD rates products is stable as the transition progresses.
- D2C SEF platforms see 64% of total USD SEF volumes.
- 80% of all SEF USD volumes are traded versus SOFR (measured by DV01).