- SOFR Swaps at D2D Venues trade as Spreadovers, Butterflys or Curve trades
- Spreadovers are the largest with ICAP leading
- Butterflys next, Dealrweb and Tradition
- Curves with ICAP leading
- CCPSwitch, Tradition leading
- On D2C Venues, Outrights are the most common trade
- Volume in trade count and dv01 higher than D2D
- Tradeweb and Bloomberg vying for top position
- Forwards/IMM/MAC Swaps trade in significant numbers
- SEF Compression volumes are huge with Tradeweb dominant
Continue reading for the charts, tables and details
Background
In February 2024, I published the blog 2023 SEF Volumes and Share in SOFR Swaps, which used data we collect, filter and enhance in our SDRView product. That blog looked at the type of SOFR Swaps that trade on Dealer-to-Dealer (D2D) and Dealer-to-Client (D2C) venues; namely Spreadovers, Curves and Flys and showed volumes for the 2023 calendar year.
In today’s blog, I will extend that analysis to 2024 YTD, the period Jan 1, 2024 to May 31, 2024.
Let’s get started.
D2D SEF Volumes in SOFR Swaps
First using SDRView we show a chart and table of trade counts for 2024 YTD, for spot starting USD SOFR Swaps that are On SEF and the SEFs are D2D. The table columns are the Platform Id of the SEF and table rows are package types (as identified by Clarus).

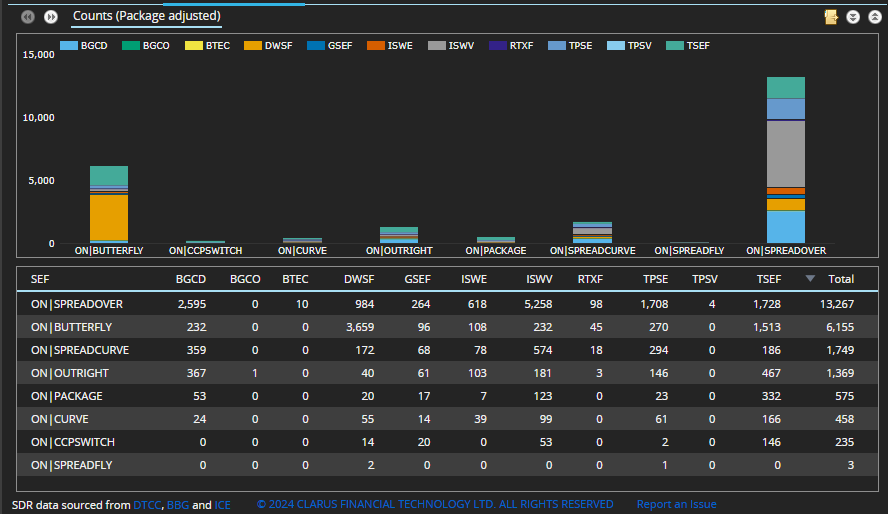
- Spreadovers are by far the most common type with 13,267 trades
- The ICAP venues (ISWE, ISWV) with 5,876 trades represent 44.3% share
- The BGC venues (BGCD, BGCO, GSEF) with 2,859 trades represents 21.5% share
- Tradition (TSEF) 13%, Tullet (TPSE) is 12.9% and Dealerweb (DWSF) is 7.4%
- RTX, a new SEF, with 98 trades and 0.7% share
- Butterflys, shown above as Butterfly or SpreadFly with 6,158 trades
- (Note this is a package adjusted count, so as there are 3 trade legs for each butterfly in SDR data, a total of 18,474, we adjust this to the 6,158 butterfly packages traded)
- Dealerweb with 3,661 trades, from Sweep, it’s session based platform, has 59.5% share
- Tradition with 1,513 trades out of the 2,497 not on Dealerweb, has 60.5%
- Curve Switches, shown above as SpreadCurve and Curve combine to 2,207 trades
- (Note this is also package adjusted, so 2 trade legs and 4,414 transactions in SDR data)
- ICAP with 790 represents 35.8% share
- BGC 21.1%, Tullet 16.1%, Tradition 15.9%, Dealerweb 10.3%
- RTX with 18 trades, 0.8%
- CCPSwitch, with 235 trades
- (Note this is also package adjusted, so 2 trade legs and 470 transactions in SDR data)
- Tradition with 146 or 62% and ICAP with 53 or 23%
The Outright and Packages rows above represent noise in the data and I will ignore for our analysis. The former are most likely Spreadovers that we have not identified, while the later should be one of the other types or a granular type we do not identify. Including or excluding these does not make a material difference to our analysis above.
Next, instead of trade count, we can change the above table to show DV01 (package adjusted).

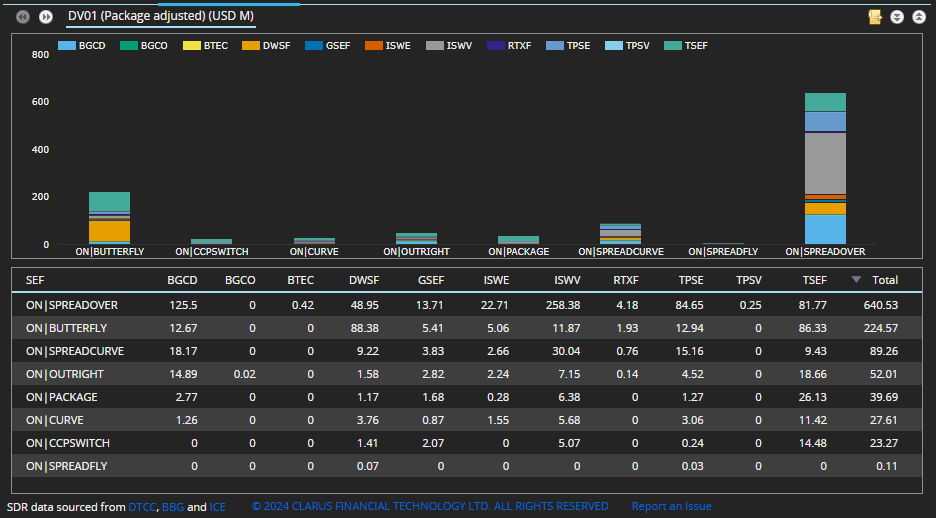
- Spreadovers with > $640 million of DV01
- (recall that SDR capped notional rules, means this figure is under-stated, possibly by up to 30%)
- Re-calculating the shares above in DV01 terms shows a few small differences
- Spreadovers, ICAP with 43.9%, BGC 21.7%
- Butterflys, Dealerweb 39.4% and excluding this Tradition 60%
- Curves, ICAP 34.2%, BGC 20.6%, Tradition 17.8%, Tullet 15.6%
- CCPSwitch, Tradition 62.2%, ICAP 21.8%
DV01 has the advantage as its is a better proxy to the brokerage revenue earned and share of wallet.
D2C SEF Volumes in SOFR Swaps
Next using SDRView we show a chart and table of trade counts for the 2024 YTD for USD SOFR Swaps (spot starting) that are On SEF, the SEFs are D2C with columns as Platform Id of the SEF and rows as package types (as identified by Clarus).

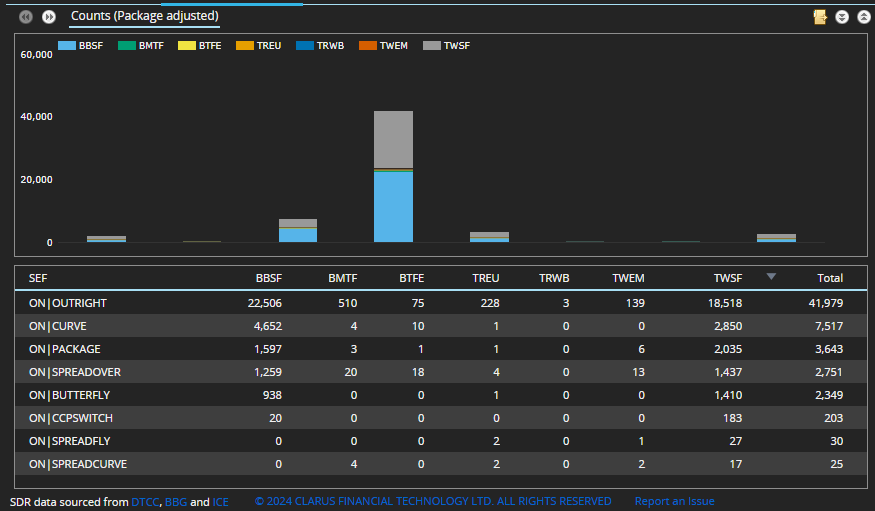
- Outrights are by far the most common trade type with 41,979 trades
- Compare this to the 13,267 Spreadovers on D2D SEFs
- Bloomberg venues (BBSF, BMTF, BTFE) with 23,091 trades have 55% share
- Tradeweb venues (TREU, TRWB, TWEM, TWSF) with 18,888 trades have 45% share
- Curve, shown above as Curve or SpreadCurve with 7,542 trades (package adjusted)
- Compare this to the 2,207 in D2D SEFs
- Bloomberg with 4,670 or 62% share
- Tradeweb with 2,872 or 38%
- Spreadovers with 2,751 trades (compared to 13,267 on D2D)
- Split Bloomberg 47% and Tradeweb 53%
- Butterflys with 2,379 trades (compared to 6,158 on D2D)
- Tradeweb with 61% and Bloomberg with 39%
Package with 3,643 trades, is a higher number than we would like to see and a future task to further categorise and break this down into a more granular type.
Next, as before lets change the above table to show DV01 (package adjusted).

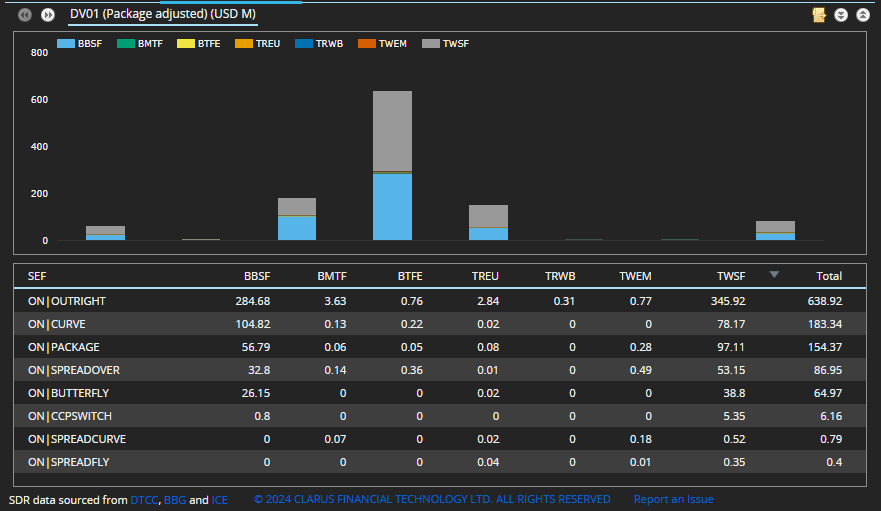
- Outrights and Spreadovers with > $726 million of gross dv01
- So higher than the > $640 million DV01 on D2D SEFs
- Re-calculating the shares in DV01 terms shows material differences
- Outrights has Tradeweb 55% and Bloomberg 45% (switched from trade count share)
- Curve is Bloomberg 57% and Tradeweb 43%
- Spreadover is Tradeweb 62%, Bloomberg 38%
- Butterfly is Tradeweb 60%, Bloomberg 40%
Next Forwards, IMM or MAC Swaps trades in significant volume on D2C venues, unlike on D2D.

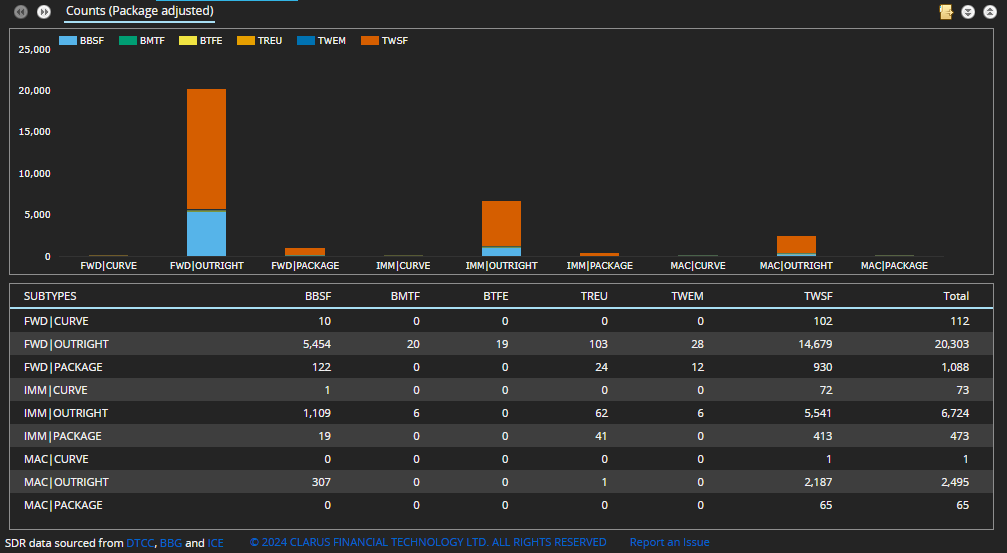
- Forward Outrights the largest type with 20,303 trades
- IMM Ourights next with 6,724 trades
- MAC (Market Coupon) Outrights with 2,495 trades
- Package here are most likely to be Invoice Spreads (vs CME Futures)
I won’t go into share percentages here, but the data above allows this to be calculated.
Similarily in the interests of brevity, we will skip the DV01 table for the above.
And one last chart, this time looking at SEF Compression trades on D2C SEFs, where risk of an existing portfolio of trades is first offset (trade by trade) and then re-stated with new trades.

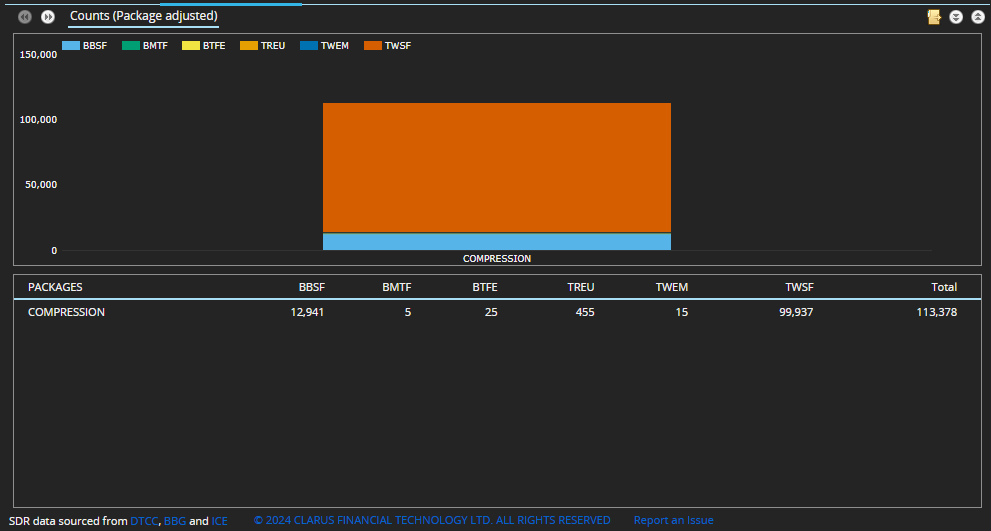
- A total of 113,378 trades, so far higher than anything else in D2C
- Tradeweb with 100,407 trades or 89% share
- Bloomberg with 12,971 trades or 11% share
That’s It
Six charts and tables to cover SOFR Swap volumes and share.
There is a lot more data in SDRView and SEFView.
Daily, weekly, monthly, quarterly and annual.
Currency, Product, Subtype and Package type.
Trade counts, notionals, dv01.
Venue type (D2D, D2C, SDP, Off Venue).
Please contact us if you are interested in a subscription.