SONIA has seen some growth over the past year or so which we expected.
Edwin Schooling Latter, Director of Markets and Wholesale Policy at the FCA in January 2019 and Andrew Bailey, Chief Executive Officer at the FCA in July 2019, both commented on the growth of SONIA derivatives markets. In summary the market volume for SONIA turnover has increased in 2019 but the detail of this growth is also important; it is mostly in tenors less than 2 years.
My Feb 2019 blog looked at the market growth and the expectations for 2019. As we near the end of 2019 I wanted to look again at SONIA swap volumes relative to GBP Libor.
This blog looks at the SONIA volumes and focuses on the traded volume at different tenors. Clearly the majority of the volume is less than 2 years but what has happened to longer tenors?
If markets are to transition from Libor to SONIA before 2022 (when Libor is expected to cease publication) the longer tenors (i.e. longer than 2 tears) will need to show substantial growth in SONIA volumes relative to Libor.
Can we see evidence of growth in the critical 3 plus year sector where debt and loan markets tend to concentrate their trading?
Changes in SONIA volumes
My Feb 2019 blog was quite optimistic about the growth in SONIA volumes in 2019. I noted that this would be an important factor in determining whether the markets were transitioning from Libor to SONIA before 2022.
The following graph shows the cleared volumes of SONIA OIS trades from January 2018 until September 2019 which I downloaded from CCPView.

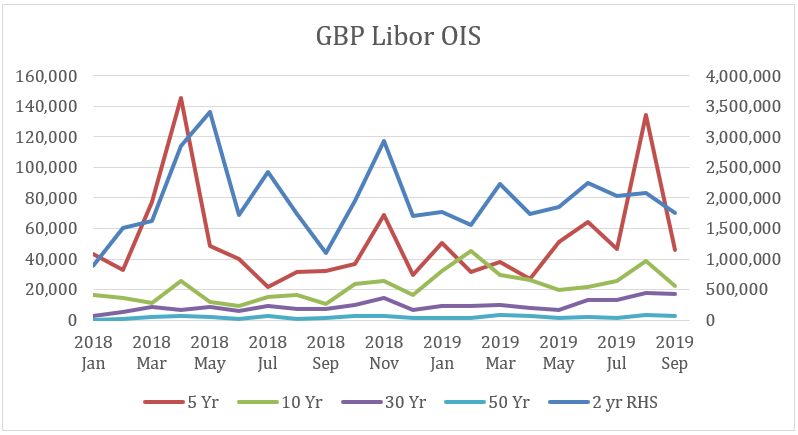
The graph does not show substantial growth in any of the SONIA OIS markets since 2018. If we focus on 2019, we get the same outcome: no substantial growth in any of the cleared OIS volumes.
The 5 and 10 year tenors show little growth if we exclude the 5 year volume spikes in April 2018 and August 2019. (The spikes only occur irregularly and appear to outliers in the data set.)
So far, my expectations from February of increased volumes are not showing up in the data.
SONIA and Libor Volumes
A reasonable explanation for this observation is that there has been little overall growth in market volumes of Libor and SONIA since January 2018. Perhaps a better way to look at the SONIA growth is to look at the total market (Libor plus SONIA) and then the ratio of SONIA to Libor cleared trading volumes.
The next graph shows the total market traded volume per month since January 2018.

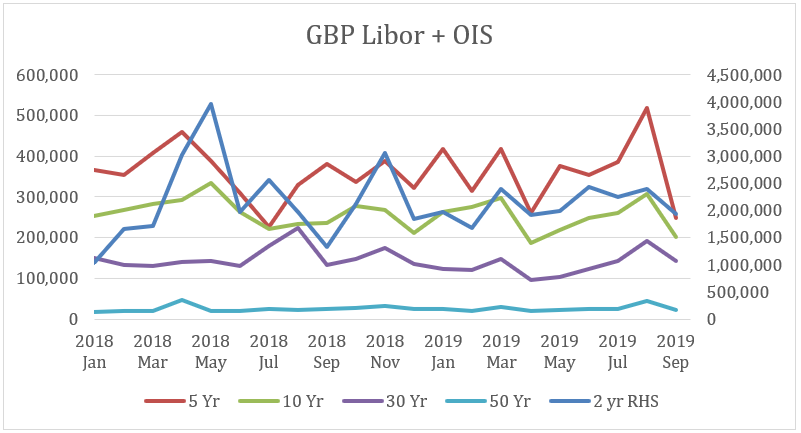
Indeed, there has been little growth in the total market traded volume so it appears that SONIA is not really growing relative to Libor in any of the tenors.
The next graph shows the ratio of SONIA to Libor trading per tenor since January 2018 (note the 2 year ratio is on the RHS scale).

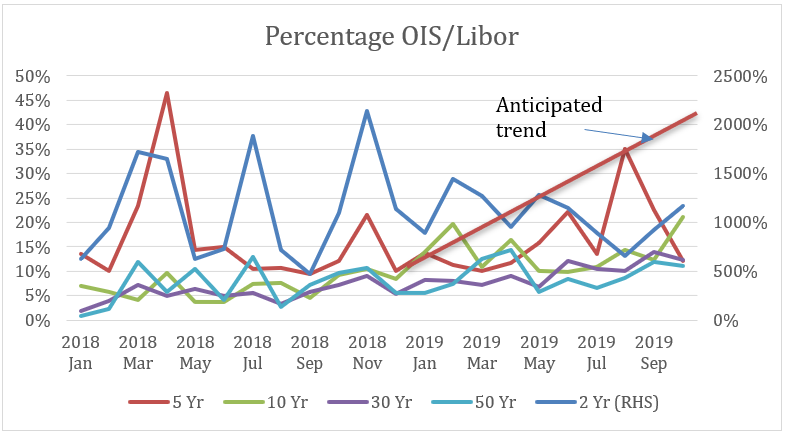
But here again, we are not really seeing SONIA trading grow at the expense of Libor trading. The “Anticipated trend” line is my expectation of OIS/Libor growth from February 2019. The actual growth is well below the anticipated growth so far in 2019.
The critical 5 and10 year tenors show a flat ratio, so we are not seeing a migration of trading from Libor to SONIA in the typical tenors favoured by debt issuance and loans.
Why does lack of migration in longer tenors matter?
The expected date for Libor cessation is 2022, so trades longer than 2 years (i.e. after December 2021) with a Libor rate fix after 31st December 2021 will likely have exposures to a benchmark that may not exist!
Certainly trades out to 5 years (and longer) tenors will reference a benchmark (Libor) that will be subject to probable cessation and revert to a fallback.
So why are traders and hedgers taking this risk and not simply moving to SONIA?
This lack of urgency remains a mystery but is still a fact. The derivative markets must be waiting for something to produce the risk longer than 5 years that will create demand for the derivatives.
The missing component could the cash trades; for example bonds, loans and securitised products. The risk generated from these trades has historically created a need to hedge with derivatives which, in turn, drives a secondary derivative market to spread the risk.
Also, speculation is a major component of longer-dated derivative traded volume. We will need to see a significant migration of this activity to SONIA if volumes are going to exceed Libor turnover.
Either way, volume creates liquidity which attracts further volume. The challenge is how to start a significant migration to SONIA.
So far in 2019 there is little evidence that derivative markets are making a significant move to SONIA.
Final Thoughts
SONIA derivative traded volumes are still languishing behind the Libor volumes in the longer (> 2 year) tenors.
What will be the catalyst to a switch from Libor to SONIA?
It could be a combination of cash trades and speculation making the decision to move to SONIA.
I can understand the position of the speculators: they often trade short term and fully expect to unwind positions (even those that mature past 2021) well before the 2022 dates.
A switch to SONIA for speculators could be relatively simple once volumes are sufficient to support efficient trading outcomes.
But hedging of cash instruments is different. This activity is more hold-to-maturity and is based around the actual cash instruments. A shift to longer-dated issuance and loans maturity based on SONIA is slowly building but needs to accelerate quickly. The alternative is shorter-dated issuance (<2 years maturity) which has its limitations as we approach the key 2022 date.
In summary, my expectations for SONIA at the start of 2019, for significant growth of volumes in longer maturities this year is far from being met.
The major question is: What will create the impetus to make the switch from Libor to SONIA for cash and derivative trades?
We will have to wait a little longer for an answer.