

We now identify package trades within SDR data in real-time. These packages represent 25% of reported trades. Users can access this analysis via our SDRView Pro application, further increasing the utility and transparency of the data within OTC markets. This is a good example of how we can add simplicity and clarity to the data – a hallmark of all that we do.
Hiding in Plain Sight
We now identify, in real-time, whether a trade being reported to an SDR belongs to a Swap Curve or a Swap Fly package transaction.
Our identification algorithm calculates the trade DV01, augments this to the trade record, and uses this DV01 to look for off-setting trades. This allows us to tell you, our users, whether each trade is an outright or belongs to a strategy.
In one swoop, this real-time analysis removes so much noise from the data. It particularly removes the tendency of these strategies to hide in plain sight. After-all, these package transactions are subject to the execution mandate under DF, therefore it makes sense that we treat the data as a package, rather than a series of outrights. By aligning the handling of the data with the way markets trade, we increase both the utility of the data and the transparency of the markets themselves.
Enough of the back-patting….
We’ve used our API in the past to conduct some ad-hoc analysis on Curve and Fly trades, and we now deliver this analysis via our SDRView Pro web app. For example, we see the following Curve trades from Friday:
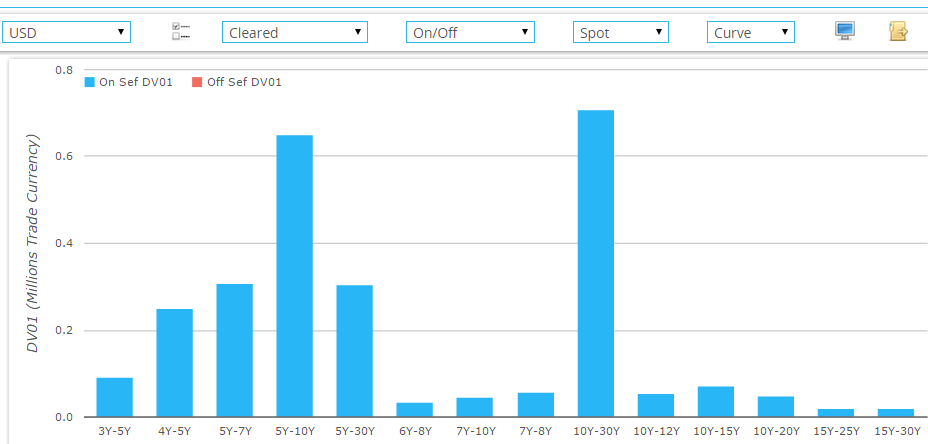

Before we go into some data analysis, what this screen allows us to do is:
- Identify spot-, forward-, IMM- or back-starting Curve trades.
- Identify the same types of trades as Butterfly (‘Fly”) strategies. For clarification, any trade belonging to a Fly is excluded from identification as a Curve trade.
- Exclude all Curve and Fly trades from any list of trades. This allows users to focus on pure price-forming outright transactions.
- View all trades matching particular trade criteria, just as before.
We feel this is an extremely powerful development due to the sheer size of data we are talking about, which we have touched upon in previous blogs. As an example, using Friday’s data, we see that 132 out of the 581 USD spot trades were part of a package (~23%). This increase in transparency for a quarter of all trades represents a huge step forwards.
Below, we present some of the numbers for the month of January 2015.
Yes, that really is a LOT of 5y10y!
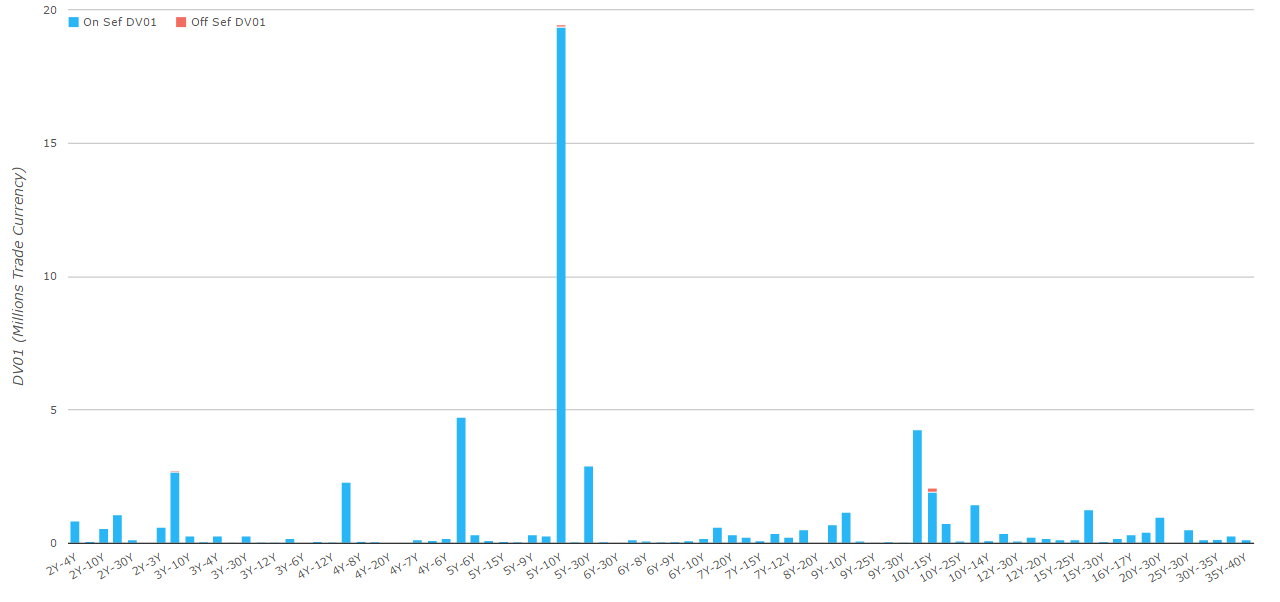

The above chart shows the DV01 of Curve trades during January 2015. We only show the DV01 of the strategy. This means that the combined DV01 of each leg (as reported separately) is double what is shown. In reality, the sum of the outright DV01s across all legs is equal to zero – because the curve strategies are, by definition, delta neutral.
In summary, the graph shows:
- $57.7m DV01 of Curve risk traded during January 2015.
- Nearly $20m in DV01 traded in 5s10s, representing 33% of all Curve risk traded.
- 5s7s and 10s30s were next up on the pecking order, accounting for 8% and 7% respectively.
- 1,158 Curve trades in total.
- 83 different combinations of tenor.
And what about those Flies?
Repeating the analysis for Flies traded during January 2015, in USD swaps we see the following:
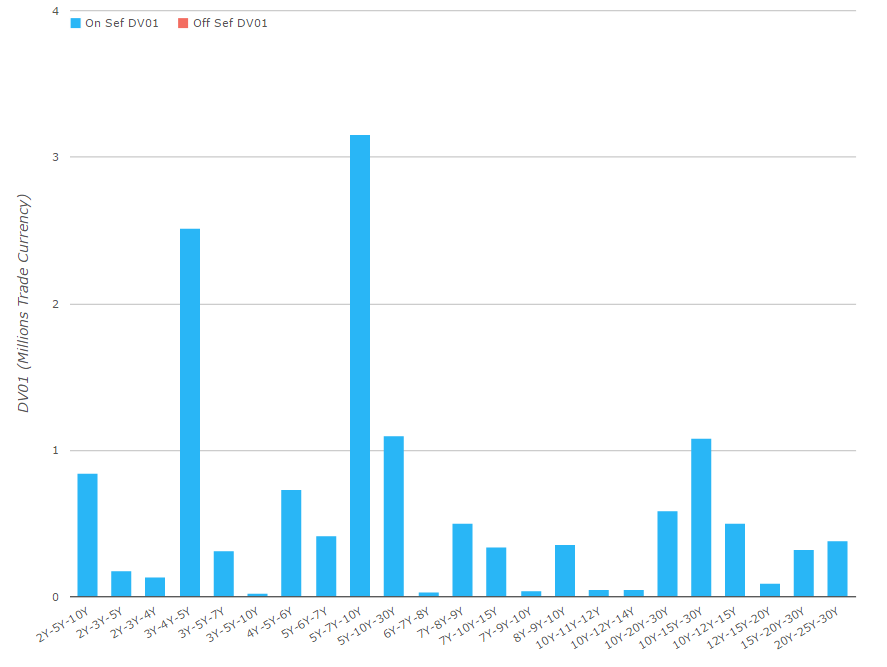

In Summary:
- $13.8m DV01 of butterfly risk traded during January 2015.
- 392 Fly trades in total.
- 23 different combinations of tenor.
- And nicely fitting in with the Curve data, we see 5y7y10y as the predominant structure, accounting for 23% of Fly risk traded ($3.2m in DV01 during the month).
Simplify, Then Add Clarity…
Colin Chapman was a genius. His vision to “Simplify, then add lightness” resulted in the most ground-breaking leaps of performance-led design ever seen in racing cars. I like to think that Clarus can achieve something similar with OTC data when we “Simplify, Then Add Clarity”.
We know that the value of the data in the SDRs lies within its’ granularity. However, this granularity often just serves to hide the real picture. Market participants therefore need clarity to make the data usable on a day-to-day basis. The ability to identify package trades within the SDRs is a classic example of how valuable data is able to hide in plain sight. Fortunately, we can also take advantage of this trait to add value. Or, if you prefer, simplify the data and then add clarity.
And if you would like even more clarity on the subject, please check out our background reading , which includes definitions of Swap Curve and Fly trading strategies.