This is Part III in a series. Please also see Part I and Part II.
As we continue upon our noble goal of democratizing swaps market knowledge, we look into (maturity) spread prices and their volumes.
We’ve so far been focussed on the previous FOMC meeting, but let’s bring the analysis a little more up-to-date and look at Friday’s non-farm payroll release. An undoubtedly strong number, we would expect the curve to steepen on the release. Let’s see what actually traded and if we can tie-in volumes with prices.
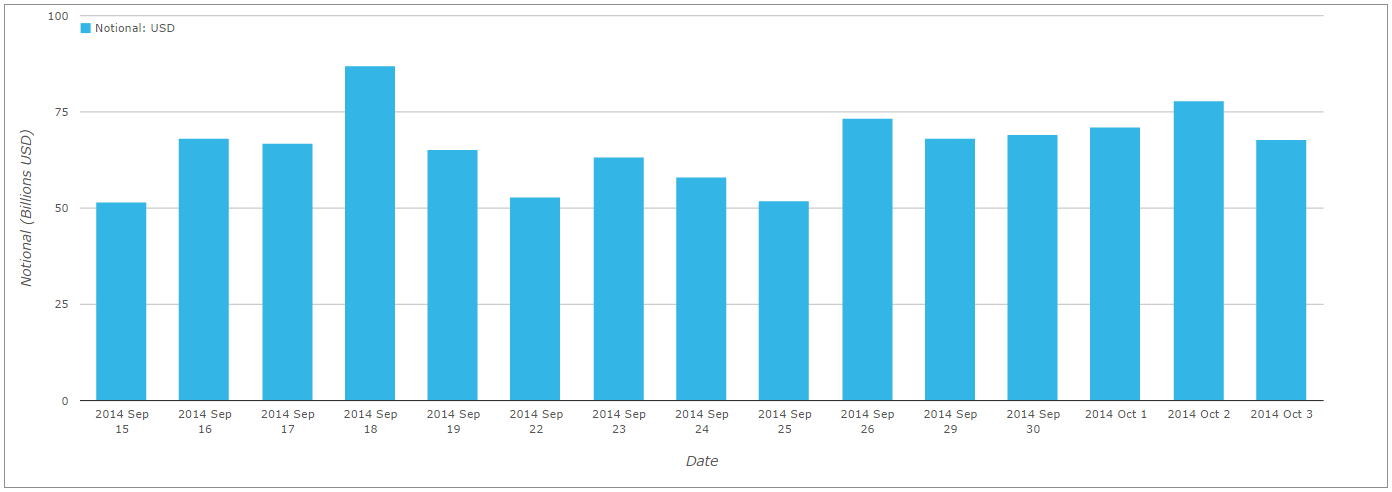
We can see from SDRView Researcher that overall USD IRS volumes on-SEF were very similar on Friday (Oct 3rd) to September 17th, our previous focal day:
Re-visiting the analysis we did for Spreads from last week, we can summarise curve activity in one chart, where we slice and dice each maturity traded versus another:
For October 3rd
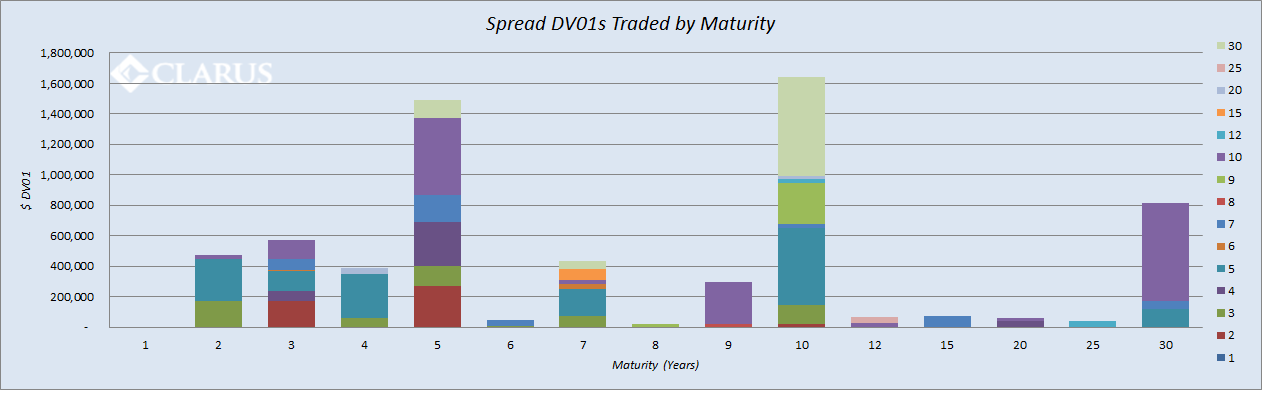
And for September 17th

As we can see, whilst the overall split is broadly similar, fewer maturity spreads traded on Friday’s NFP day than the FOMC day on September 17th. Interestingly, it is the huge drop in 5y10y between the two days that is most significant – September 17th saw $1.4m in DV01 trade, versus just $500k on Friday. This accounts for the majority (>50%) of the difference in spread trading between the two days.
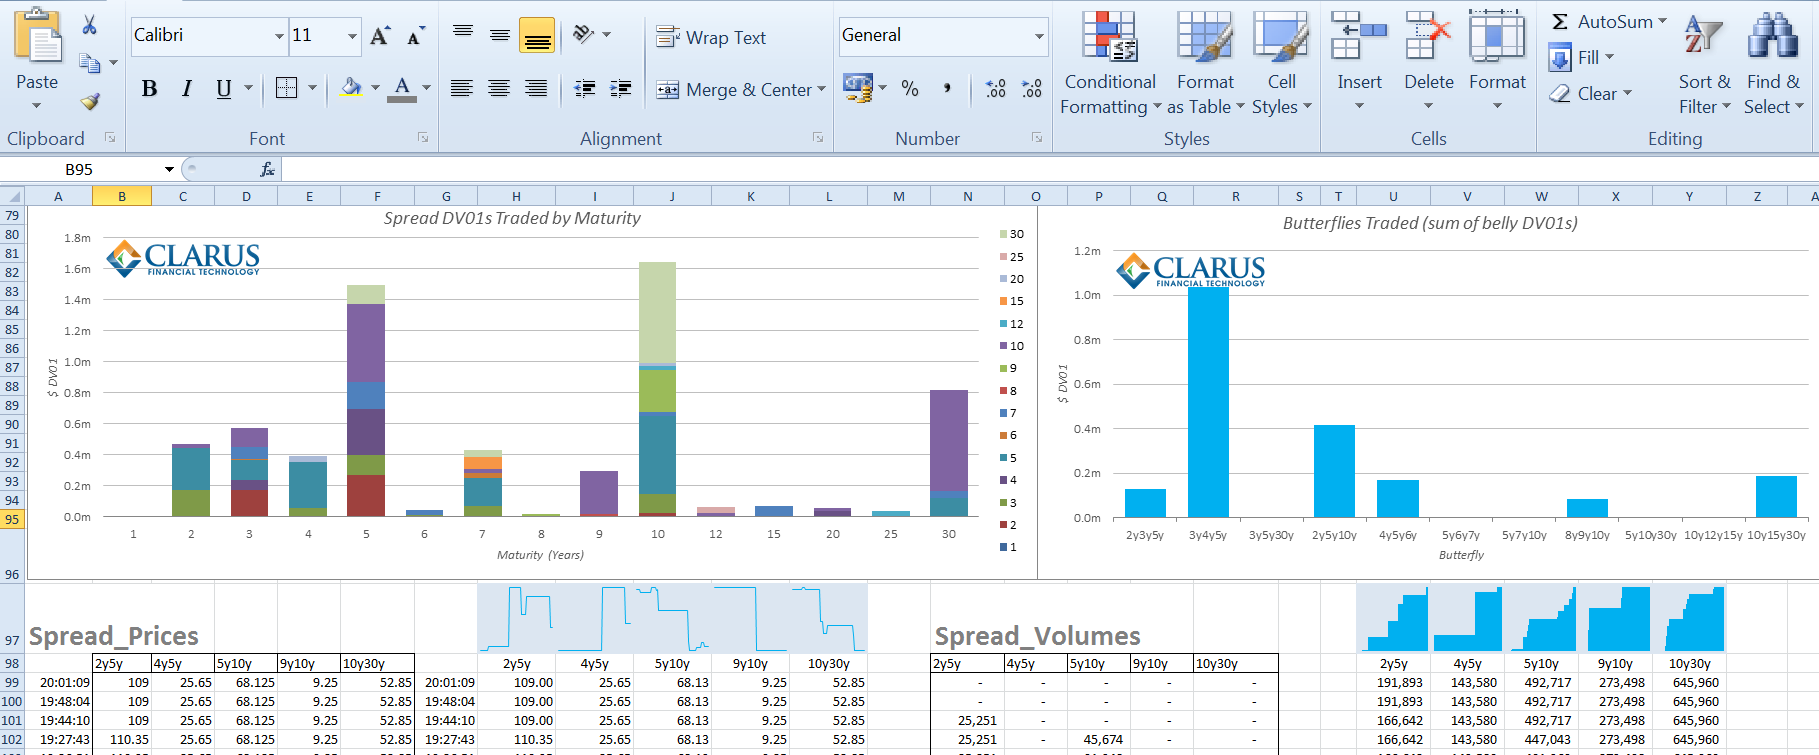
What we can do with the October 3rd data is analyse the movement of prices. We will focus upon spreads trading in >$250k DV01, which leaves us with five spreads: 2y5y, 4y5y, 5y10y, 9y10y and 10y30y. We use the Clarus API and generate Excel sparklines to quickly analyse the intraday trends.
Spread Price Trends
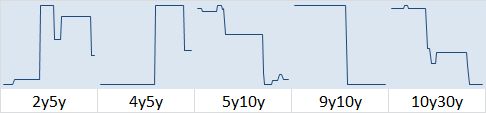
For me, this is why leveraging the API is so powerful. We can instantly see that we have two competing curve moves on Friday – the curve steepening up to 5 years and then flattening beyond there. 10s30s was the most active spread and the graph highlights the “one-way” nature of the move.
Spread Volume Trends
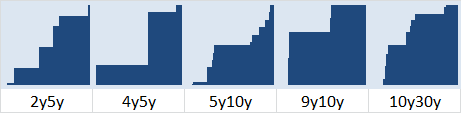
Looking at this volume data, it is apparent that the 1y gaps trade in-frequently and mostly as a function of the larger maturity gaps. We also see that 10y30y was active throughout the day – just count the notches for an indication of the number of trades. In addition, 5y10y saw a lot of smaller trades coming into the end of the day as the curve was steepening back up.
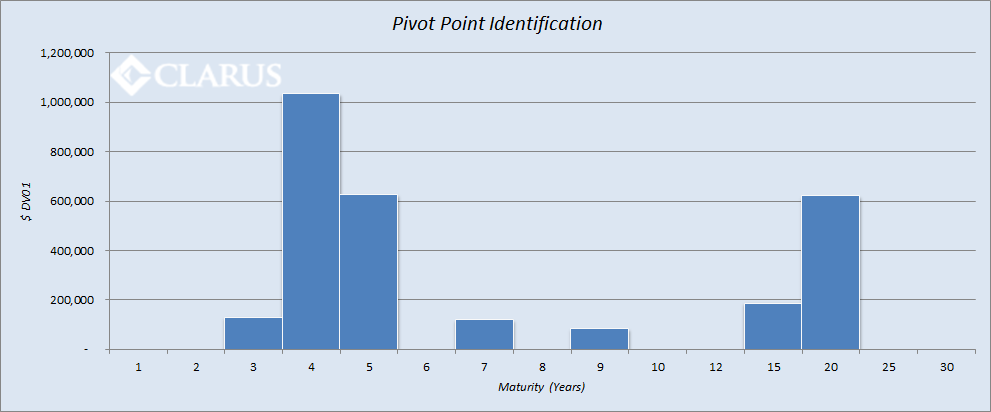
Butterflies
As we know, spreads do not trade in a vacuum and are inherently linked to butterflies. We therefore verify the above analysis through the identification of the pivot point on the curve. This is done by looking at which butterflies traded. Over the course of October 3rd, summing the DV01 for trades where the point on the curve is the belly, we see that 4 years is certainly the “Pivot Point” on this particular day. This nicely ties-in with the above price and volume data that we see from the spread market.
In Summary
- The Clarus API allows us to quickly identify, monitor and analyse spreads and butterflies.
- We have the information in both price and volume terms.
- Looking at changes in price allows us to identify market trends, and these trends are verified by analysing volume data in parallel.
- Intraday, we are able to look at markets in close-to-real time, using an Excel-based Spreads&Flies monitor (see below).
If you want to get a test-drive of something similar to the below in Excel, please feel free to get in contact.