- Rates markets have grown to stand at over $350tn in monthly volumes.
- Our data product, CCPView, provides transparency data covering 93% of these global volumes on a daily basis.
- We benchmark our data versus periodic BIS data below.
- Data analysis needs to be timely and accurate.
- Contact us today for a CCPView subscription.
During recent research, we’ve been looking at the total notional traded across all interest rate derivatives in six major currencies, across both OTC and ETD markets.
I was a little shocked to discover that the notional volumes can be as high as $350tn per month. And that total DV01 transacted can be over $55bn in a volatile month (such as March 2020).
It begs the question – what is the total size of Rates markets?
Our global data product, CCPView, provides volume data for both OTC and ETD markets. Therefore, let’s calibrate these Clarus volumes versus BIS data for our readers.
BIS Triennial Survey Headlines
Many of us may be familiar with the following headline statistics from the most recent Triennial survey out of the BIS:
Daily turnover of OTC interest rate derivatives averaged $6.5 trillion in April 2019.
BIS Triennial Central Bank Survey 2019
Average daily turnover in US dollar-denominated contracts amounted to $3.3 trillion in April 2019.
However, when we drill-down into these OTC statistics, we find that these headline figures are misleading. The volumes are heavily skewed higher by non-price-forming activity, including compression (at CCPs) and intra-entity trades (typically uncleared). The BIS provides a great commentary on these aspects here, under the sub-headings “More comprehensive reporting and the rise in related party trades” and “Portfolio compression usage expands“.
BIS Price-Forming Volumes
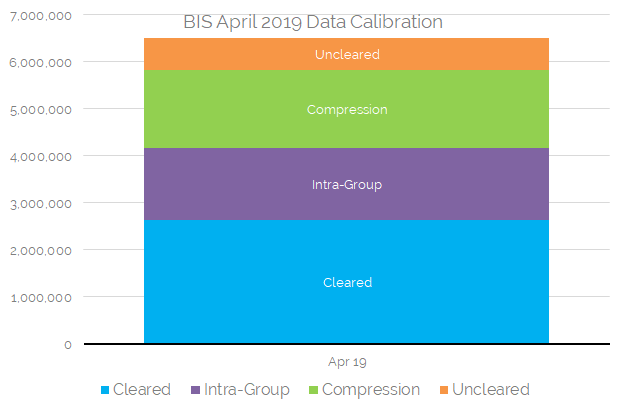
Calibrating the BIS data, we therefore find the following break-down of volumes in terms of the headline $6.5tn Average Daily Volume from April 2019:
- $2.64tn is related to Cleared OTC markets. Our data product, CCPView, provides transparency for all of these volumes.
- $1.54tn is related to Intra-Group activity (and hence non-price forming).
- $1.66tn is related to Compression activity (both non-price forming and typically cleared).
- Just $0.67tn is related to activity in Uncleared markets (e.g. Swaptions).

As market participants, what all this means is that we only really care about the $2.64tn in Cleared activity (which is transparent via CCPView) and the $0.67trn in Uncleared activity (which is somewhat transparent via SDRView and we hope MIFIDView in the future for European data).
BIS Exchange Traded Derivative Volumes (“Futures”)
The volumes in OTC markets do not operate in a vacuum. They are inherently linked to other parts of Rates trading, including futures and cash bonds.
The BIS data on Exchange Traded Derivatives can therefore be used for April 2019 to combine with the above Triennial survey data for OTC markets:

Showing;
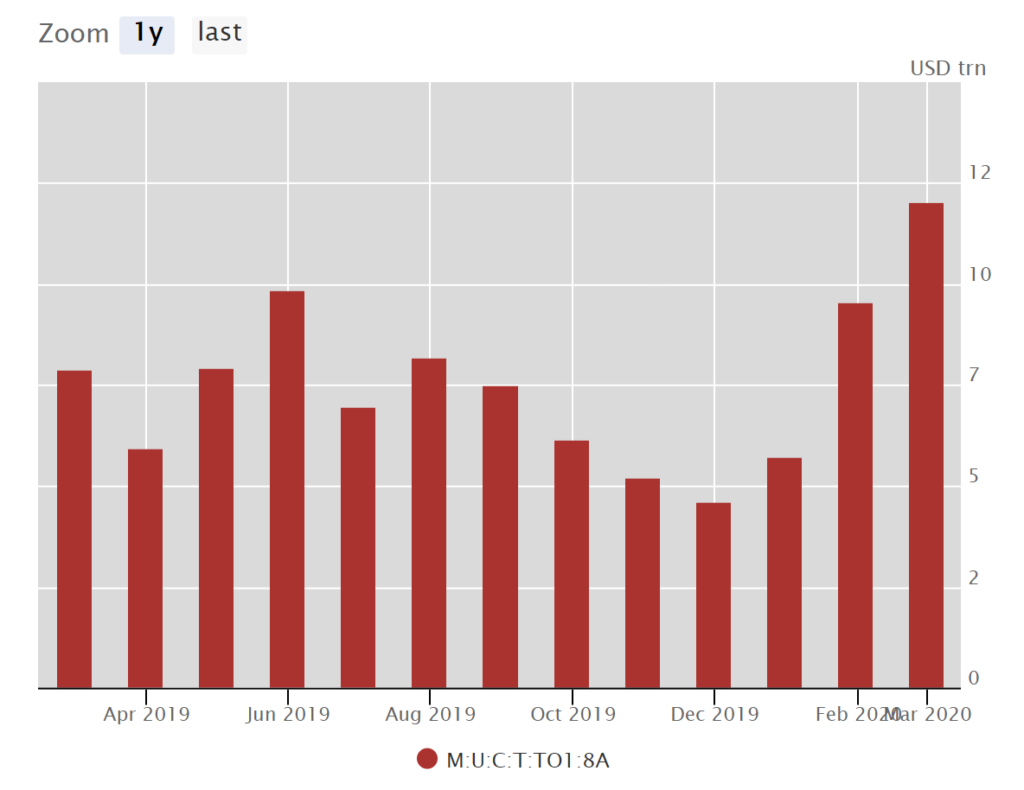
- Average daily turnover in Interest Rate Derivative futures was $5.95tn in April 2019. This includes money market futures (e.g. Eurodollars and Fed Funds) and bond futures.
- That grew to $12tn as of March 2020!
BIS Total Market Size
Combining these two data points from the BIS, it suggests that:
- Cleared OTC volumes were ~$55.3tn in April 2019 (ADV of $2.64tn over 21 days).
- Uncleared OTC volumes were ~$14tn,
- Futures volumes were $125tn.
- Suggesting a total in April 2019 of $194tn (combined ADV = $9.3tn).
Clarus CCPView Provides Transparency for 93% of Volumes
Benchmarking against this $194tn figure, I therefore looked at the total volumes in CCPView (across both OTC and ETD) for April 2019:

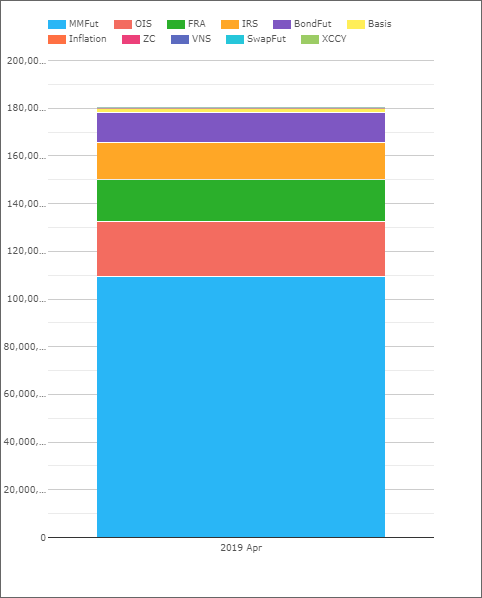
Showing;
- CCPView records a total monthly notional amount of $180.3tn in April 2019.
- This is across all OTC and ETD interest rate derivatives.
- It is therefore directly comparable to the BIS survey data.
- Overall, we can therefore state that CCPView provides coverage of 93% of total trading activity.
The missing part? The 7% is related to uncleared trading activity. For Rates markets, this is mainly options (non-linear) products such as swaptions, caps and floors.
Data
This calibration versus BIS data clarifies our value proposition for CCPView:
- CCPView data is updated daily.
- CCPView covers 93% of the market.
- Data analysis needs to be timely and accurate.
We know how difficult it is to calibrate stale data to current market conditions, particularly after such a turbulent period as March 2020. CCPView, with a 93% market coverage, takes this headache away by providing daily transparency data for the derivatives market.
Recent Data
As our readers may well note, the BIS volumes above for April 2019 fall somewhat short of the $350tn I mentioned at the top of the blog.
If you check out the BIS data for ETD above, you will notice that April 2019 ADVs were ~$6tn. These these doubled in March 2020 to grow to $12tn!
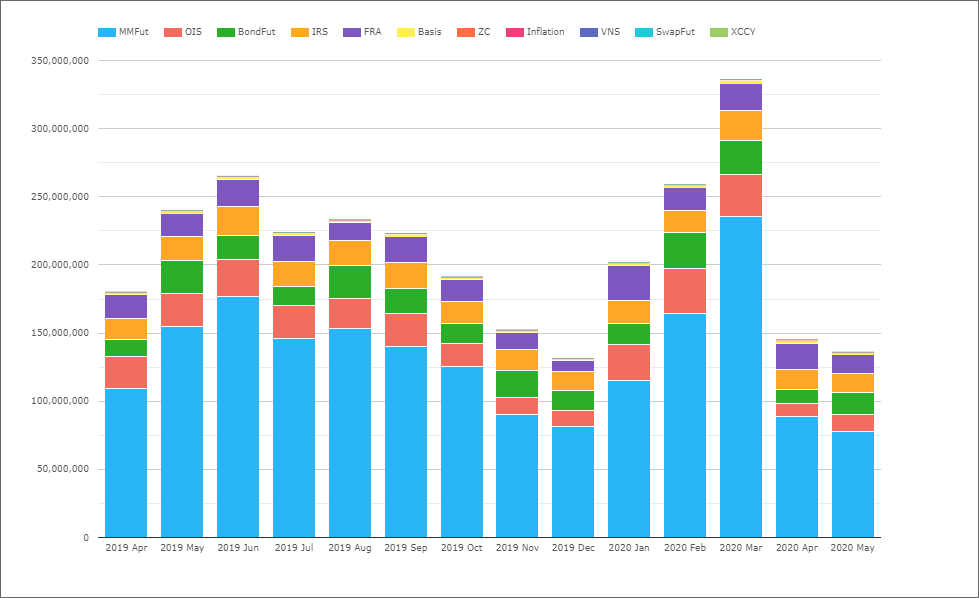
Our own time-series of data shows how volatile these volumes are on a month-by-month basis. And shows $300tn+ in volumes during March 2020:

Some causes of this volatility in monthly volumes are:
- There are expected to be periodic peaks in ETD volumes due to contract rolls. These may happen in e.g. Mar, June, Sep and Dec for Eurodollar futures at the CME which roll quarterly.
- These are notional equivalent amounts. They are therefore subject to peaks when more short-end trading is taking place (evident in the April 2019 BIS survey month, highlighted by “The Changing Interest Rate Environment” by the BIS).
- Money Market futures alone (dominated by CME’s Eurodollar contracts) account for 60-70% of total volumes each month. Any variability in these volumes therefore has a large impact on overall volumes. For example, $150tn more traded in money market futures in March 2020 than April 2020!
Granularity
The above chart from CCPView is split by product-type to be consistent with the BIS data sources. It can also be split by:
- Currency. USD markets are a huge portion of this, accounting for over 70% of volumes in some months (again thanks to Eurodollars).
- Tenor. We provide a tenor split for both OTC and ETD products. This allows this data to be restated into DV01 risk equivalent terms.
- Other drill-down data such as contract-specific volumes and product subtypes in OTC (basis, FRAs, IRS etc).
Bond Data!
Finally, I cannot let the opportunity pass to also highlight that we now have post-trade transparency data for US Treasuries. That means we have even more data than the BIS!
The inclusion of Treasuries volumes pushes total monthly Rates markets to over $350tn during March 2020:

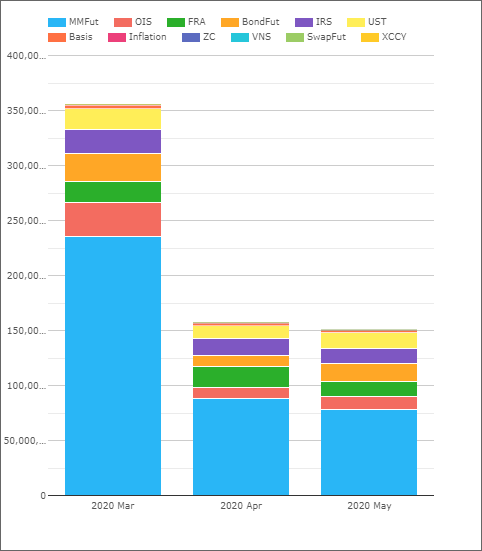
In Summary
- Rates markets have now reached $350tn in monthly volumes.
- Clarus data provides daily transparency data on 93% of global derivatives volumes.
- Timely and accurate data analysis is just a subscription away.
- And you even get post-trade transparency data on US Treasuries as part of the deal!
- Contact us today.