- Trading reached $6.5trn per day in Interest Rate Derivatives during April 2019.
- Our markets have grown at unprecedented levels in the past three years.
- The BIS used our own CCPView data to cross-check the survey results.
BIS IRD Volumes in April 2019
The latest BIS survey data is now available. Performed once every three years, it provides a snapshot of daily trading volumes across FX and Interest Rate markets.
The most striking part of the data is the huge increase in volumes in Interest Rate Derivatives.
Last time out, back in April 2016, Average Daily Volumes (ADV) were $2.7 Trillion (trn). A huge market no doubt, but broadly in line with where volumes had been since 2010 (at $2trn).
April 2019 recorded ADVs of $6.5trn!
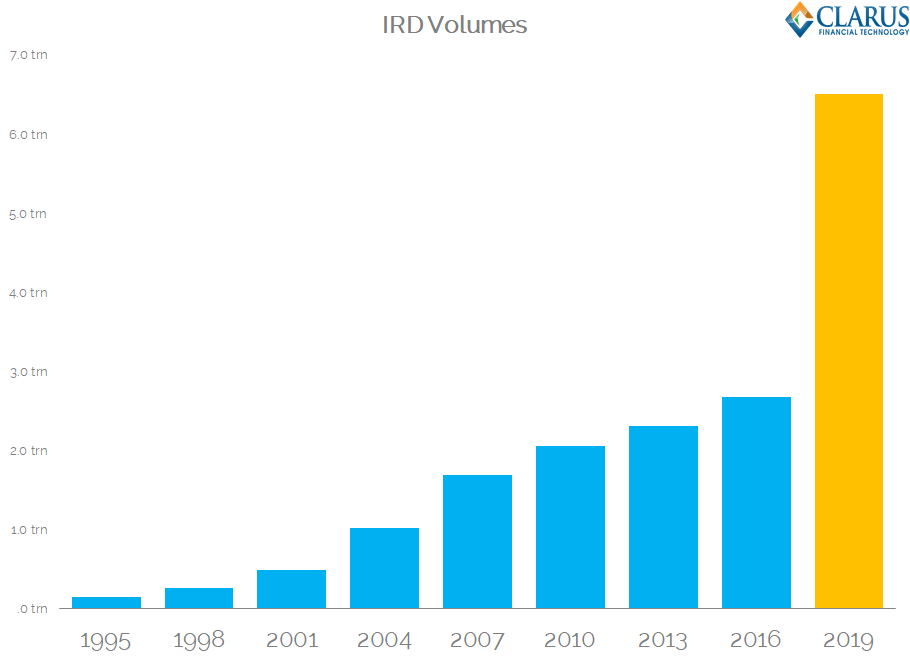
- Volumes were 2.4 times greater in 2019 than 2016.
- With all of the regulations enacted in that 3 year time period, did anyone see that amount of underlying volume growth coming?!
This means that, for the first time, Interest Rate markets are just as large as FX markets when measured by daily notional turnover:
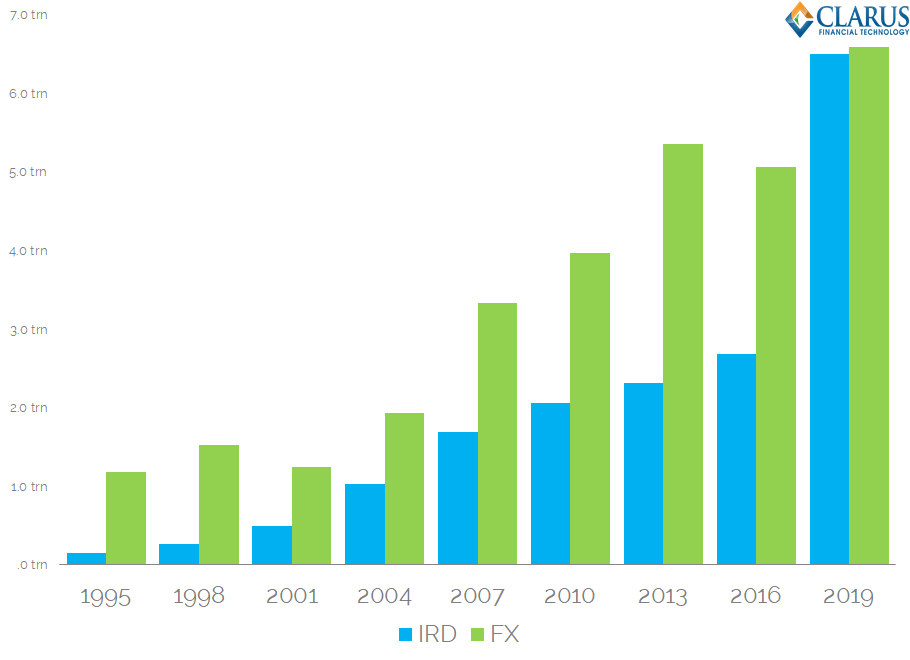
Both markets now record $6.5trn in Average Daily Volumes.
Where Has the Growth Come From?
The amount of growth is so incredible it is worth dwelling on where it has come from. Let’s take a look at growth rates per currency between 2016 and 2019:
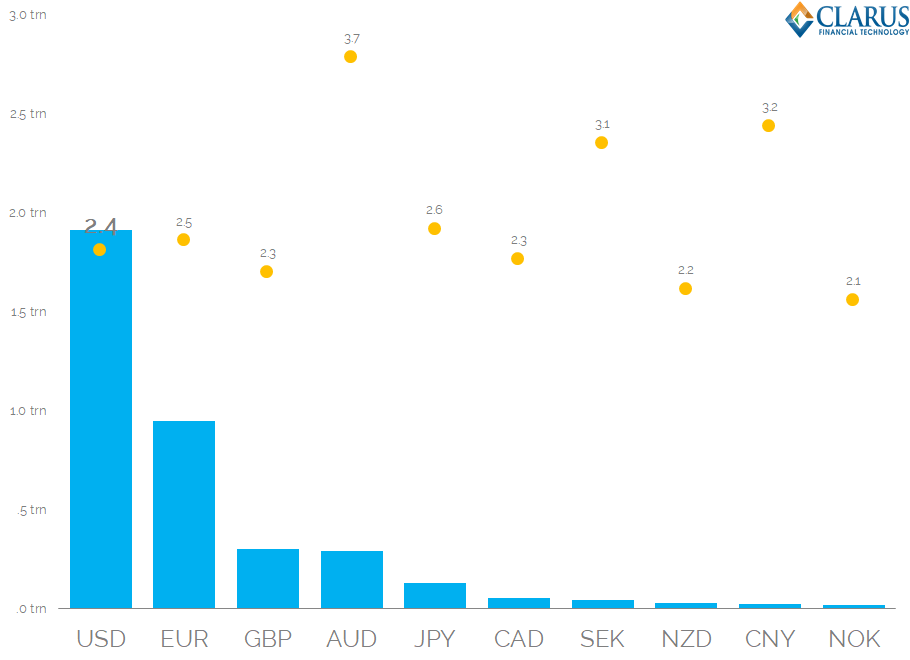
Growth rates of IRD trading per currency from BIS Triennial Surveys
Showing;
- The top ten currencies as ranked by the amount of increase of trading activity between 2016 and 2019.
- USD swap trading alone saw an increase of almost $2trn PER DAY!
- This is equivalent to an increase of 2.4 times the 2016 activity (i.e. from $1.4trn to $3.3trn per day in USD swaps alone).
- AUD saw the highest percentage increase in activity, moving from $108bn to $401bn in daily activity (3.7x increase).
Is This Believable?
The increase in volumes is so large that there will no doubt be somewhat of an inquisition as to the data quality. Reading the limited commentary that the BIS themselves have published so far shows the potential for three effects:
- Increased activity in short-dated instruments (OIS and FRAs).
- More reporting of inter-entity swaps – i.e. more and more risk is being back-to-backed into risk management hubs.
- More compression.
However, the BIS do acknowledge that these effects alone are not enough to explain the increase. So they also point to other data providers. Quoting ClarusFT, they state:
For example, data from Clarus FT point to a similar rate of growth in turnover in OTC interest rate derivatives (FRAs, OIS and other single currency interest rate swaps) from April 2016 to April 2019. These data cover notional trading volumes reported by all major central clearing counterparties (CCPs) globally but are on a post-novation basis, while data collected for the Triennial Survey are on a pre-novation basis. BIS monthly statistics on the turnover of interest rate derivatives on exchanges show a lower rate of growth, about 50%, between April 2016 and April 2019.
BIS Triennial Survey (quoting ClarusFT data).
There you go – Clarus are now the go-to source to check your data credibility these days!
Which Clarus Data do the BIS quote?
The data product to which BIS are referring to is called CCPView. Free trials are available if you contact us. Our data Principles and Sources are outlined on our CCPView product page here.
We have previously compared BIS stats to our own and we analysed in-depth the April 2016 survey data:
- BIS 2016 Data and Clearing Mandates
- Understanding BIS Derivatives Statistics
- What is the size of the Uncleared IRS Market?
As BIS state in their survey notes, our data employs a single-counted methodology for all cleared trades. In the BIS Triennial Survey, all cleared trades are also single-counted:
OTC derivatives transactions that are centrally cleared via central counterparties (CCPs) were reported on a pre-novation basis (ie with the original execution counterpart as counterparty). Any post-trade transaction records that arise from central clearing via CCPs (eg through novation) were not reported as additional transactions.
BIS Triennial Survey Commentary 2019
What Does the Clarus Data Show?
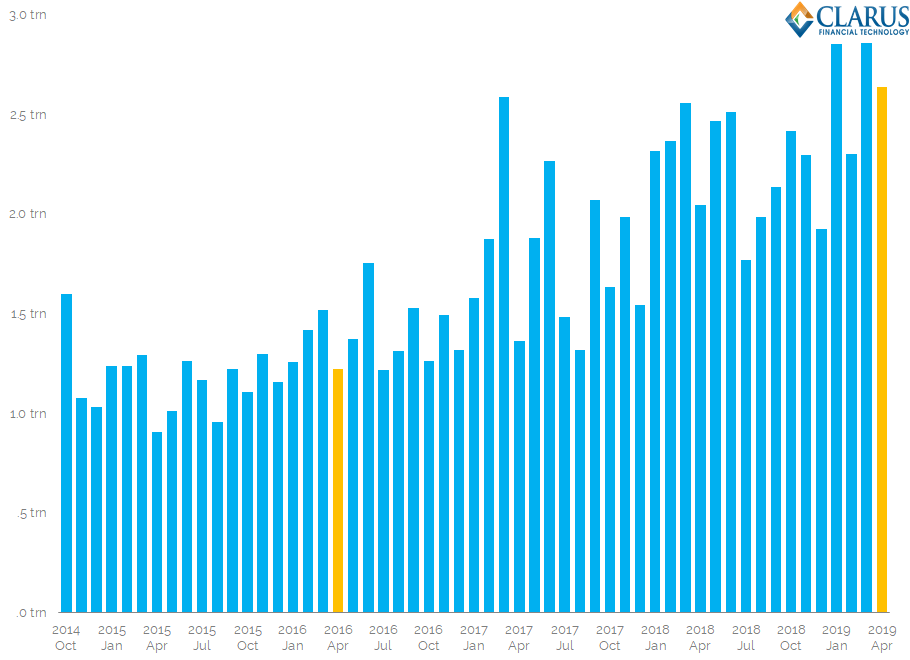
The specific data that the BIS are referring to is from CCPView:
Showing;
- Our monthly volumes from CCPView expressed as Average Daily Volume per month.
- In April 2016, CCPView recorded ADVs of $1.2trn.
- In April 2019, CCPView recorded ADVs of $2.6trn.
- These totals are lower than the BIS data because we look only at Cleared volumes. The difference ($3.87trn) is the size of the daily uncleared derivatives market.
- In terms of growth rates, our data shows that cleared trading activity more than doubled (2.2x from April 2016 to April 2019).
- This is pretty much in-line with the BIS survey showing a 2.4x growth rate.
Therefore, whilst the headline may be a shock, we really shouldn’t have been surprised. Yes, the BIS data only comes out once every three years. But Clarus data is updated daily. We were on top of this trend.
(I am, however, surprised at the growth of uncleared markets as well. As the BIS point out, some of this is due to inter-entity trades. More analysis will arrive in future blogs).
Clarus Tenor Data
Using Clarus data, we can show that:
- April 2019, 70% of notional was either FRA or OIS.
- In April 2016, only 62% of notional was FRA or OIS.
That doesn’t seem a great difference to me? However, in April 2019, nearly 75% of all products traded were 2 year tenors:
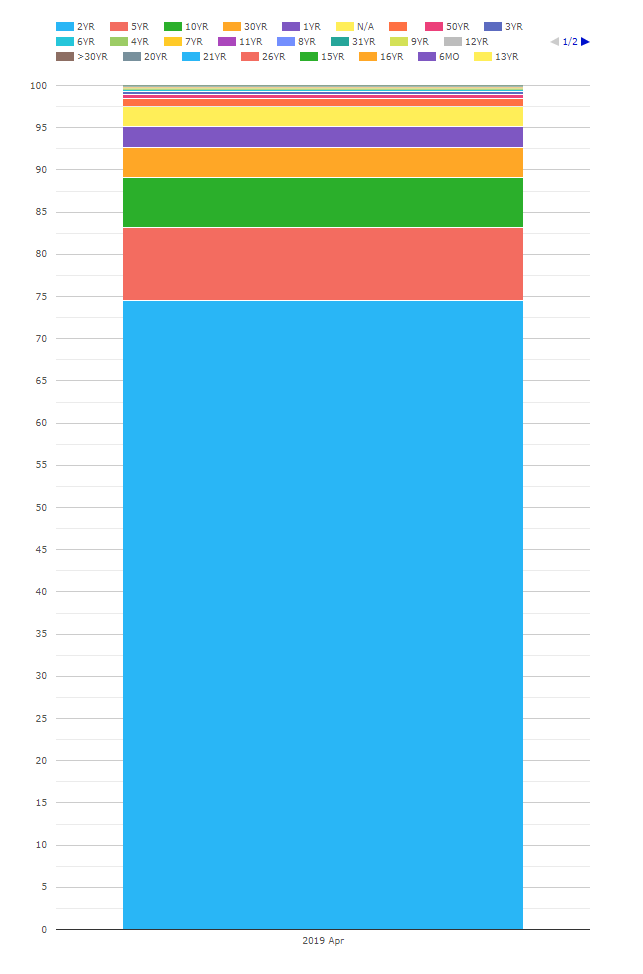
This tenor data is not something you will find in the BIS Triennial Survey data. Please reach out to us if you would like to analyse it further.
The BIS themselves will launch fresh analysis in December 2019 as part of their quarterly review.
In Summary
- Activity in Interest Rate Derivatives grew 2.4 fold in the past three years to reach $6.5trn per day.
- This increase in activity is shown in the latest BIS Triennial Survey which is backed up by Clarus CCPView data.
- Interest Rate markets are now just as big as FX markets.
- Volumes may have been inflated by an increase in short-end trading, more compression and more back-to-back bookings.
- We will analyse all of these effects in due course.
- Clarus data shows an extremely strong underlying growth rate in Cleared markets, with volumes increasing 2.2 times to stand at $2.6trn per day.
How did Basel compute Daily FX volume? What period was used to arrive at the daily average volume across ccy and products?
Thanks for the question. The observation period was the whole of April 2019. The methodology is survey based, whereby “Sales desks” for reporting dealers send their daily volumes to the BIS for aggregation. Happy to provide more on the methodology if of interest.
Cheers
Chris